Implementing Demand Planning and Inventory Optimization Software with the Right Data

Data verification and validation are essential to the success of the implementation of software that performs statistical analysis of data, like Smart IP&O.  This article describes the issue and serves as a practical guide to doing the job right, especially for the user of the new application.

The less experience your organization has in validating historical transactions or item master attributes, the more likely it is there were problems or mistakes with data entry into the ERP that have so far gone unnoticed.  The garbage in, garbage out rule means you need to prioritize this step of the software onboarding process or risk delay and possible failure to generate ROI.

Ultimately the best person to confirm data in your ERP is entered correctly is the person who knows the business and can assert, for example, “this part doesn’t belong to that product group.”  That’s usually the same person who will open and use Smart. Though a database administrator or IT support can also play a key role by being able to say, “This part was assigned to that product group last December by Jane Smith.” Ensuring data is correct may not be a regular part of your day job but can be broken down into manageable small tasks that a good project manager will allocate the time and resources to complete.

The demand planning software vendor receiving the data also has a role.  They will confirm that the raw data was ingested without issue. The vendor can also identify abnormalities in the raw data files that point to the need for validation.  But relying on the software vendor to reassure you the data looks fine is not enough.  You don’t want to discover, after go-live, that you can’t trust the output because some of the data “doesn’t make sense.”

Each step in the data flow needs verification and validation.  Verification means the data at one step is still the same after flowing to the next step.  Validation means the data is correct and usable for analysis

The most common data flow looks like this:

Implementing Demand Planning and Inventory Optimization Software with the Right Data set

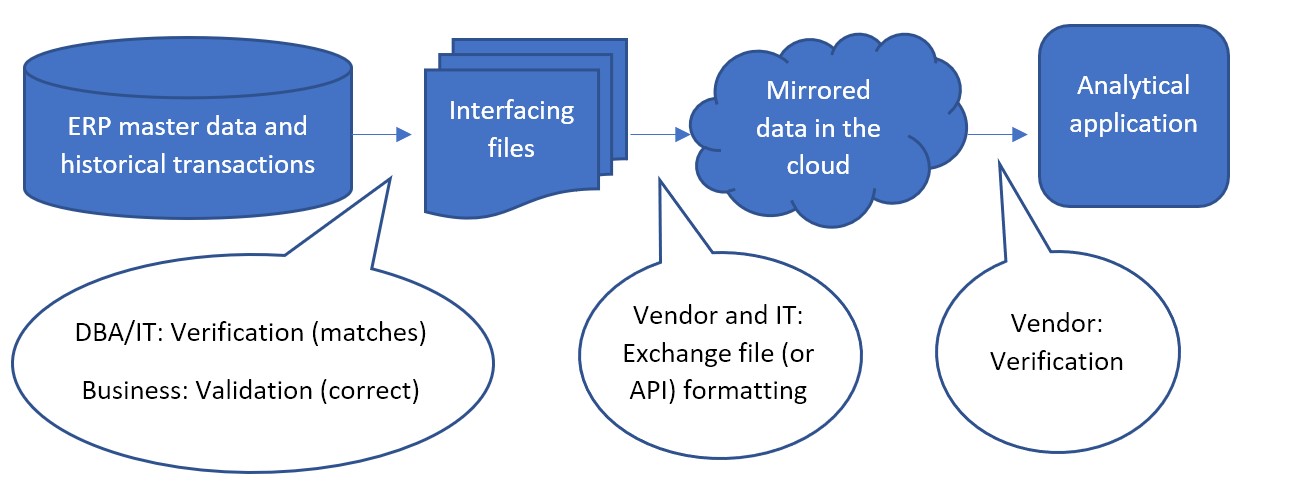
Less commonly, the first step between ERP master data and the interfacing files can sometimes be bypassed, where files are not used as an interface.  Instead, an API built by IT or the inventory optimization software vendor is responsible for data to be written directly from the ERP to the mirrored database in the cloud.  The vendor would work with IT to confirm the API is working as expected.  But the first validation step, even in that case, can still be performed.  After ingesting the data, the vendor can make the mirrored data available in files for the DBA/IT verification and business validation.

The confirmation that the mirrored data in the cloud completes the flow into the application is the responsibility of the vendor of software as a service.  SaaS vendors continually test that the software works correctly between the front-end application their subscribers see and the back-end data in the cloud database. If the subscribers still think the data doesn’t make sense in the application even after validating the interfacing files before going live, that is an issue to raise with the vendor’s customer support.

However the interfacing files are obtained, the largest part of verification and validation falls to the project manager and their team.  They must resource a test of the interfacing files to confirm:

  1. They match the data in the ERP. And that all and only the ERP data that was necessary to extract for use in the application was extracted.
  2. Nothing “jumps out” to the business as incorrect for each of the types of information in the data
  3. They are formatted as expected.


DBA/IT Verification Tasks

  1. Test the extract:

IT’s verification step can be done with various tools, comparing files, or importing files back to the database as temporary tables and joining them with the original data to confirm a match.  IT can depend on a query to pull the requested data into a file but that file can fail to match. The existence of delimiters or line returns within the data values can cause a file to be different than its original database table.  It is because the file relies heavily on delimiters and line returns to identify fields and records, while the table doesn’t rely on those characters to define its structure.

  1. No bad characters:

Free form data entry fields in the ERP, such as product descriptions, can sometimes themselves contain line returns, tabs, commas, and/or double quotes that can affect the structure of the output file.  Line returns should not be allowed in values that will be extracted to a file.  Characters equal to the delimiter should be stripped during extract or else a different delimiter used.

Tip: if commas are the file delimiter, numbers greater than 999 can’t be extracted with a comma. Use “1000” rather than “1,000”.

  1. Confirm the filters:

The other way that query extracts can return unexpected results is if conditions on the query are entered incorrectly.  The simplest way to avoid mistaken “where clauses” is to not use them.  Extract all data and allow the vendor to filter out some records according to rules supplied by the business.  If this will produce extract files so large that too much computing time is spent on the data exchange, the DBA/IT team should meet with the business to confirm exactly what filters on the data can be applied to avoid exchanging records that are meaningless to the application.

Tip: Bear in mind that Active/Inactive or item lifecycle information should not be used to filter out records.  This information should be sent to the application so it knows when an item becomes inactive.

  1. Be consistent:

The extract process must produce files of consistent format every time it is executed.  File names, field names, and position, delimiter, and Excel sheet name if Excel is used, numeric formats and date formats, and the use of quotes around values should never differ from one execution of the extract one day to the next. A hands-off report or stored procedure should be prepared and used for every execution of the extract.


Business Validation Background

Below is a break down each of validation step into considerations, specifically in the case where the vendor has provided a template format for the interfacing files where each type of information is provided in its own file.  Files sent from your ERP to Smart are formatted for easy export from the ERP.  That sort of format makes the comparison back to the ERP a relatively simple job for IT, but it can be harder for the business to interpret.  Best practice is to manipulate the ERP data, either by using pivot tables or similar in a spreadsheet.  IT may assist by providing re-formatted data files for review by the business.

To delve into the interfacing files, you’ll need to understand them.  The vendor will supply a precise template, but generally interfacing files consist into three types: catalog data, item attributes, and transactional data.

  • Catalog data contains identifiers and their attributes. Identifiers are typically for products, locations (which could be plants or warehouses), your customers, and your suppliers.
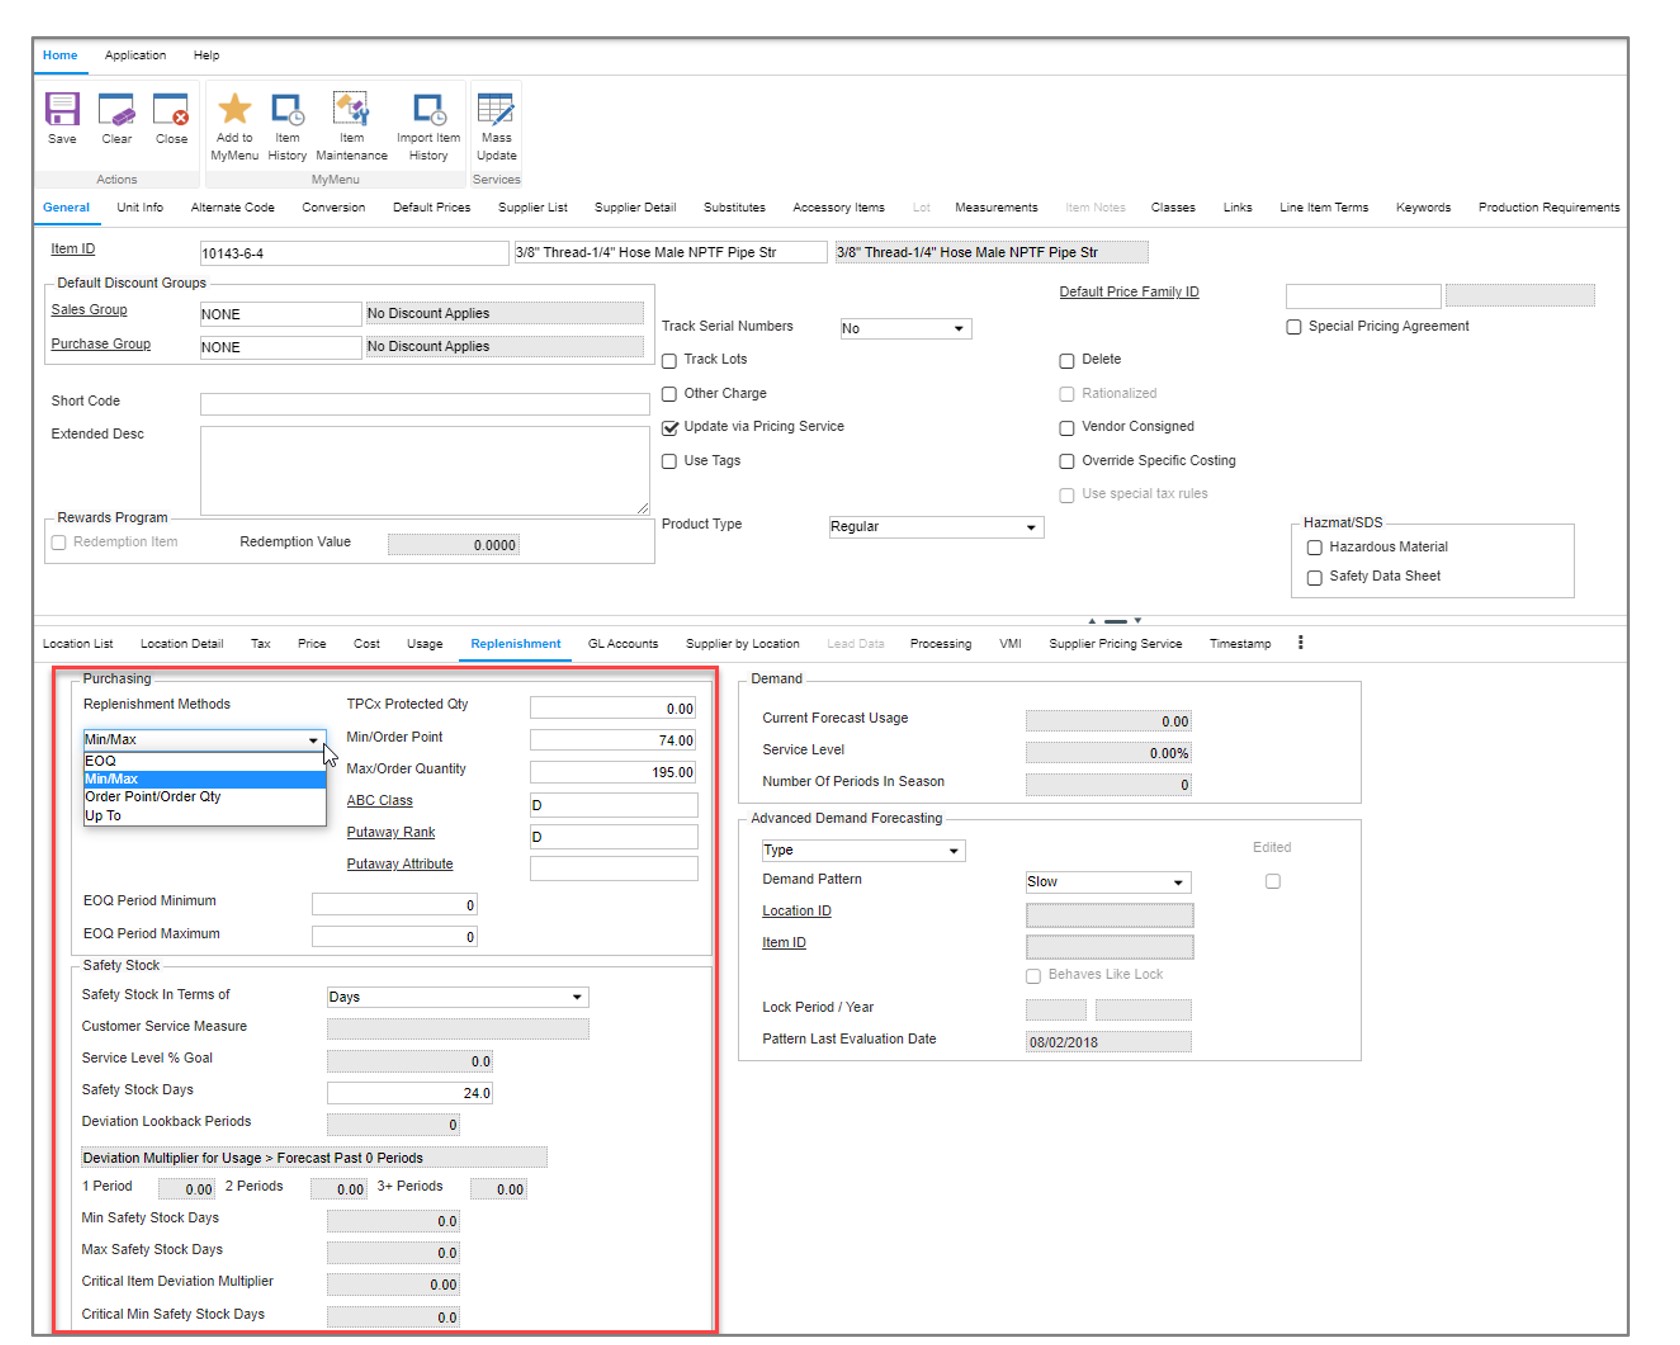
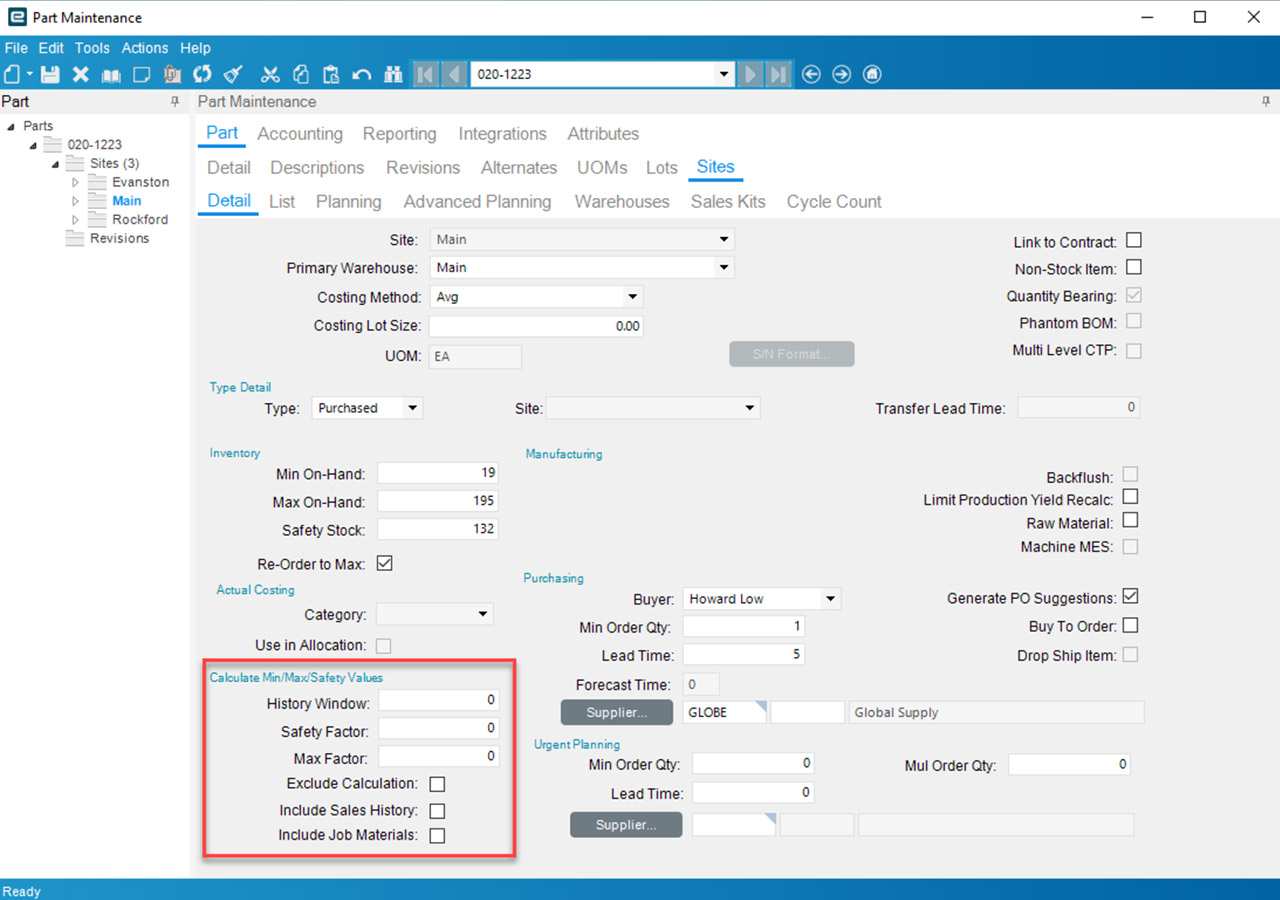
  • Item attributes contain information about products at locations that are needed for analysis on the product and location combination. Such as:
    • Current replenishment policy in the form of a Min and Max, Reorder Point, or Review Period and Order Up To value, or Safety Stock
    • Primary supplier assignment and nominal lead time and cost per unit from that supplier
    • Order quantity requirements such as minimum order quantity, manufacturing lot size, or order multiples
    • Active/Inactive status of the product/location combination or flags that identify its state in its lifecycle, such as pre-obsolete
    • Attributes for grouping or filtering, such as assigned buyer/planner or product category
    • Current inventory information like on hand, on order, and in transit quantities.
  • Transactional data contains references to identifiers along with dates and quantities. Such as quantity sold in a sales order of a product, at a location, for a customer, on a date.  Or quantity placed on purchase order of a product, into a location, from a supplier, on a date. Or quantity used in a work order of a component product at a location on a date.


Validating Catalog Data

Considering catalog data first, you may have catalog files similar to these examples:

Implementing Demand Planning and Inventory Optimization Software 111

Location Identifier Description Region Source Location  etc…
Location1 First location North    
Location2 Second location South Location1  
Location3 Third location South Location1  
…etc…        


Customer Identifier Description SalesPerson Ship From Location  etc…
Customer1 First customer Jane Location1  
Customer2 Second customer Jane Location3  
Customer3 Third customer Joe Location2  
…etc…        


Supplier Identifier Description Status Typical Lead                 Time Days  etc…
Supplier1 First supplier Active 18  
Supplier2 Second supplier Active 60  
Supplier3 Third Supplier Active 5  
…etc…        


1: Check for a reasonable count of catalog records

For each file of catalog data, open it in a spreadsheet tool like Google Sheets or MS Excel. Answer these questions:

  1. Is the record count in the ballpark? If you have about 50K products, there should not be only 10K rows in its file.
  2. If it’s a short file, maybe the Location file, you can confirm exactly that all expected Iidentifiers are in it.
  3. Filter by each attribute value and confirm again the count of records with that attribute value makes sense.

2: Check the correctness of values in each attribute field

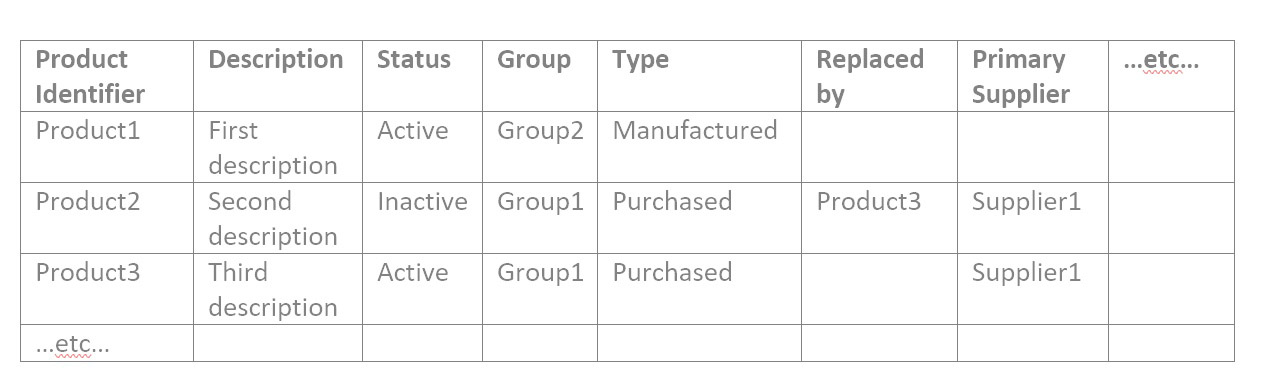
Someone who knows what the products are and what the groups mean needs to take the time to confirm it is actually right, for all the attributes of all the catalog data.

So, if your Product file contains the attributes as in the example above, you would filter for Status of Active, and check that all resulting products are actually active.  Then filter for Status of Inactive and check that all resulting products are actually inactive.  Then filter for the first Group value and confirm all resulting products are in that group.  Repeat for Group2 and Group3, etc.  Then repeat for every attribute in every file.

It can help to do this validation with a comparison to an already existing and trusted report.  If you have another spreadsheet that shows products by Group for any reason, you can compare the interfacing files to it.  You may need to familiarize yourself with the VLOOKUP function that helps with spreadsheet comparison.

Validating Item Attribute Data

1: Check for a reasonable count of item records

The item attribute data confirmation is similar to the catalog data.  Confirm the product/location combination count makes sense in total and for each of the unique item attributes, one by one. This is an example item data file:

Implementing Demand Planning and Inventory Optimization Software 22

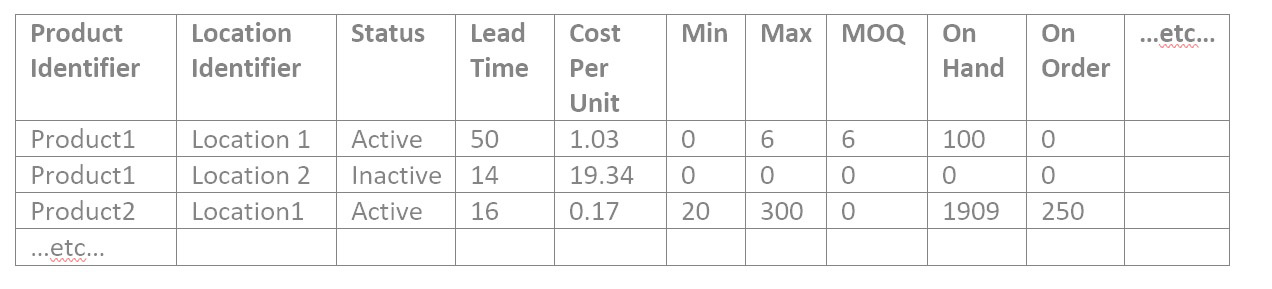
2: Find and explain weird numbers in item file

There tends to be many numerical values in the item attributes, so “weird” numbers merit review.  To validate data for a numerical attribute in any file, search for where the number is:

  • Missing entirely
  • Equal to zero
  • Less than zero
  • More than most others, or less than most others (sort by that column)
  • Not a number at all, when it should be

A special consideration of files that are not catalog files is they may not show the descriptions of the products and locations, just their identifiers, which can be meaningless to you.  You can insert columns to hold the product and location descriptors that you are used to seeing and fill them into the spreadsheet to assist in your work.  The VLOOKUP function works for this as well.  Whether or not you have another report to compare the Items file to, you have the catalog files for Products and Location with show both the identifier and the description for each row.

3: Spot check

If you are frustrated to find that there are too many attribute values to manually check in a reasonable amount of time, spot checking is a solution. It can be done in a manner likely to pick up on any problems.  For each attribute, get a list of the unique values in each column.  You can copy a column into a new sheet, then use the Remove Duplicates function to see the list of possible values.   With it:

  1. Confirm that no attribute values are present that shouldn’t be.
  2. It can be harder to remember which attribute values are missing that should be there, so it can help to look at another source to remind you. For example, if Group1 through Group12 are present, you might check another source to remember if these are all the Groups possible.  Even if it is not required for the interfacing files for the application, it may be easy for IT to extract a list of all the possible Groups that are in your ERP which you can use for the validation exercise.  If you find extra or missing values that you don’t expect, bring an example of each to IT to investigate.
  3. Sort alphabetically and scan down to see if any two values are similar but slightly different, maybe only in punctuation, which could mean one record had the attribute data entered incorrectly.

For each type of item, maybe one from each product group and/or location, check that all its attributes in every file are correct or at least pass a sanity check.  The more you can spot check from a broad range of items, the less likely you will have issues post go live.


Validating Transactional Data

Transactional files may all have a format similar to this:

Implementing Demand Planning and Inventory Optimization Software 333


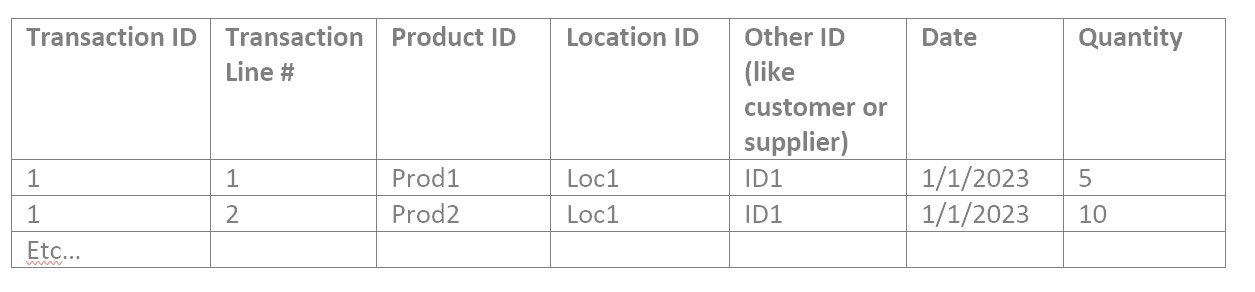
1: Find and explain weird numbers in each transactional file

These should be checked for “weird” numbers in the Quantity field.  Then you can proceed to:

  1. Filter for dates outside the range you expect or missing expected dates entirely.
  2. Find where Transaction identifiers and line numbers are missing. They shouldn’t be.
  3. If there is more than one record for a given Transaction ID and Transaction Line Number combination, is that a mistake? Put another way, should duplicate records have their quantities summed together or is that double counting?

2: Sanity check summed quantities

Do a sanity check by filtering to a particular product you’re familiar with, and filter to a relatable date range such as last month or last year, and sum the quantities.  Is that total amount what you expected for that product in that time frame?  If you have information on total usage out of a location, you can slice the data that way to sum the quantities and compare to what you expect.  Pivot tables come in handy for verification of transactional data.  With them, you can view the data like:

Product Year Quantity Total
Prod1 2022 9,034
Prod1 2021 8,837
etc    


The products’ yearly total may be simple to sanity check if you know the products well.  Or you can VLOOKUP to add attributes, such as product group, and pivot on that to see a higher level that is more familiar:

Product Group Year Quantity Total
Group1 2022 22,091
Group2 2021 17,494
etc    


3: Sanity check count of records

It may help to display a count of transactions rather than a sum of the quantities, especially for purchase order data.  Such as:

Product Year Number of POs
Prod1 2022 4
Prod1 2021 1
etc    


And/or the same summarization at a higher level, like:

Product Group Year Number of POs
Group1 2022 609
Group2 2021 40
etc    


4: Spot checking

Spot checking the correctness of a single transaction, for each type of item and each type of transaction, completes due diligence.  Pay special attention to what date is tied to the transaction, and whether it is right for the analysis.  Dates may be a creation date, like the date a customer placed an order with you, or a promise date, like the date you expected to deliver on the customer’s order at the time of creating it, or a fulfilment date, when you actually delivered on the order.  Sometimes a promise date gets modified days after creating the order if it can’t be met.  Make sure the date in use reflects actual demand by the customer for the product most closely.

What to do about bad data 

If the mis-entries are few or one-off, you can edit the ERP records by hand as they are found, cleaning up your catalog attributes, even after go-live with the application.  But if large swathes of attributes or transaction quantities are off, this can spur an internal project to re-enter data correctly and possibly to change or start to document the process that needs to be followed when new records are entered into your ERP.

Care must be taken to avoid too long a delay in implementation of the SaaS application while waiting on clean attributes.  Break the work into chunks and use the application to analyze the clean data first so the data cleansing project occurs in parallel with getting value out of the new application.


Extend Epicor Prophet 21 with Smart IP&O’s Forecasting & Dynamic Reorder Point Planning

In this article, we will review the inventory ordering functionality in Epicor P21, explain its limitations, and summarize how Smart Inventory Planning & Optimization (Smart IP&O) can help reduce inventory, minimize stock-outs and restore your organization’s trust in your ERP by providing robust predictive analytics, consensus-based forecasting, and what-if scenario planning.

Replenishment Planning Features within Epicor Prophet 21
Epicor P21 can manage replenishment by suggesting what to order and when via reorder point-based or forecast-driven inventory policies.  Users may compute these policies externally or generate them dynamically within P21.  Once the policies and forecasts have been specified, P21’s Purchase Order Requirements Generator (PORG) will create automated order suggestions of what to replenish and when by reconciling incoming supply, current on hand, outgoing demand, stocking policies, and demand forecasts.

Epicor P21 has 4 Replenishment Methods
In the item maintenance screen of Epicor P21, users can choose from one of four replenishment methods for each stock item.

  1. Min/Max
  2. Order Point/Order Quantity
  3. EOQ
  4. Up To

There are additional settings and configurations for determining lead times and accounting for order modifiers such as supplier-imposed minimum and maximum order quantities.  Min/Max and Order Point/Order Quantity are considered “static” policies.  EOQ and Up To are considered “dynamic” policies and computed within P21.

Min/Max
The reorder point is equal to the Min.  Whenever on hand inventory drops below the Min (reorder point) the PORG report will create an order suggestion up to the Max (for example, if on hand after the breach is 20 units and the Max is 100 then the order quantity will be 80).  Min/Max is considered a static policy and once entered into P21 will remain unchanged unless overridden by the user.  Users often run spreadsheets to compute the Min/Max values and update them from time to time.

Order Point/Order Quantity
This is the same as the Min/Max policy except instead of ordering up to the Max, an order will be suggested for a fixed quantity defined by the user (for example, always order 100 units when the order point is breached). OP/OQ is considered a static policy and will remain unchanged unless overridden by the user.  Users often run spreadsheets to compute OP/OQ values and update them from time to time.

EOQ
The EOQ policy is a reorder point-based method.  The reorder point is dynamically generated based on P21’s forecast of demand over lead time + demand over the review period + safety stock.  The order quantity is based on an Economic Order Quantity calculation that considers holding costs and ordering costs and attempts to recommend an order size that minimizes total cost.  When on hand inventory breaches the reorder point, the PORG report will kick out an order equal to the computed EOQ.

Up To
The Up To method is another dynamic policy that relies on a reorder point.  It is computed the same way as the EOQ method using P21’s forecasted demand over the lead time + demand over review period + safety stock.   The order quantity suggestion is based on whatever is needed to replenish stock back “up to” the reorder point.  This tends to equate to an order quantity that is consistent with the lead time demand because as demand drives stock below the reorder point, orders will be suggested “up to” the reorder point.

Epicor Prophet 21 with Forecasting Inventory Planning P21

P21’s Item Maintenance Screen where users can specify the desired inventory policy and configure other settings such as safety stock and order modifiers.

Limitations

Forecast Methods
There are two forecast modes in P21:  Basic and Advanced.  Each use a series of averaging methods and require manual configurations and user determined classification rules to generate a demand forecast.  Neither mode is designed with an out-of-the-box expert system that automatically generates forecasts that account for underlying patterns such as trend or seasonality.  Lots of configuration is required that tends to inhibit user adoption and modification of the assumed forecasting rules defined in the initial implementation that may no longer be relevant.  There isn’t a way to easily compare the forecast accuracy of different configurations.  For example, is it better to use 24 months of history or 18 months?  Is it more accurate to assume a trend should be applied when an item grows by 2% per month or should it be 10%?  Is it better to assume the item is seasonal if 80% or more of it’s demand occurs in 6 months of the year or  4 months of the year? As a result, it is common for classification rules to be too broad or specific resulting in problems such as application of an incorrect forecasting model, using too much or too little history, or over/understating the trend and seasonality.   To learn more about how this works, check out this blog post (coming soon)

Forecast Management & Consensus Planning
P21 lacks forecast management features that enable organizations to plan at multiple hierarchy levels such as product family, region, or by customer.  Forecasts must be created at the lowest level of granularity (product by location) where demand is often too intermittent to get a good forecast.  There isn’t a way to share forecasts, collaborate, review, or create forecasts at aggregate levels, and agree on the consensus plan. It is difficult to incorporate business knowledge, assess forecasts at higher levels of aggregation, and track whether overrides are improving or hurting forecast accuracy. This makes forecasting too one-dimensional and dependent on the initial math configurations.  

Intermittent Demand
Many P21 customers rely on static methods (Min/Max and OP/OQ) because of the prevalence of intermittent demand.  Otherwise known as “lumpy”, intermittent demand is characterized by sporadic sales, large spikes in demand, and many periods with no demand at all. When demand is intermittent, traditional forecasting and safety stock methods just don’t work.  Since distributors don’t have the luxury of stocking only high movers with consistent demand, they need specialized solutions that are engineered to effectively plan intermittently demanded items. 80% or more of a distributor’s parts will have intermittent demand.  The stocking policies that are generated using traditional methods such as those available in P21 and other planning applications will result in incorrect estimates of what to stock to achieve the targeted service level.  As illustrated in the graph below, it isn’t possible to consistently forecast the spikes.  You are stuck with a forecast that is effectively an average of the prior periods.

Epicor Prophet 21 with Forecasting Inventory Management

Forecasts of intermittent demand can’t predict the spikes and require safety stock buffers to protect against stockouts.


Second, P21’s safety stock methods allow you to set a target service level but the underlying logic mistakenly assumes that the demand is normally distributed.  With intermittent demand, the demand isn’t “normal” and therefore the estimate of safety stock will be wrong.   Here is what wrong means: when setting a service level of, for example 98%, the expectation is that 98% of the time the stock on hand will fill 100% of what the customer needs from the shelf.  Using a normal distribution to compute safety stocks will result in large deviations between the targeted service level and actual service level achieved.  It is not uncommon to see situations where the actual service level misses the target by 10% or more (i.e., targeted 95% but only achieved 85%).


Epicor Prophet 21 with Forecasting Inventory Analytics

In this figure you can see the demand history of an intermittently demanded part and two distributions based on this demand history. The first distribution was generated using the same “normal distribution: logic employed by P21. The second is a simulated distribution based on Smart Software’s probabilistic forecasting. The “normal” P21 distribution recommends that 46 units is needed to achieve the 99% service level but when compared to actuals far more inventory was needed. Smart accurately predicted that 63 units was required to achieve the service level.

This blog explains how you can test your system’s service level accuracy.

Reliance on Spreadsheets & Reactive Planning
P21 customers tell us that they rely heavily on the use of spreadsheets to manage stocking policies and forecasting.  Spreadsheets aren’t purpose-built for forecasting and inventory optimization. Users will often bake in user-defined rule of thumb methods that often do more harm than good.  Once calculated, users must input the information back into P21 via manual file imports or even manual entry.  The time consuming nature of the process leads companies to infrequently compute their inventory policies – Many months and on occasion years go by in between mass updates leading to a “set it and forget it” reactive approach, where the only time a buyer/planner reviews inventory policy is at the time of order.  When policies are reviewed after the order point is already breached, it is too late.  When the order point is deemed too high, manual interrogation is required to review history, calculate forecasts, assess buffer positions, and to recalibrate.  The sheer volume of orders means that buyers will just release orders rather than take the painstaking time to review everything, leading to significant excess stock.  If the reorder point is too low, it’s already too late.  An expedite is now required driving up costs and even then, you’ll still lose sales if the customer goes elsewhere.

Limited What If Planning
Since features for modifying reorder points and order quantities are baked into P21 it is not possible to make wholesale changes across groups of items and assess predicted outcomes before deciding to commit.  This forces users to adopt a “wait and see” process when it comes to modifying parameters. Planners will make a change and then monitor actuals until they are confident the change improved things.  Managing this at scale—many planners are dealing with tens of thousands of items—is extremely time consuming and the end result is infrequent recalibration of inventory policy. This also contributes to reactive planning whereby planners will only review settings after a problem has occurred.

Epicor is Smarter
Epicor has partnered with Smart Software and offers Smart IP&O as a cross platform add-on to Prophet 21 complete with a bidirectional API-based integration.  This enables Epicor customers to leverage built-for-purpose best of breed forecasting and inventory optimization applications.  With Epicor Smart IP&O you can generate forecasts that capture trend and seasonality without having to first apply manual configurations.  You will be able to automatically recalibrate policies every planning cycle using field proven, cutting-edge statistical and probabilistic models that were engineered to accurately plan for intermittent demand.   Safety stocks will accurately account for demand and supply variability, business conditions, and priorities.  You can leverage service level driven planning so you have just enough stock or turn on optimization methods that prescribe the most profitable stocking policies and service levels that consider the real cost of carrying inventory. You can build consensus demand forecasts that blend business knowledge with statistics, better assess customer and sales forecasts, and confidently upload forecasts and stocking policies to Epicor with a few mouse-clicks.

Smart IP&O customers routinely realize 7 figure annual returns from reduced expedites, increased sales, and less excess stock, all the while gaining a competitive edge by differentiating themselves on improved customer service. To see a recorded webinar hosted by the Epicor Users Group that profiles Smart’s Demand Planning and Inventory Optimization platform, please register here: https://smartcorp.com/epicor-smart-inventory-planning-optimization/


Extend Epicor Kinetic’s Forecasting & Min/Max Planning with Smart IP&O

Extend Epicor Kinetic’s Forecasting & Min/Max Planning with Smart IP&O  
Epicor Kinetic can manage replenishment by suggesting what to order and when via reorder point-based inventory policies. Users can either manually specify these reorder points or use a daily average of demand to dynamically compute the policies.  If the policies aren’t correct then the automatic order suggestions will be inaccurate, and in turn the organization will end up with excess inventory, unnecessary shortages, and a general mistrust of their software systems.  In this article, we will review the inventory ordering functionality in Epicor Kinetic, explain its limitations, and summarize how Smart Inventory Planning & Optimization (Smart IP&O) can help reduce inventory, minimize stockouts and restore your organization’s trust in your ERP by providing the robust predictive functionality that is missing from ERP systems.

Epicor Kinetic (and Epicor ERP 10) Replenishment Policies
In the item maintenance screen of Epicor Kinetic, users can enter planning parameters for every stock item. These include Min On-Hand, Max On-Hand, Safety Stock lead times, and order modifiers such as supplier imposed minimum and maximum order quantities and order multiples.  Kinetic will reconcile incoming supply, current on hand, outgoing demand, stocking policies, and demand forecasts (that must be imported) to net out the supply plan.   Epicor’s time-phased replenishment inquiry details what is up for order and when while the Buyers Workbench enables users to assemble purchase orders.

Epicor’s Min/Max/Safety logic and forecasts that are entered into the “forecast entry” screen drives replenishment.  Here is how it works:

  • The reorder point is equal to Min + Safety. This means whenever on hand inventory drops below the reorder point an order suggestion will be created. If demand forecasts are imported via Epicor’s “forecast entry” screen the reorder point will account for the forecasted demand over the lead time and is equal to Min + Safety + Lead time forecast
  • If “reorder to Max” is selected, Epicor will generate an order quantity up to the Max. If not selected, Epicor will order the “Min Order Qty” if MOQ is less than the forecasted quantity over the time fence. Otherwise, it will order the forecasted demand over the time-period specified.  In the buyer’s workbench, the buyer can modify the actual order quantity if desired.


Limitations
Epicor’s Min/Max/Safety relies on an average of daily demand. It is easy to set up and understand.  It can also be effective when you don’t have lots of demand history. However, you’ll have to create forecasts and adjust for seasonality, trend, and other patterns externally.  Finally, multiples of averages also ignore the important role of demand or supply variability and this can result in misallocated stock as illustrated in the graphic below: 


Epicor same average demand and safety stock is determined

In this example, two equally important items have the same average demand (2,000 per month) and safety stock is determined by doubling the lead time demand resulting in a reorder point of 4,000. Because the multiple ignores the role of demand variability, Item A results in a significant overstock and Item B results in significant stockouts.

As designed, Min should hold expected demand over lead time and Safety should hold a buffer. However, these fields are often used very differently across items without a uniform policy; sometimes users even enter a Min and Safety Stock even though the item is being forecasted, effectively over estimating demand! This will generate order suggestions before it is needed, resulting in overstocks.  

Spreadsheet Planning
Many companies turn to spreadsheets when they face challenges setting policies in their ERP system.  These spreadsheets often rely on user defined rule of thumb methods that often do more harm than good.  Once calculated, they must input the information back into Epicor,  via manual file imports or even manual entry.  The time consuming nature of the process leads companies to infrequently compute their inventory policies – Many months of even years go by in between mass updates leading to a “set it and forget it” reactive approach, where the only time a buyer/planner reviews inventory policy is at the time of order.  When policies are reviewed after the order point is already breached it is too late.  When the order point is deemed too high, manual interrogation is required to review history, calculate forecasts, assess buffer positions, and to recalibrate.  The sheer volume of orders means that buyers will just release orders rather than take the painstaking time to review everything leading to significant excess stock.  If the reorder point is too low, it’s already too late.  An expedite is now required driving up costs and even then you’ll still lose sales if the customer goes elsewhere.

Epicor is Smarter
Epicor has partnered with Smart Software and offers Smart IP&O as a cross platform add-on to Epicor Kinetic and Prophet 21 with API based integrations.  This enables Epicor customers to leverage built for purpose best of breed forecasting and inventory optimization applications.  With Epicor Smart IP&O you can automatically recalibrate policies every planning cycle using field proven, cutting-edge statistical and probabilistic models.  You can calculate demand forecasts that account for seasonality, trend, and cyclical patterns.  Safety stocks will account for demand and supply variability, business conditions, and priorities.  You can leverage service level driven planning so you have just enough stock or turn on optimization methods that prescribe the most profitable stocking policies and service levels that consider the real cost of carrying inventory. You can build consensus demand forecasts that blend business knowledge with statistics, better assess customer and sales forecasts, and confidently upload forecasts and stocking policies to Epicor within a few mouse-clicks.

Smart IP&O customers routinely realize 7 figure annual returns from reduced expedites, increased sales, and less excess stock, all the while gaining a competitive edge by differentiating themselves on improved customer service. To see a recorded webinar hosted by the Epicor Users Group that profiles Smart’s Demand Planning and Inventory Optimization platform, please register here: https://smartcorp.com/epicor-smart-inventory-planning-optimization/


What is the difference between Demand planning and Inventory optimization ?

The Smart Forecaster

Pursuing best practices in demand planning,

forecasting and inventory optimization

What is the difference between Demand planning and Inventory optimization ? 

The Smart Demand Planning app (SDP) provides demand forecasts. The SDP forecasting engine is also the core of the Smart Inventory Optimization app (SIO), which stress-tests various inventory policies using a number of demand scenarios to find optimal inventory policy settings.


Leave a Comment

Related Posts

Leveraging ERP Planning BOMs with Smart IP&O to Forecast the Unforecastable

Leveraging ERP Planning BOMs with Smart IP&O to Forecast the Unforecastable

In a highly configurable manufacturing environment, forecasting finished goods can become a complex and daunting task. The number of possible finished products will skyrocket when many components are interchangeable. A traditional MRP would force us to forecast every single finished product which can be unrealistic or even impossible. Several leading ERP solutions introduce the concept of the “Planning BOM”, which allows the use of forecasts at a higher level in the manufacturing process. In this article, we will discuss this functionality in ERP, and how you can take advantage of it with Smart Inventory Planning and Optimization (Smart IP&O) to get ahead of your demand in the face of this complexity.

Why Inventory Planning Shouldn’t Rely Exclusively on Simple Rules of Thumb

Why Inventory Planning Shouldn’t Rely Exclusively on Simple Rules of Thumb

For too many companies, a critical piece of data fact-finding ― the measurement of demand uncertainty ― is handled by simple but inaccurate rules of thumb. For example, demand planners will often compute safety stock by a user-defined multiple of the forecast or historical average. Or they may configure their ERP to order more when on hand inventory gets to 2 x the average demand over the lead time for important items and 1.5 x for less important ones. This is a huge mistake with costly consequences.

Why MRO Businesses Should Care About Excess Inventory

Why MRO Businesses Should Care About Excess Inventory

Do MRO companies genuinely prioritize reducing excess spare parts inventory? From an organizational standpoint, our experience suggests not necessarily. Boardroom discussions typically revolve around expanding fleets, acquiring new customers, meeting service level agreements (SLAs), modernizing infrastructure, and maximizing uptime. In industries where assets supported by spare parts cost hundreds of millions or generate significant revenue (e.g., mining or oil & gas), the value of the inventory just doesn’t raise any eyebrows, and organizations tend to overlook massive amounts of excessive inventory.

Recent Posts

  • Daily Demand Scenarios Smart 2Daily Demand Scenarios
    In this Videoblog, we will explain how time series forecasting has emerged as a pivotal tool, particularly at the daily level, which Smart Software has been pioneering since its inception over forty years ago. The evolution of business practices from annual to more refined temporal increments like monthly and now daily data analysis illustrates a significant shift in operational strategies. […]
  • The Cost of Doing nothing with your inventory Planning SystemsThe Cost of Spreadsheet Planning
    Companies that depend on spreadsheets for demand planning, forecasting, and inventory management are often constrained by the spreadsheet’s inherent limitations. This post examines the drawbacks of traditional inventory management approaches caused by spreadsheets and their associated costs, contrasting these with the significant benefits gained from embracing state-of-the-art planning technologies. […]
  • Learning from Inventory Models Software AILearning from Inventory Models
    In this video blog, the spotlight is on a critical aspect of inventory management: the analysis and interpretation of inventory data. The focus is specifically on a dataset from a public transit agency detailing spare parts for buses. […]
  • The methods of forecasting SoftwareThe Methods of Forecasting
    Demand planning and statistical forecasting software play a pivotal role in effective business management by incorporating features that significantly enhance forecasting accuracy. One key aspect involves the utilization of smoothing-based or extrapolative models, enabling businesses to quickly make predictions based solely on historical data. This foundation rooted in past performance is crucial for understanding trends and patterns, especially in variables like sales or product demand. Forecasting software goes beyond mere data analysis by allowing the blending of professional judgment with statistical forecasts, recognizing that forecasting is not a one-size-fits-all process. This flexibility enables businesses to incorporate human insights and industry knowledge into the forecasting model, ensuring a more nuanced and accurate prediction. […]
  • Epicor AI Forecasting and Inventory Technology Combined with Planner Knowledge for InsightsSmart Software to Present at Epicor Insights 2024
    Smart Software will present at this year's Epicor Insights event in Nashville. If you plan to attend this year, please join us at booth #13 or #501, and learn more about Epicor Smart Inventory Planning and Optimization. . […]

    Inventory Optimization for Manufacturers, Distributors, and MRO

    • Why MRO Businesses Need Add-on Service Parts Planning & Inventory SoftwareWhy MRO Businesses Need Add-on Service Parts Planning & Inventory Software
      MRO organizations exist in a wide range of industries, including public transit, electrical utilities, wastewater, hydro power, aviation, and mining. To get their work done, MRO professionals use Enterprise Asset Management (EAM) and Enterprise Resource Planning (ERP) systems. These systems are designed to do a lot of jobs. Given their features, cost, and extensive implementation requirements, there is an assumption that EAM and ERP systems can do it all. In this post, we summarize the need for add-on software that addresses specialized analytics for inventory optimization, forecasting, and service parts planning. […]
    • Spare-parts-demand-forecasting-a-different-perspective-for-planning-service-partsThe Forecast Matters, but Maybe Not the Way You Think
      True or false: The forecast doesn't matter to spare parts inventory management. At first glance, this statement seems obviously false. After all, forecasts are crucial for planning stock levels, right? It depends on what you mean by a “forecast”. If you mean an old-school single-number forecast (“demand for item CX218b will be 3 units next week and 6 units the week after”), then no. If you broaden the meaning of forecast to include a probability distribution taking account of uncertainties in both demand and supply, then yes. […]
    • Whyt MRO Businesses Should Care about Excess InventoryWhy MRO Businesses Should Care About Excess Inventory
      Do MRO companies genuinely prioritize reducing excess spare parts inventory? From an organizational standpoint, our experience suggests not necessarily. Boardroom discussions typically revolve around expanding fleets, acquiring new customers, meeting service level agreements (SLAs), modernizing infrastructure, and maximizing uptime. In industries where assets supported by spare parts cost hundreds of millions or generate significant revenue (e.g., mining or oil & gas), the value of the inventory just doesn’t raise any eyebrows, and organizations tend to overlook massive amounts of excessive inventory. […]
    • Top Differences between Inventory Planning for Finished Goods and for MRO and Spare PartsTop Differences Between Inventory Planning for Finished Goods and for MRO and Spare Parts
      In today’s competitive business landscape, companies are constantly seeking ways to improve their operational efficiency and drive increased revenue. Optimizing service parts management is an often-overlooked aspect that can have a significant financial impact. Companies can improve overall efficiency and generate significant financial returns by effectively managing spare parts inventory. This article will explore the economic implications of optimized service parts management and how investing in Inventory Optimization and Demand Planning Software can provide a competitive advantage. […]

      Automatic Forecasting for Time Series Demand Projections

      The Smart Forecaster

       Pursuing best practices in demand planning,

      forecasting and inventory optimization

      Improve Forecast Accuracy, Eliminate Excess Inventory, & Maximize Service Levels

      In this video tutorial Dr. Thomas Willemain, co–Founder and SVP Research at Smart Software, presents Automatic Forecasting for Time Series Demand Projections, a specialized algorithmic tournament to determine an appropriate time series model and estimate the parameters to compute the best forecasts methods. Automatic forecasts of large numbers of time series are frequently used in business, some have trend either up or down, and some have seasonality so they are cyclic, and each of those specific patterns requires a suitable technical approach, and an appropriate statistical forecasting method.  Tom explains how the tournament computes the best forecasts methods and works through a practical example.

      AUTOMATIC FORECASTING COMPLETE-VIDEO-2
      Leave a Comment

      RECENT POSTS

      Leveraging ERP Planning BOMs with Smart IP&O to Forecast the Unforecastable

      Leveraging ERP Planning BOMs with Smart IP&O to Forecast the Unforecastable

      In a highly configurable manufacturing environment, forecasting finished goods can become a complex and daunting task. The number of possible finished products will skyrocket when many components are interchangeable. A traditional MRP would force us to forecast every single finished product which can be unrealistic or even impossible. Several leading ERP solutions introduce the concept of the “Planning BOM”, which allows the use of forecasts at a higher level in the manufacturing process. In this article, we will discuss this functionality in ERP, and how you can take advantage of it with Smart Inventory Planning and Optimization (Smart IP&O) to get ahead of your demand in the face of this complexity.

      Why Inventory Planning Shouldn’t Rely Exclusively on Simple Rules of Thumb

      Why Inventory Planning Shouldn’t Rely Exclusively on Simple Rules of Thumb

      For too many companies, a critical piece of data fact-finding ― the measurement of demand uncertainty ― is handled by simple but inaccurate rules of thumb. For example, demand planners will often compute safety stock by a user-defined multiple of the forecast or historical average. Or they may configure their ERP to order more when on hand inventory gets to 2 x the average demand over the lead time for important items and 1.5 x for less important ones. This is a huge mistake with costly consequences.

      Why MRO Businesses Should Care About Excess Inventory

      Why MRO Businesses Should Care About Excess Inventory

      Do MRO companies genuinely prioritize reducing excess spare parts inventory? From an organizational standpoint, our experience suggests not necessarily. Boardroom discussions typically revolve around expanding fleets, acquiring new customers, meeting service level agreements (SLAs), modernizing infrastructure, and maximizing uptime. In industries where assets supported by spare parts cost hundreds of millions or generate significant revenue (e.g., mining or oil & gas), the value of the inventory just doesn’t raise any eyebrows, and organizations tend to overlook massive amounts of excessive inventory.

      Recent Posts

      • Daily Demand Scenarios Smart 2Daily Demand Scenarios
        In this Videoblog, we will explain how time series forecasting has emerged as a pivotal tool, particularly at the daily level, which Smart Software has been pioneering since its inception over forty years ago. The evolution of business practices from annual to more refined temporal increments like monthly and now daily data analysis illustrates a significant shift in operational strategies. […]
      • The Cost of Doing nothing with your inventory Planning SystemsThe Cost of Spreadsheet Planning
        Companies that depend on spreadsheets for demand planning, forecasting, and inventory management are often constrained by the spreadsheet’s inherent limitations. This post examines the drawbacks of traditional inventory management approaches caused by spreadsheets and their associated costs, contrasting these with the significant benefits gained from embracing state-of-the-art planning technologies. […]
      • Learning from Inventory Models Software AILearning from Inventory Models
        In this video blog, the spotlight is on a critical aspect of inventory management: the analysis and interpretation of inventory data. The focus is specifically on a dataset from a public transit agency detailing spare parts for buses. […]
      • The methods of forecasting SoftwareThe Methods of Forecasting
        Demand planning and statistical forecasting software play a pivotal role in effective business management by incorporating features that significantly enhance forecasting accuracy. One key aspect involves the utilization of smoothing-based or extrapolative models, enabling businesses to quickly make predictions based solely on historical data. This foundation rooted in past performance is crucial for understanding trends and patterns, especially in variables like sales or product demand. Forecasting software goes beyond mere data analysis by allowing the blending of professional judgment with statistical forecasts, recognizing that forecasting is not a one-size-fits-all process. This flexibility enables businesses to incorporate human insights and industry knowledge into the forecasting model, ensuring a more nuanced and accurate prediction. […]
      • Epicor AI Forecasting and Inventory Technology Combined with Planner Knowledge for InsightsSmart Software to Present at Epicor Insights 2024
        Smart Software will present at this year's Epicor Insights event in Nashville. If you plan to attend this year, please join us at booth #13 or #501, and learn more about Epicor Smart Inventory Planning and Optimization. . […]

        Inventory Optimization for Manufacturers, Distributors, and MRO

        • Why MRO Businesses Need Add-on Service Parts Planning & Inventory SoftwareWhy MRO Businesses Need Add-on Service Parts Planning & Inventory Software
          MRO organizations exist in a wide range of industries, including public transit, electrical utilities, wastewater, hydro power, aviation, and mining. To get their work done, MRO professionals use Enterprise Asset Management (EAM) and Enterprise Resource Planning (ERP) systems. These systems are designed to do a lot of jobs. Given their features, cost, and extensive implementation requirements, there is an assumption that EAM and ERP systems can do it all. In this post, we summarize the need for add-on software that addresses specialized analytics for inventory optimization, forecasting, and service parts planning. […]
        • Spare-parts-demand-forecasting-a-different-perspective-for-planning-service-partsThe Forecast Matters, but Maybe Not the Way You Think
          True or false: The forecast doesn't matter to spare parts inventory management. At first glance, this statement seems obviously false. After all, forecasts are crucial for planning stock levels, right? It depends on what you mean by a “forecast”. If you mean an old-school single-number forecast (“demand for item CX218b will be 3 units next week and 6 units the week after”), then no. If you broaden the meaning of forecast to include a probability distribution taking account of uncertainties in both demand and supply, then yes. […]
        • Whyt MRO Businesses Should Care about Excess InventoryWhy MRO Businesses Should Care About Excess Inventory
          Do MRO companies genuinely prioritize reducing excess spare parts inventory? From an organizational standpoint, our experience suggests not necessarily. Boardroom discussions typically revolve around expanding fleets, acquiring new customers, meeting service level agreements (SLAs), modernizing infrastructure, and maximizing uptime. In industries where assets supported by spare parts cost hundreds of millions or generate significant revenue (e.g., mining or oil & gas), the value of the inventory just doesn’t raise any eyebrows, and organizations tend to overlook massive amounts of excessive inventory. […]
        • Top Differences between Inventory Planning for Finished Goods and for MRO and Spare PartsTop Differences Between Inventory Planning for Finished Goods and for MRO and Spare Parts
          In today’s competitive business landscape, companies are constantly seeking ways to improve their operational efficiency and drive increased revenue. Optimizing service parts management is an often-overlooked aspect that can have a significant financial impact. Companies can improve overall efficiency and generate significant financial returns by effectively managing spare parts inventory. This article will explore the economic implications of optimized service parts management and how investing in Inventory Optimization and Demand Planning Software can provide a competitive advantage. […]