
What’s different about inventory planning for Maintenance, Repair, and Operations (MRO) compared to inventory planning in manufacturing and distribution environments? In short, it’s the nature of the demand patterns combined with the lack of actionable business knowledge.
Demand Patterns
Manufacturers and distributors tend to focus on the top sellers that generate the majority of their revenue. These items typically have high demand that is relatively easy to forecast with traditional time series models that capitalize on predictable trend and/or seasonality. In contrast, MRO planners almost always deal with intermittent demand, which is more sparse, more random, and harder to forecast. Furthermore, the fundamental quantities of interest are different. MRO planners ultimately care most about the “when” question: When will something break? Whereas the others focus on the “how much” question of units sold.
Business Knowledge
Manufacturing and distribution planners can often count on gathering customer and sales feedback, which can be combined with statistical methods to improve forecast accuracy. On the other hand, bearings, gears, consumable parts, and repairable parts are rarely willing to share their opinions. With MRO, business knowledge about which parts will be needed and when just isn’t reliable (excepting planned maintenance when higher-volume consumable parts are replaced). So, MRO inventory planning success goes only as far as their probability models’ ability to predict future usage takes them. And since demand is so intermittent, they can’t get past Go with traditional approaches.
Methods for MRO
In practice, it is common for MRO and asset-intensive businesses to manage inventories by resorting to static Min/Max levels based on subjective multiples of average usage, supplemented by occasional manual overrides based on gut feel. The process becomes a bad mixture of static and reactive, with the result that a lot of time and money is wasted on expediting.
There are alternative planning methods based more on math and data, though this style of planning is less common in MRO than in the other domains. There are two leading approaches to modeling part and machine breakdown: models based on reliability theory and “condition-based maintenance” models based on real-time monitoring.
Reliability Models
Reliability models are the simpler of the two and require less data. They assume that all items of the same type, say a certain spare part, are statistically equivalent. Their key component is a “hazard function”, which describes the risk of failure in the next little interval of time. The hazard function can be translated into something better suited for decision making: the “survival function”, which is the probability that the item is still working after X amount of use (where X might be expressed in days, months, miles, uses, etc.). Figure 1 shows a constant hazard function and its corresponding survival function.
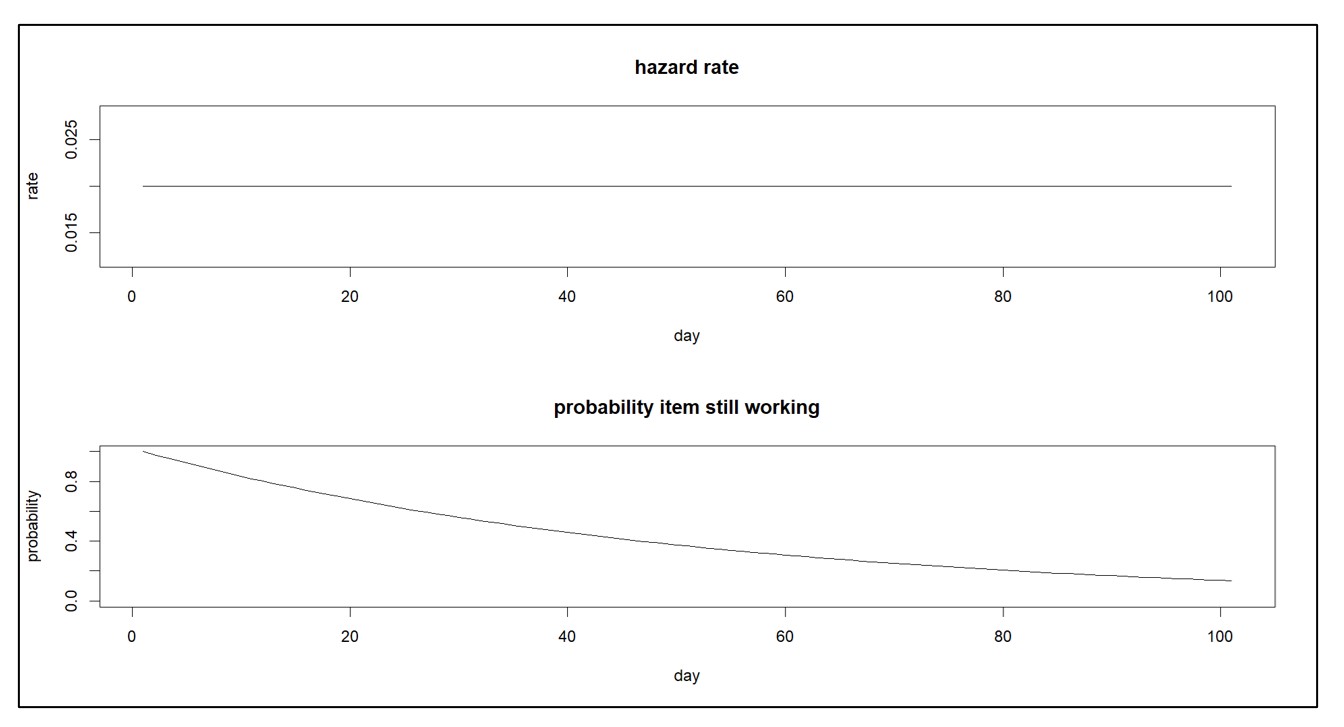
Figure 1: Constant hazard function and its survival function
A hazard function that doesn’t change implies that only random accidents will cause a failure. In contrast, a hazard function that increases over time implies that the item is wearing out. And a decreasing hazard function implies that an item is settling in. Figure 2 shows an increasing hazard function and its corresponding survival function.
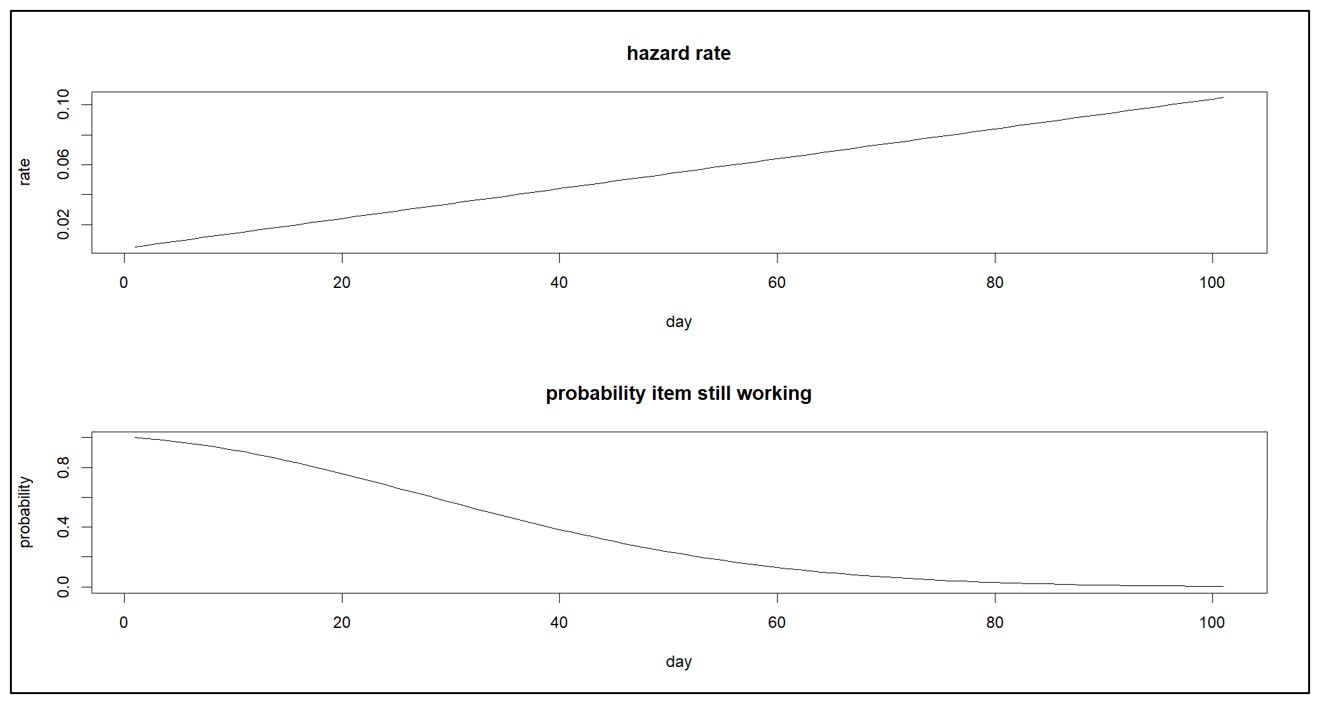
Figure 2: Increasing hazard function and its survival function
Reliability models are often used for inexpensive parts, such as mechanical fasteners, whose replacement may be neither difficult nor expensive (but still might be essential).
Condition-Based Maintenance
Models based on real-time monitoring are used to support condition-based maintenance (CBM) for expensive items like jet engines. These models use data from sensors embedded in the items themselves. Such data are usually complex and proprietary, as are the probability models supported by the data. The payoff from real-time monitoring is that you can see trouble coming, i.e., the deterioration is made visible, and forecasts can predict when the item will hit its red line and therefore need to be taken off the field of play. This allows individualized, pro-active maintenance or replacement of the item.
Figure 3 illustrates the kind of data used in CBM. Each time the system is used, there is a contribution to its cumulative wear and tear. (However, note that sometimes use can improve the condition of the unit, as when rain helps keep a piece of machinery cool). You can see the general trend upward toward a red line after which the unit will require maintenance. You can extrapolate the cumulative wear to estimate when it will hit the red line and plan accordingly.
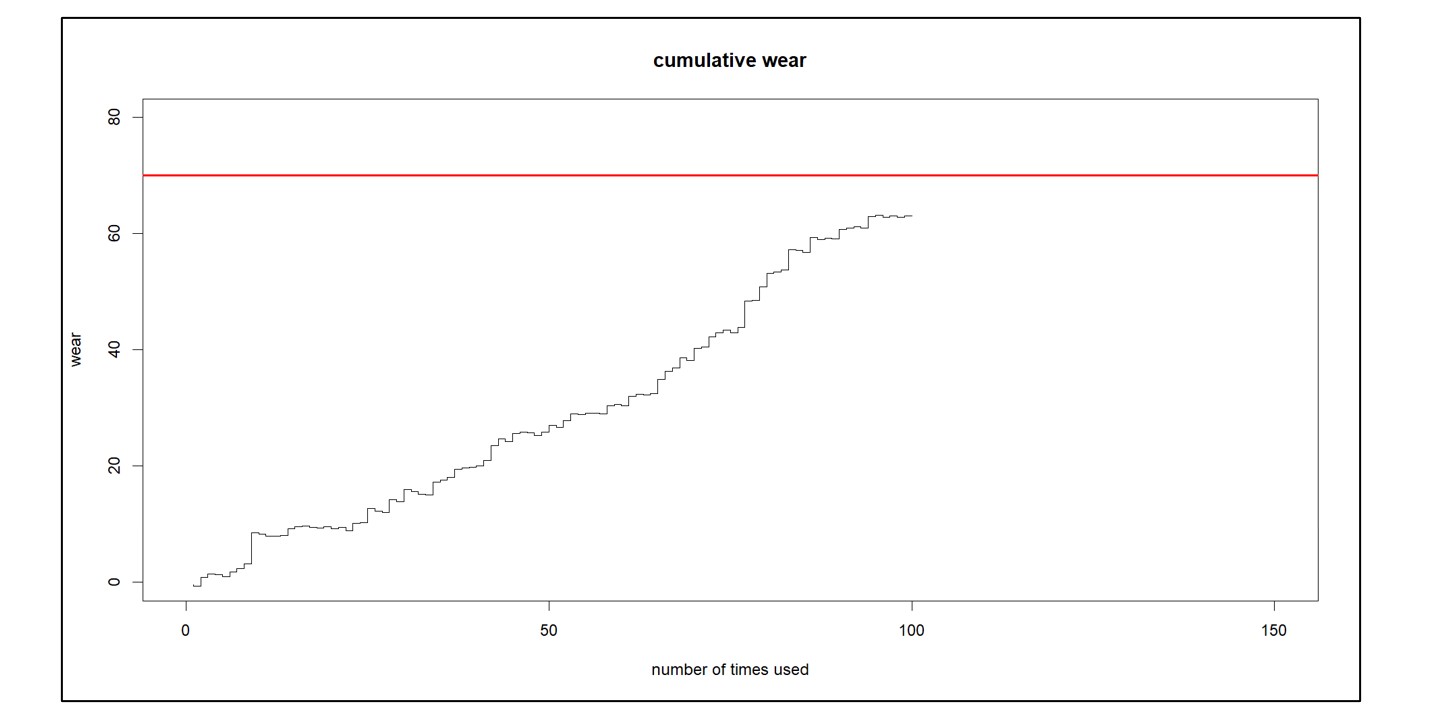
Figure 3: Illustrating real-time monitoring for condition-based maintenance
To my knowledge, nobody makes such models of their finished goods customers to predict when and how much they will next order, perhaps because the customers would object to wearing brain monitors all the time. But CBM, with its complex monitoring and modeling, is gaining in popularity for can’t-fail systems like jet engines. Meanwhile, classical reliability models still have a lot of value for managing large fleets of cheaper but still essential items.
Smart’s approach
The above condition-based maintenance and reliability approaches require an excessive data collection and cleansing burden that many MRO companies are unable to manage. For those companies, Smart offers an approach that does not require development of reliability models. Instead, it exploits usage data in a different way. It leverages probability-based models of both usage and supplier lead times to simulate thousands of possible scenarios for replenishment lead times and demand. The result is an accurate distribution of demand and lead times for each consumable part that can be exploited to determine optimal stocking parameters. Figure 4 shows a simulation that begins with a scenario for spare part demand (upper plot) then produces a scenario of on-hand supply for particular choices of Min/Max values (lower line). Key Performance Indicators (KPIs) can be estimated by averaging the results of many such simulations.

Figure 4: An example of a simulation of spare part demand and on-hand inventory
You can read about Smart’s approach to forecasting spare parts here: https://smartcorp.com/wp-content/uploads/2019/10/Probabilistic-Forecasting-for-Intermittent-Demand.pdf
Spare Parts Planning Software solutions
Smart IP&O’s service parts forecasting software uses a unique empirical probabilistic forecasting approach that is engineered for intermittent demand. For consumable spare parts, our patented and APICS award winning method rapidly generates tens of thousands of demand scenarios without relying on the assumptions about the nature of demand distributions implicit in traditional forecasting methods. The result is highly accurate estimates of safety stock, reorder points, and service levels, which leads to higher service levels and lower inventory costs. For repairable spare parts, Smart’s Repair and Return Module accurately simulates the processes of part breakdown and repair. It predicts downtime, service levels, and inventory costs associated with the current rotating spare parts pool. Planners will know how many spares to stock to achieve short- and long-term service level requirements and, in operational settings, whether to wait for repairs to be completed and returned to service or to purchase additional service spares from suppliers, avoiding unnecessary buying and equipment downtime.
Contact us to learn more how this functionality has helped our customers in the MRO, Field Service, Utility, Mining, and Public Transportation sectors to optimize their inventory. You can also download the Whitepaper here.
White Paper: What you Need to know about Forecasting and Planning Service Parts
This paper describes Smart Software’s patented methodology for forecasting demand, safety stocks, and reorder points on items such as service parts and components with intermittent demand, and provides several examples of customer success.