
To test software solutions via a series of empirical competition can be a considerable option. For forecasting / demand planning, a traditional “hold out” test in which 2014-2018 data are provided to software vendors and 2019 is held out for later comparison against forecasts provided by competing vendors. The company then measures forecast error and bias. This approach is advocated nearly universally for assessing forecast accuracy. It’s a good way to assess monthly or weekly forecast accuracy, but it is minimally useful if you have a different objective: Optimizing inventory.
In our last blog, we discussed how to pick a targeted service level. We indicated that just because you set a target (or a system recommends a target) doesn’t mean you’ll actually achieve the target. The right way to measure accuracy if you are interested in optimizing stock levels is to focus on the accuracy of the service level projection. This will account for both lead time demand and safety stock.
Setting a target service level is a strategic decision about inventory risk management. Inventory software does the tactical work by computing reorder points (a.k.a. mins) meant to achieve a user-defined target or that will achieve a system-calculated optimal target. But if the software uses the wrong demand model, the achieved service level will miss the target, sometimes significantly. The result of this error will be either shortages or inventory bloat, depending on the direction of the miss.
 Forecasting is a means to an end. The end is to optimize inventory levels. Because demand is uncertain, companies that need to provide even moderate service levels must stock more than the forecast, often much more. But doesn’t low forecast error mean lower safety stock? The better my forecasts, the lower my inventory? Yes, true. But what matters when determining the required inventory are both accurate forecasts of the most likely demand and accurate estimates of the variability around the most likely demand.
Especially with long tailed, intermittent demand, traditional forecast accuracy assessments over a conventional 12 month forecast horizon miss the point three ways.
– First, the relevant time scale for inventory optimization is the replenishment lead time, which is usually much shorter than 12 months. Demand during lead times measured in days or weeks has volatility that gets averaged out over long forecast horizons. This is bad because factoring in the effect of volatility is essential to calculation of optimal reorder points.
– Second, forecast accuracy assessed over a multi-month forecast horizon focuses on the typical error in a typical month within the horizon. In contrast, inventory optimization requires a focus on cumulative demand, not period-by-period demand.
– Third, and most important is that forecast error metrics are focused on the middle of the demand distribution, aiming to estimate the most likely demand. But setting reorder points involves estimating high percentiles of the cumulative demand distribution over a lead time. Estimating the middle a bit better but having no clue about, say, the 95th percentile, is not helpful.
Consider this hypothetical example. If Vendor A forecasts 20 units with 110% error and Vendor B forecasts 22 units with 105% error, then Vendor B has an advantage in the forecasting game. But if you want a high service level and the demand is intermittent, you’ll have to stock a lot more than 20 or 22 units. Let’s assume you select Vendor B’s technology to plan stocking levels. You then notice that when planning reorder points to achieve a 95% service level, you often fall short – way more often that the expected 5% of the time. You come to realize that Vendor B’s approach completely underestimates the safety stock required to achieve the target service target. Focusing on vendors’ forecast error isn’t going to help. You will come to wish that you had verified Vendor A and B’s service level accuracy. Now you are stuck arbitrarily adjusting Vendor B’s service level targets to compensate for the shortfall.
So what’s needed in vendor competitions is assessment of their systems’ abilities to accurately forecast the inventory required to meet a given service level over an item’s replenishment lead time. Narrowly focusing on measuring forecast error is not appropriate if the mission is managing inventory. This is especially true for long tail items with intermittent demand or items that have medium to high volume but don’t have a demand distribution that looks like the classic “bell shaped curve” (Normal distribution).
The remainder of this blog explains how to test the accuracy of software’s service level calculations, so you can monitor the risk of missing your service level targets. We recommend this accuracy test over traditional “forecast versus actuals” tests because it provides much more insight into how reorder point recommendations will influence inventory levels and customer service.

Office staff are analyzing The Right Forecast Accuracy Metric for Inventory Planning
Service Level Defined
Consider a single inventory item. When inventory drops to or below the reorder point, a replenishment order is generated. This starts a period of risk that lasts as long as the replenishment lead time. During the period of risk, there might be enough incoming demands to create backorders or lost sales. The service level is the probability that there are no backorders or stockouts during the replenishment lead time. Critical items might be given very high target service levels, say 99%, whereas other items might have more relaxed targets, such as 75%. Whatever the target service level, it is best to hit that target.
Calculating Service Level
The service level for an individual item can only be estimated by repeated comparison of observed lead time demand against the calculated reorder point. These estimates take a lot of time: at least dozens of lead times. But fleet-wise service level can be estimated using data compiled over a single lead time.
Let’s do an example. Suppose you have demand histories for 1,000 items over 365 days and that (for simplicity) all items have 45-day lead times. For each item, follow these steps to estimate the fleet-wise achieved service level:
Step 1: Step aside (“hold out”) the most recent 45 days of demand (or however many days is closest to your typical lead times). Compute their sum, which is the most recent value of the actual lead time demand. This is the ground truth to be used to estimate the achieved service level.
Step 2: Use the prior 320 days of demand history to forecast the required inventory to hit a range of service level targets, say 90%, 95%, 97%, and 99%.
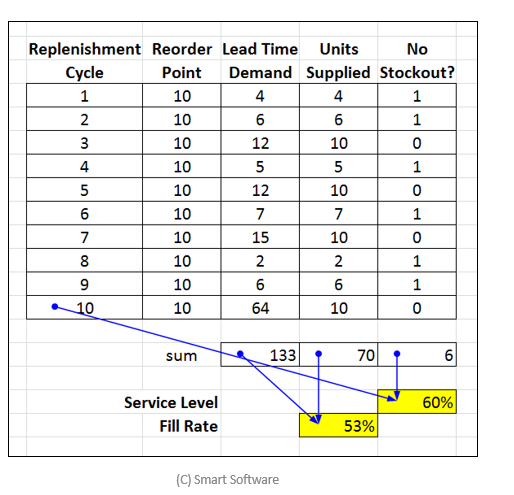
Step 3: Check whether the observed lead time demand is less than or equal to the reorder point. If it is, count this as a win; otherwise, count it as a loss. For instance, if the reorder point is 15 units but the most recent lead time demand is 10 units, then this is a win, since the reorder point is high enough to cover a lead time demand of 10 without any shortage. However, if the most recent lead time demand is 18 units, there would be a stockout, and 3 units would either be backordered or counted as lost sales.
Step 4: Working across all items, and all service level targets, tally the percentage of tests for each service level target that resulted in a win. This is the achieved service level. If the target was 90% and 853 of the 1,000 units record a win, then the achieved service level is 85.3%.
Example
Consider a real-world example. The data are daily demand histories of 590 medical supply items used in an internationally famous clinic. For simplicity, we assume each item has a lead time of 45 days. We evaluate target service levels of 70%, 90%, 95% and 99%.
We compare two demand models. The “Normal” model assumes that daily demand has a Normal (“bell-shaped”) distribution. This is the classic assumption used in most introductory textbooks on inventory control and in many software products. Classic though it may be, it is often an inappropriate model of demand for spare parts or supplies. The “Probability Forecast” model takes explicit account of the intermittent nature of demand.
Exhibit 1 shows the results. Column J shows the actual demand over the final 45 observations. The computed reorder points for the Advanced Model are shown in columns L-O. The computed reorder points for the Normal model are not displayed. Columns Q-T and V-Y hold the results of the tests for whether the reorder points were high enough to handle the lead time demands in column J.

The final results (yellow cells) show a clear difference between the Normal and Probability (Advanced) demand models. Both did a good job of hitting the 70% service level target, but estimating higher service levels is a more delicate calculation, and the Probability model does a much better job. For instance, the Normal model’s supposed 99% service level turned out to be only 94.4%, while the Probability model hit the target with a 98.5% achieved service level.
Implications
Utilizing the more accurate method achieved the targeted service level, while the less accurate method did not. If the less accurate method is used then real and costly business decisions will be made on the false assumption that a higher service level will be achieved. For example, if a Service Level Agreement (SLA) is based on these results and a 99% service level is committed to, the supplier would actually be five times more likely to stock out than planned (service level promised = 99% or 1% stockout risk vs. service level achieved = 94.5% or 5.5% stock out risk)! This means financial penalties will be incurred five times more often than expected.
Suppose that planners knew the target service level would not be met but were stuck using an inaccurate model. They would still need a way to increase inventory and achieve the desired level of service. What might they choose to do? We have observed situations where the planner enters a higher service level target than needed in order to “trick” the system into delivering the required service level. In the above example, the Normal model needed to have a 99.99% service level entered before it could achieve a target service level of 99%. This change resulted in achieving a 99% service but more than doubled the inventory investment when compared to the Advanced model.
Implementing a Service Level Accuracy Test
At Smart Software, we’ve encouraged many of our customers to conduct the test of service level accuracy as a way for them to assess our and other vendors’ claims during the software selection process. Missing the service level target has extremely costly implications resulting in substantial over stocks or under stocks. So, test service level accuracy before deploying a solution to identify situations when the modeling fails. Don’t assume that you will achieve the service level you decide to target (or that the system recommends). To request an Excel spreadsheet that serves as a template for a service level accuracy test, email your contact information to info@smartcorp.com and enter “Accuracy Template” in the subject line.

Related Posts

Forecast-Based Inventory Management for Better Planning
Forecast-based inventory management, or MRP (Material Requirements Planning) logic, is a forward-planning method that helps businesses meet demand without overstocking or understocking. By anticipating demand and adjusting inventory levels, it maintains a balance between meeting customer needs and minimizing excess inventory costs. This approach optimizes operations, reduces waste, and enhances customer satisfaction.

Make AI-Driven Inventory Optimization an Ally for Your Organization
In this blog, we will explore how organizations can achieve exceptional efficiency and accuracy with AI-driven inventory optimization. Traditional inventory management methods often fall short due to their reactive nature and reliance on manual processes. Maintaining optimal inventory levels is fundamental for meeting customer demand while minimizing costs. The introduction of AI-driven inventory optimization can significantly reduce the burden of manual processes, providing relief to supply chain managers from tedious tasks.

The Importance of Clear Service Level Definitions in Inventory Management
Inventory optimization software that supports what-if analysis will expose the tradeoff of stockouts vs. excess costs of varying service level targets. But first it is important to identify how “service levels” is interpreted, measured, and reported. This will avoid miscommunication and the false sense of security that can develop when less stringent definitions are used. Clearly defining how service level is calculated puts all stakeholders on the same page. This facilitates better decision-making.
Recent Posts
 Forecast-Based Inventory Management for Better PlanningForecast-based inventory management, or MRP (Material Requirements Planning) logic, is a forward-planning method that helps businesses meet demand without overstocking or understocking. By anticipating demand and adjusting inventory levels, it maintains a balance between meeting customer needs and minimizing excess inventory costs. This approach optimizes operations, reduces waste, and enhances customer satisfaction. […]
 Make AI-Driven Inventory Optimization an Ally for Your OrganizationIn this blog, we will explore how organizations can achieve exceptional efficiency and accuracy with AI-driven inventory optimization. Traditional inventory management methods often fall short due to their reactive nature and reliance on manual processes. Maintaining optimal inventory levels is fundamental for meeting customer demand while minimizing costs. The introduction of AI-driven inventory optimization can significantly reduce the burden of manual processes, providing relief to supply chain managers from tedious tasks. […]
 The Importance of Clear Service Level Definitions in Inventory ManagementInventory optimization software that supports what-if analysis will expose the tradeoff of stockouts vs. excess costs of varying service level targets. But first it is important to identify how “service levels” is interpreted, measured, and reported. This will avoid miscommunication and the false sense of security that can develop when less stringent definitions are used. Clearly defining how service level is calculated puts all stakeholders on the same page. This facilitates better decision-making. […]
 Future-Proofing Utilities: Advanced Analytics for Supply Chain OptimizationUtilities in the electrical, natural gas, urban water, and telecommunications fields are all asset-intensive and reliant on physical infrastructure that must be properly maintained, updated, and upgraded over time. Maximizing asset uptime and the reliability of physical infrastructure demands effective inventory management, spare parts forecasting, and supplier management. A utility that executes these processes effectively will outperform its peers, provide better returns for its investors and higher service levels for its customers, while reducing its environmental impact. […]
 The Cost of Spreadsheet PlanningCompanies that depend on spreadsheets for demand planning, forecasting, and inventory management are often constrained by the spreadsheet’s inherent limitations. This post examines the drawbacks of traditional inventory management approaches caused by spreadsheets and their associated costs, contrasting these with the significant benefits gained from embracing state-of-the-art planning technologies. […]

Inventory Optimization for Manufacturers, Distributors, and MRO
- Future-Proofing Utilities: Advanced Analytics for Supply Chain OptimizationUtilities in the electrical, natural gas, urban water, and telecommunications fields are all asset-intensive and reliant on physical infrastructure that must be properly maintained, updated, and upgraded over time. Maximizing asset uptime and the reliability of physical infrastructure demands effective inventory management, spare parts forecasting, and supplier management. A utility that executes these processes effectively will outperform its peers, provide better returns for its investors and higher service levels for its customers, while reducing its environmental impact. […]
 Centering Act: Spare Parts Timing, Pricing, and ReliabilityIn this article, we'll walk you through the process of crafting a spare parts inventory plan that prioritizes availability metrics such as service levels and fill rates while ensuring cost efficiency. We'll focus on an approach to inventory planning called Service Level-Driven Inventory Optimization. Next, we'll discuss how to determine what parts you should include in your inventory and those that might not be necessary. Lastly, we'll explore ways to enhance your service-level-driven inventory plan consistently. […]
 Why MRO Businesses Need Add-on Service Parts Planning & Inventory SoftwareMRO organizations exist in a wide range of industries, including public transit, electrical utilities, wastewater, hydro power, aviation, and mining. To get their work done, MRO professionals use Enterprise Asset Management (EAM) and Enterprise Resource Planning (ERP) systems. These systems are designed to do a lot of jobs. Given their features, cost, and extensive implementation requirements, there is an assumption that EAM and ERP systems can do it all. In this post, we summarize the need for add-on software that addresses specialized analytics for inventory optimization, forecasting, and service parts planning. […]
 5 Steps to Improve the Financial Impact of Spare Parts PlanningIn today’s competitive business landscape, companies are constantly seeking ways to improve their operational efficiency and drive increased revenue. Optimizing service parts management is an often-overlooked aspect that can have a significant financial impact. Companies can improve overall efficiency and generate significant financial returns by effectively managing spare parts inventory. This article will explore the economic implications of optimized service parts management and how investing in Inventory Optimization and Demand Planning Software can provide a competitive advantage. […]