Now More than Ever
Inventory optimization has become an even higher priority in recent months for many of our customers. Some are finding their products in vastly greater demand; more have the opposite problem. In either case, events like the Covid19 pandemic are forcing a reexamination of standard operating conditions, such as choices of reorder points and order quantities.
Even in quieter times, inventory control parameters like Mins and Maxes may be set far from their best values. We may ask “Why is the reorder point for SKU_1234 set at 20 units and the order quantify set at 35?” Those choices were probably the ossified result of years of accumulated guesses. A little investigation may show that the choices of 20 and 35 are no longer properly aligned with current demand level, demand volatility, supplier lead time and item costs.
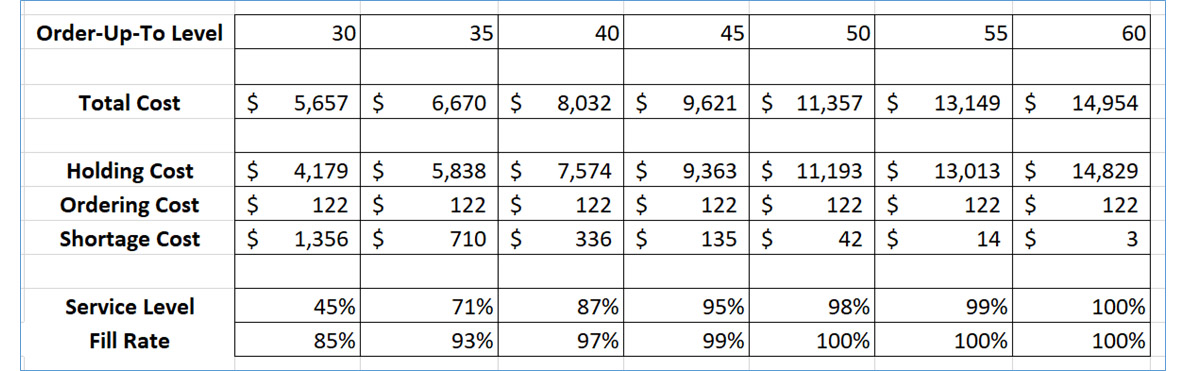
The nagging feeling that “We should re-think all these choices” is often followed by “Oh no, we have to figure this out for all 10,000 items in inventory?” The savior here is advanced software that can scale up the process and make it not only desirable but feasible. The software uses sophisticated algorithms to translate changes in inventory parameters such as reorder points into key performance indicators such as service levels and operating costs (defined as the sum of holding costs, ordering costs, and shortage costs).
This blog describes how to gain the benefits of inventory optimization by outlining 4 approaches with varying degrees of automation.
Four Approaches to Inventory Optimization
Hunt-and Peck
The first way is item-specific “hunt and peck” optimization. That is, you isolate one inventory item at a time and make “what if” guesses about how to manage that item. For instance, you may ask software to evaluate what happens if you change the reorder point for SKU123 from 20 to 21 while leaving the order quantity fixed at 35. Then you might try leaving 20 alone and reducing 35 to 34. Hours later, because your intuitions are good, you may have hit on a better pair of choices, but you don’t know if there is an even better combination that you didn’t try, and you may have to move on to the next SKU and the next and the next… You need something more automated and comprehensive.
There are three ways to get the job done more productively. The first two combine your intuition with the efficiency of treating groups of related items. The third is a fully automatic search.
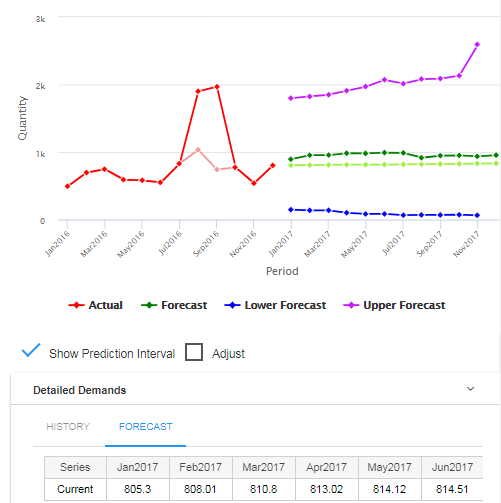
Service-level Driven Optimization
- Identify items that you want to all have the same service level. For instance, you might manage hundreds of “C” items and wonder whether their service level target should be 70%, or more, or less.
- Input a potential service level target and have the software predict the consequences in terms of inventory dollar investment and inventory operating cost.
- If you don’t like what you see, try another service level target until you are comfortable. Here the software does group-level predictions of the consequences of your choices, but you are still exploring your choices.
Optimization by Reallocation from a Benchmark
- Identify items that are related in some way, such as “all spares for undercarriages of light rail vehicles.”
- Use the software to assess the current spectrum of service levels and costs across the group of items. Usually, you will discover some items to be grossly overstocked (as indicated by service levels unreasonably high) and others grossly understocked (service levels embarrassingly low).
- Use the software to calculate the changes needed to lower the highest service levels and raise the lowest. This adjustment will often result in achieving two goals at once: increasing average service level while simultaneously decreasing average operating costs.
Fully automated, Item-Specific Optimization
- Identify items that all require service levels above a certain minimum. For instance, maybe you want all your “A” items to have at least a 95% service level.
- Use the software to identify, for each item, the choice of inventory parameters that will minimize the cost of meeting or exceeding the service level minimum. The software will efficiently search the “design space” defined by pairs of inventory parameters (e.g., Min and Max) for designs (e.g., Min=10, Max=23) that satisfy the service level constraint. Among those, it will identify the least cost design.
This approach goes farthest to shift the burden from the planner to the program. Many would benefit from making this the standard way they manage huge numbers of inventory items. For some items, it may be useful to put in a little more time to make sure that additional considerations are also accounted for. For instance, limited capacity in a purchasing department may force the solution away from the ideal by requiring a decrease in the frequency of orders, despite the price paid in higher overall operating costs.
Going Forward
Optimizing inventory parameters has never been more important, but it has always seemed like an impossible dream: it was too much work, and there were no good models to relate parameter choices to key performance indicators like service level and operating cost. Modern software for supply chain analytics has changed the game. Now the question is not “Why would we do that?” but “Why are we not doing that?” With software, you can connect “Here’s what we want” to “Make it so.”


Daily Demand Scenarios
In this Videoblog, we will explain how time series forecasting has emerged as a pivotal tool, particularly at the daily level, which Smart Software has been pioneering since its inception over forty years ago. The evolution of business practices from annual to more refined temporal increments like monthly and now daily data analysis illustrates a significant shift in operational strategies.

Irregular Operations
This blog is about “irregular operations.” Smart Software is in the process of adapting our products to help you cope with your own irregular ops. This is a preview.

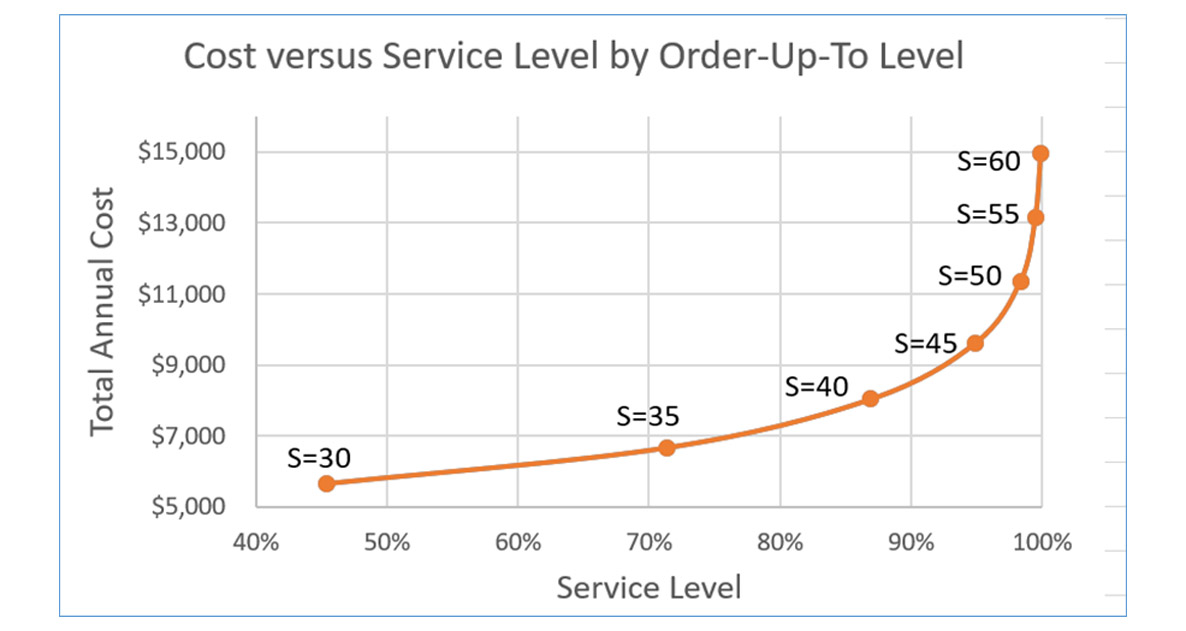
Finding Your Spot on the Inventory Tradeoff Curve
This video blog holds essential insights for those working with the complexities of inventory management. The session focuses on striking the right balance within the inventory tradeoff curve, inviting viewers to understand the deep-seated importance of this equilibrium.
Recent Posts
 Managing Spare Parts Inventory: Best PracticesIn this blog, we’ll explore several effective strategies for managing spare parts inventory, emphasizing the importance of optimizing stock levels, maintaining service levels, and using smart tools to aid in decision-making. Managing spare parts inventory is a critical component for businesses that depend on equipment uptime and service reliability. Unlike regular inventory items, spare parts often have unpredictable demand patterns, making them more challenging to manage effectively. An efficient spare parts inventory management system helps prevent stockouts that can lead to operational downtime and costly delays while also avoiding overstocking that unnecessarily ties up capital and increases holding costs. […]
 5 Ways to Improve Supply Chain Decision SpeedThe promise of a digital supply chain has transformed how businesses operate. At its core, it can make rapid, data-driven decisions while ensuring quality and efficiency throughout operations. However, it's not just about having access to more data. Organizations need the right tools and platforms to turn that data into actionable insights. This is where decision-making becomes critical, especially in a landscape where new digital supply chain solutions and AI-driven platforms can support you in streamlining many processes within the decision matrix. […]
 12 Causes of Overstocking and Practical SolutionsManaging inventory effectively is critical for maintaining a healthy balance sheet and ensuring that resources are optimally allocated. Here is an in-depth exploration of the main causes of overstocking, their implications, and possible solutions. […]
 FAQ: Mastering Smart IP&O for Better Inventory Management.Effective supply chain and inventory management are essential for achieving operational efficiency and customer satisfaction. This blog provides clear and concise answers to some basic and other common questions from our Smart IP&O customers, offering practical insights to overcome typical challenges and enhance your inventory management practices. Focusing on these key areas, we help you transform complex inventory issues into strategic, manageable actions that reduce costs and improve overall performance with Smart IP&O. […]
 7 Key Demand Planning Trends Shaping the FutureDemand planning goes beyond simply forecasting product needs; it's about ensuring your business meets customer demands with precision, efficiency, and cost-effectiveness. Latest demand planning technology addresses key challenges like forecast accuracy, inventory management, and market responsiveness. In this blog, we will introduce critical demand planning trends, including data-driven insights, probabilistic forecasting, consensus planning, predictive analytics, scenario modeling, real-time visibility, and multilevel forecasting. These trends will help you stay ahead of the curve, optimize your supply chain, reduce costs, and enhance customer satisfaction, positioning your business for long-term success. […]

Inventory Optimization for Manufacturers, Distributors, and MRO
- Managing Spare Parts Inventory: Best PracticesIn this blog, we’ll explore several effective strategies for managing spare parts inventory, emphasizing the importance of optimizing stock levels, maintaining service levels, and using smart tools to aid in decision-making. Managing spare parts inventory is a critical component for businesses that depend on equipment uptime and service reliability. Unlike regular inventory items, spare parts often have unpredictable demand patterns, making them more challenging to manage effectively. An efficient spare parts inventory management system helps prevent stockouts that can lead to operational downtime and costly delays while also avoiding overstocking that unnecessarily ties up capital and increases holding costs. […]
 Innovating the OEM Aftermarket with AI-Driven Inventory OptimizationThe aftermarket sector provides OEMs with a decisive advantage by offering a steady revenue stream and fostering customer loyalty through the reliable and timely delivery of service parts. However, managing inventory and forecasting demand in the aftermarket is fraught with challenges, including unpredictable demand patterns, vast product ranges, and the necessity for quick turnarounds. Traditional methods often fall short due to the complexity and variability of demand in the aftermarket. The latest technologies can analyze large datasets to predict future demand more accurately and optimize inventory levels, leading to better service and lower costs. […]
 Future-Proofing Utilities: Advanced Analytics for Supply Chain OptimizationUtilities in the electrical, natural gas, urban water, and telecommunications fields are all asset-intensive and reliant on physical infrastructure that must be properly maintained, updated, and upgraded over time. Maximizing asset uptime and the reliability of physical infrastructure demands effective inventory management, spare parts forecasting, and supplier management. A utility that executes these processes effectively will outperform its peers, provide better returns for its investors and higher service levels for its customers, while reducing its environmental impact. […]
 Centering Act: Spare Parts Timing, Pricing, and ReliabilityIn this article, we'll walk you through the process of crafting a spare parts inventory plan that prioritizes availability metrics such as service levels and fill rates while ensuring cost efficiency. We'll focus on an approach to inventory planning called Service Level-Driven Inventory Optimization. Next, we'll discuss how to determine what parts you should include in your inventory and those that might not be necessary. Lastly, we'll explore ways to enhance your service-level-driven inventory plan consistently. […]