Managing the Inventory of Promoted Items

The Smart Forecaster

 Pursuing best practices in demand planning,

forecasting and inventory optimization

In a previous post, I discussed one of the thornier problems demand planners sometimes face: working with product demand data characterized by what statisticians call skewness — a situation that can necessitate costly inventory investments. This sort of problematic data is found in several different scenarios. In at least one, the combination of intermittent demand and very effective sales promotions, the problem lends itself to an effective solution.

Reviewing terms, recall that “service level” is the probability of not stocking out while waiting for a replenishment order to arrive, while “fill rate” is the percentage of demand that is satisfied immediately from stock. In my previous post, “The Scourge of Skewness”, I pointed out that a certain type of demand distribution, having a “long right tail”, will lead to fill rates that can be much lower than service levels. I also pointed out that sometimes the only way to improve the fill rate is to increase the target service level to an unusually high level, which can be expensive.

In this post, I’ll look at solving the problem in one special case: skewness resulting from effective sales promotions mixed with “intermittent demand”. Intermittent demand has a large proportion of zero values, with nonzero values mixed in at random. Successful sales promotions, obviously positive, have a downside: they can confuse the “demand signal” with spikes in your demand history, and can undermine forecasts and bias safety stock calculations. When intermittent demand and effective sales promotions are the source of your data’s skewness, methods exist to work around the problem to achieve both higher fill rates and more accurate demand forecasts.

How Promotions Increase Skewness

Successful promotions abruptly increase item demand. This creates anomalies, or “outliers”, which contribute to forming a skewed distribution. Knowing when promotions occurred in the past, we can adjust an item’s record of past demand. We produce an alternate demand history as if there had been no promotions, by replacing the outliers with values more representative of the “natural” level of demand. These adjustments reduce demand skewness. Reduced skewness can lead to significant reductions in both expected forecasts and safety stocks, which add together to form reorder points.

Successful promotions are likely to be repeated. When that happens, the promotion effects can be added in to demand forecasts to increase their accuracy. The effect of future promotions on inventory management will be to increase the risk of stockouts, so a sensible response is to work at the operational level to build up temporary supply, in a quantity keyed to the estimated impact of prior promotions on the effected items.


Using Event Modeling to Improve Demand Forecasting

It’s possible to model the impact of like events, and apply this to planned events in the future. Doing so can improve your forecast in two big ways: by projecting the demand jolt you expect from a planned event; and rationalizing the spikes in the past that were caused by events, making your baseline activity more visible and more accurately forecastable. We do a lot of this in SmartForecasts, so allow me to use our experience there to show you what I mean.

Event Modeling entails the following steps:
• Automatically estimating the impact of previous promotions (which is a useful result in itself).
• Adjusting historical demand to statistically remove the effect of promotions.
• Creating promotion-free forecasts.
• Revising the forecasts for any future time periods in which promotions are planned.

We call this this type of analysis “Promo forecasting”. We use the word “promotions” to describe what you do yourself to improve your results. We use “events” to describe what the world does to you, usually to your detriment; examples include strikes, power outages, warehouse fires and other unlucky happenings.

To understand how Event Modeling can help you cope with skewness when doing demand forecasting for high-volume items, consider Figures 1-3.

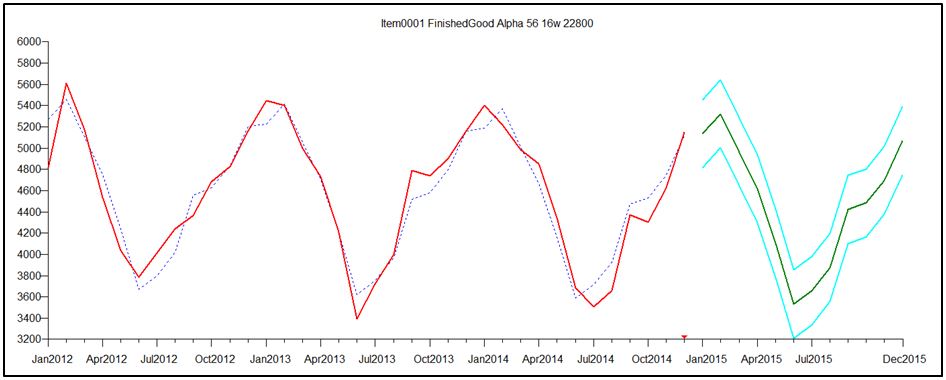
Figure 1 shows that this item’s demand pattern is clearly seasonal, and the forecast is both seasonal and “tight”, meaning that the forecast uncertainty interval (“margin of error”, shown in cyan lines) is very narrow.

Figure 2 shows an alternative history in which a promotion in June 2014 reversed the usual seasonal low associated with June sales. This demand pattern was forecasted using the Automatic forecasting tournament in SmartForecasts, as in Figure 1. This time, the promotion scrambled the seasonal pattern enough to create an inappropriate non-seasonal forecast, and one that has a much larger margin of error.

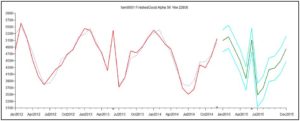
Finally, Figure 3 shows how Promo forecasting handles the same promoted scenario, retaining a seasonal forecast and building into the forecast an estimate of the effect of a planned repeat promotion in 2015.

The Case of Intermittent Demand

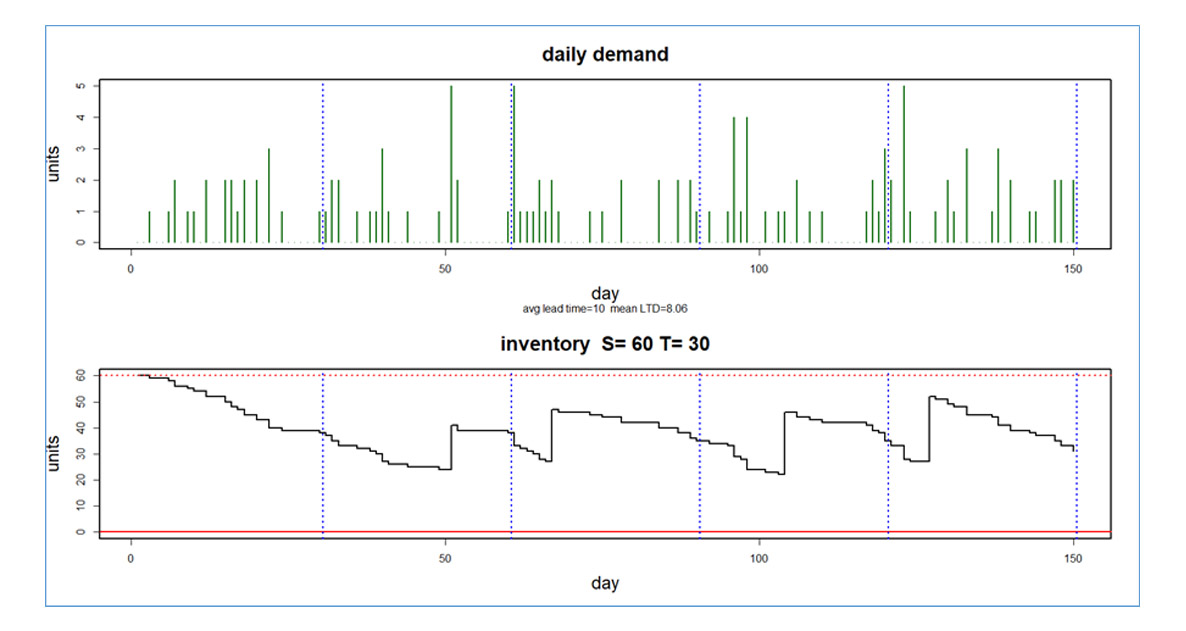
In Figure 1, the item was a high-volume finished good and the task was demand forecasting. Promo modeling is also useful when dealing with the task of setting safety stocks and reorder points for items with intermittent demand, whether the items are finished goods, components or spare parts. Intermittent demand very often has a skewed distribution that makes it difficult to achieve high item availability with a small investment in inventory.

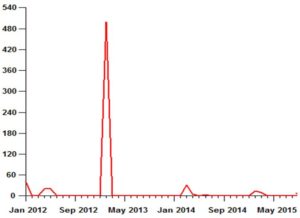
Figure 4 illustrates the problem that a successful promotion can accidentally create for inventory management. If such a spike arises from the natural, un-promoted demand, then the only way to maintain high fill rates is to provide safety stocks large enough to cope with these random surges. In this case, the big spike in demand of 500 units in February 2013 was the result of a one-time promotion.

Taking Account of Promotions to Improve Inventory Management

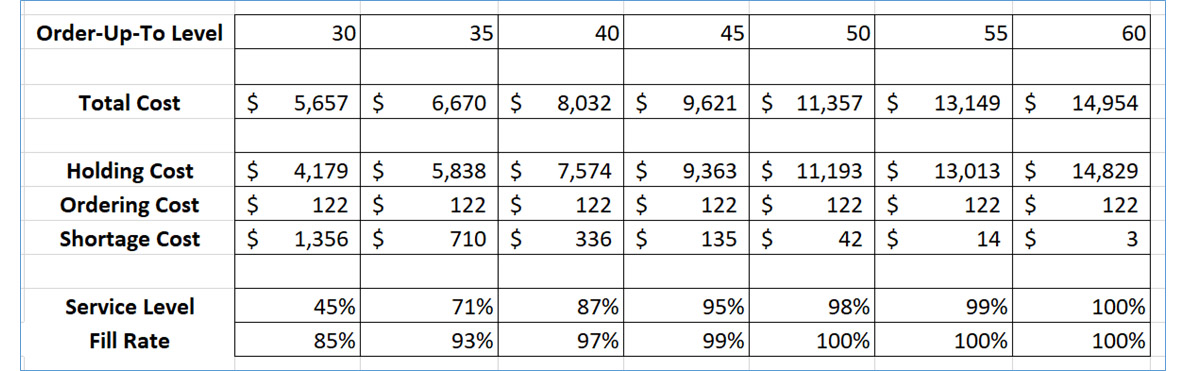
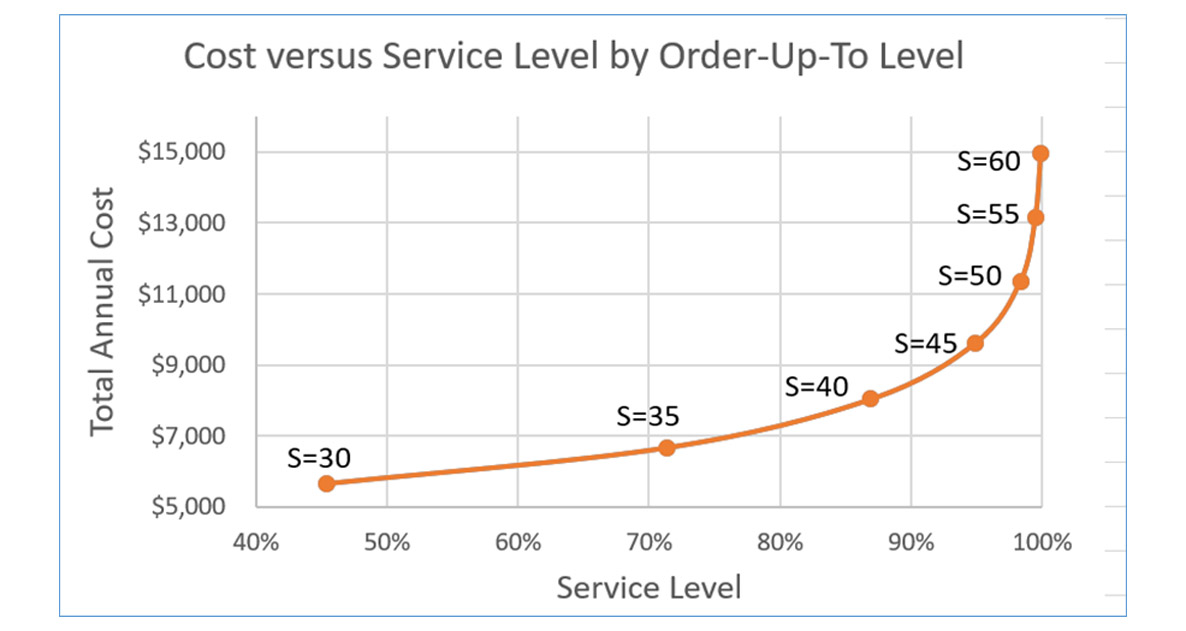
Unwittingly treating the spike in the example above as part of the natural demand variability results in a poor fill rate. To achieve a target service level of, say, 95% with a lead time of one month would require a reorder point of 38 units, computed as the sum of an expected forecast over the one month replenishment lead time of 21 units supplemented by a safety stock of 17 units. This investment would result in a disappointing fill rate of only 36%.

However, recognizing that the spike is a one-time promotion and replacing the 500 units with 0 obviously would make a big difference. The reorder point would drop from 38 units to 31 (the sum of an expected demand of 7 units and a safety stock of 24 units) and the fill rate would increase to 94%.

Of course, it is not ok to just throw out inconvenient demand spikes whenever they make life uncomfortable; there has to be a valid “business story” behind the adjustment of historical demand. If the spike is the result of a data processing error, then by all means, fix it. If the spike coincides with a promotion, then replacing the spike with, say, the median demand (often zero, as in this example) will result in a much more sustainable inventory investment that still meets aggressive performance targets. Future promotions of the same type on the same item will require some extra effort to prepare for the temporary surge in demand, but the recommended reorder point will be correct in the long run.

Thomas Willemain, PhD, co-founded Smart Software and currently serves as Senior Vice President for Research. Dr. Willemain also serves as Professor Emeritus of Industrial and Systems Engineering at Rensselear Polytechnic Institute and as a member of the research staff at the Center for Computing Sciences, Institute for Defense Analyses.

Leave a Comment

Related Posts

Why MRO Businesses Need Add-on Service Parts Planning & Inventory Software

Why MRO Businesses Need Add-on Service Parts Planning & Inventory Software

MRO organizations exist in a wide range of industries, including public transit, electrical utilities, wastewater, hydro power, aviation, and mining. To get their work done, MRO professionals use Enterprise Asset Management (EAM) and Enterprise Resource Planning (ERP) systems. These systems are designed to do a lot of jobs. Given their features, cost, and extensive implementation requirements, there is an assumption that EAM and ERP systems can do it all. In this post, we summarize the need for add-on software that addresses specialized analytics for inventory optimization, forecasting, and service parts planning.

The Objectives in Forecasting

The Objectives in Forecasting

A forecast is a prediction about the value of a time series variable at some time in the future. For instance, one might want to estimate next month’s sales or demand for a product item. A time series is a sequence of numbers recorded at equally spaced time intervals; for example, unit sales recorded every month. The objectives you pursue when you forecast depend on the nature of your job and your business. Every forecast is uncertain; in fact, there is a range of possible values for any variable you forecast. Values near the middle of this range have a higher likelihood of actually occurring, while values at the extremes of the range are less likely to occur.

The Forecasting Process for Decision-Makers

The Forecasting Process for Decision-Makers

In almost every business and industry, decision-makers need reliable forecasts of critical variables, such as sales, revenues, product demand, inventory levels, market share, expenses, and industry trends.Many kinds of people make these forecasts. Some are sophisticated technical analysts such as business economists and statisticians. Many others regard forecasting as an important part of their overall work: general managers, production planners, inventory control specialists, financial analysts, strategic planners, market researchers, and product and sales managers. Still, others seldom think of themselves as forecasters but often have to make forecasts on an intuitive, judgmental basis.

Recent Posts

  • Learning from Inventory Models Software AILearning from Inventory Models
    In this video blog, the spotlight is on a critical aspect of inventory management: the analysis and interpretation of inventory data. The focus is specifically on a dataset from a public transit agency detailing spare parts for buses. […]
  • Smart Software is in the process of adapting our products to help you cope with your own irregular opsIrregular Operations
    This blog is about “irregular operations.” Smart Software is in the process of adapting our products to help you cope with your own irregular ops. This is a preview. […]
  • Epicor AI Forecasting and Inventory Technology Combined with Planner Knowledge for InsightsSmart Software to Present at Epicor Insights 2024
    Smart Software will present at this year's Epicor Insights event in Nashville. If you plan to attend this year, please join us at booth #13 or #501, and learn more about Epicor Smart Inventory Planning and Optimization. . […]
  • Looking for Trouble in Your Inventory DataLooking for Trouble in Your Inventory Data
    In this video blog, the spotlight is on a critical aspect of inventory management: the analysis and interpretation of inventory data. The focus is specifically on a dataset from a public transit agency detailing spare parts for buses. […]
  • BAF Case Study SIOP planning Distribution CenterBig Ass Fans Turns to Smart Software as Demand Heats Up
    Big Ass Fans is the best-selling big fan manufacturer in the world, delivering comfort to spaces where comfort seems impossible. BAF had a problem: how to reliably plan production to meet demand. BAF was experiencing a gap between bookings forecasts vs. shipments, and this was impacting revenue and customer satisfaction BAF turned to Smart Software for help. […]

    Inventory Optimization for Manufacturers, Distributors, and MRO

    • Why MRO Businesses Need Add-on Service Parts Planning & Inventory SoftwareWhy MRO Businesses Need Add-on Service Parts Planning & Inventory Software
      MRO organizations exist in a wide range of industries, including public transit, electrical utilities, wastewater, hydro power, aviation, and mining. To get their work done, MRO professionals use Enterprise Asset Management (EAM) and Enterprise Resource Planning (ERP) systems. These systems are designed to do a lot of jobs. Given their features, cost, and extensive implementation requirements, there is an assumption that EAM and ERP systems can do it all. In this post, we summarize the need for add-on software that addresses specialized analytics for inventory optimization, forecasting, and service parts planning. […]
    • Spare-parts-demand-forecasting-a-different-perspective-for-planning-service-partsThe Forecast Matters, but Maybe Not the Way You Think
      True or false: The forecast doesn't matter to spare parts inventory management. At first glance, this statement seems obviously false. After all, forecasts are crucial for planning stock levels, right? It depends on what you mean by a “forecast”. If you mean an old-school single-number forecast (“demand for item CX218b will be 3 units next week and 6 units the week after”), then no. If you broaden the meaning of forecast to include a probability distribution taking account of uncertainties in both demand and supply, then yes. […]
    • Whyt MRO Businesses Should Care about Excess InventoryWhy MRO Businesses Should Care About Excess Inventory
      Do MRO companies genuinely prioritize reducing excess spare parts inventory? From an organizational standpoint, our experience suggests not necessarily. Boardroom discussions typically revolve around expanding fleets, acquiring new customers, meeting service level agreements (SLAs), modernizing infrastructure, and maximizing uptime. In industries where assets supported by spare parts cost hundreds of millions or generate significant revenue (e.g., mining or oil & gas), the value of the inventory just doesn’t raise any eyebrows, and organizations tend to overlook massive amounts of excessive inventory. […]
    • Top Differences between Inventory Planning for Finished Goods and for MRO and Spare PartsTop Differences Between Inventory Planning for Finished Goods and for MRO and Spare Parts
      In today’s competitive business landscape, companies are constantly seeking ways to improve their operational efficiency and drive increased revenue. Optimizing service parts management is an often-overlooked aspect that can have a significant financial impact. Companies can improve overall efficiency and generate significant financial returns by effectively managing spare parts inventory. This article will explore the economic implications of optimized service parts management and how investing in Inventory Optimization and Demand Planning Software can provide a competitive advantage. […]

      Riding the Tradeoff Curve

      The Smart Forecaster

       Pursuing best practices in demand planning,

      forecasting and inventory optimization

      What We’re Up Against

      As a third-generation Boston Red Sox fan, I’m disinclined to take advice from any New York Yankee ballplayer, even a great one but have to agree that sometimes, you just need to make a decision.   However, wouldn’t it be better if we knew the tradeoffs associated with each decision. Perhaps one road is more scenic but takes longer while the other is more direct but boring. Then you wouldn’t have to simply “take it” but could make an informed decision based on the advantages/disadvantages of each approach.

      In the supply chain planning world, the most fundamental decision is how to balance item availability against the cost of maintaining that availability (service levels and fill rates). At one extreme, you can grossly overstock and never run out until you go broke and have to close up shop from sinking all your cash into inventory that doesn’t sell.  At the other extreme, you can grossly understock and save a bundle on inventory holding costs but go broke and have to close up shop because all your customers took their business elsewhere.

      There is no escaping this fundamental tension. They way to survive and thrive is to find a productive and sustainable balance. To do that requires fact-based tradeoffs based on the numbers. To get the numbers requires software.

      The general drift of things is obvious. If you decide to keep more inventory, you will have more Holding Costs, lower Shortage Costs, and possibly lower Ordering Costs. Whether this costs or saves money is impossible to know without some sophisticated analysis, but usually the result is that the Total Cost goes up. But if you do invest in more inventory, something will be gained, because you will offer your customers higher Service Levels and Fill Rates. How much higher requires, as you might guess, some sophisticated analysis.

      Show Me the Numbers

      This blog lays out what such an analysis looks like. There is no universal solution pointing you to the “right” decision. You might think that the right decision is the one that does best by your bottom line. But to get those numbers, you would need something rarely seen: an accurate model of customer behavior with regard to service level (check out our article “How to choose a target service level”) For example, at what point will a customer walk away and take their business elsewhere?  Will it be after you stock out 1% of the time, 5% of time, 10% of the time? Will you still keep their business as long as you fill back orders quickly?  Will it be after a back order of 1 day, 2 days? 3 weeks? Will it be after this happens one time on one an important part or many times across many parts?  While modeling the precise service level that will allow you to keep your customer while minimizing costs seems like an unapproachable ideal, another type of sophisticated analysis is more pragmatic. 

      Inventory optimization and forecasting software can factor all associated costs such as the cost of stocking out, cost of holding inventory, and cost of ordering inventory in order to prescribe an optimal service level target that yields the lowest total cost. However, even that “optimal” service level is sensitive to changes in the costs making the results potentially questionable.  For example, if you don’t accurately estimate the precise costs (shortage costs are the most difficult) it will be tough to definitely state something like “If I increase my on-hand inventory by an average of one unit for all items in an important product family, my company will see a net gain of $170,500.  That gain increases until I get to 4 units.  At 4 units and higher, the return declines due to excessive holding costs. So, the best decision factoring projected holding, ordering, and stockout is to increase inventory by 3 units to see a net gain of over $500,000.  

      Short of that ideal, you can do something that is simpler yet still extremely valuable: Quantify the tradeoff curve between inventory cost and item availability. While you won’t necessarily know the service level you should target, you will know the costs of varying service levels.  Then you can earn your big bucks by finding a good place to be on that tradeoff curve and communicating where you at risk, where you aren’t, and setting expectations with customers and internal stakeholders.  Without the tradeoff curve to guide you, you are flying blind with no way to rationally modify stocking policy.

      A Scenario to Learn From

      Let’s sketch out a realistic tradeoff curve. We start with a scenario requiring a management decision. The scenario we will use and associated assumptions about demand, lead times, and costs are detailed below:

      Inventory Policy

      • Periodic review – Reorder decisions made every 30 days
      • Order-Up-To-Level (“S”) – Varied from 30 to 60 units
      • Shortage Policy – Allow backorders, no lost orders

      Demand

      • Demand is intermittent
      • Average = 0.8 units per day
      • Standard deviation = 1.2 units per day
      • Largest demand in a year ≈ 9
      • % of days with no demand = 53%

      Lead Time

      • Random at either 7, 14 or 21 days with probabilities 70%, 20% and 10%, respectively

      Cost Parameters

      • Holding cost = $1 per day
      • Ordering Cost = $10 per order without regard to size of order
      • Shortage Cost = $100 per unit not immediately shipped from stock

      We imagine an inventory control policy that is known in the trade as a “periodic review” or (T,S) policy. In this instance, the Review Period (“T”) is 30 days, meaning that every 30 days the inventory position is checked and an ordering decision is made. The order quantity is the difference between the observed number of units on hand and the Order-Up-To Quantity (“S”). So, if the end-of-month inventory is 12 units and S = 20, the order quantity would be S – 12 = 20 -1 2 = 8. The next month, the order quantity is likely to be different. If the inventory ever goes negative (backorders) during a review period, the next order tries to restore equilibrium by ordering more in order to fill those backorders. For example, if the inventory is -5 (meaning 5 units ordered by not available for shipping, the next order would be S – (-5) = S + 5. Details of the hypothetical demand stream, supplier lead times, and cost elements are shown in Figure 1 below. Figure 2 show a sample of daily demand and daily inventory over five review periods. Demand is intermittent, as is often true for spare parts, and therefore difficult to plan for.

      Figure 1: Different choices of inventory policy (order up to), associated costs, and service levels

      Figure 2: Details of five months of system operation given one of the polices


      Inventory Planning Software Is Our Friend

      Software encodes the logic of the operation of the (T,S) system, generates many hypothetical but realistic demand scenarios, calculates how each of those scenarios plays out, then looks back on the simulated operation (here, 10 years or 3,650 consecutive days) to calculate cost and performance metrics.

      To reveal the tradeoff curve, we ran several computational experiments in which we varied the Order-Up-To Level, S. The plots Figure 2 show the behavior of the on-hand inventory in “richest” alternative with S = 60. In the snippet shown in Figure 2, the on-hand inventory never comes close to stocking out. You can read that too ways. One, a bit naïve, is to say “Good, we’re well protected.” The other, more aggressive, is to say, “Oh no, we’re bloated. I wonder what would happen if we reduced S.”

      The Tradeoff Curve Revealed

      Figure 3 shows the results of reducing S from 60 down to 30 in steps of 5 units. The table shows that Total Cost is the sum of Holding Cost, Ordering Cost, and Shortage Cost. For the (T,S) policy, the ordering cost is always the same, since an order is placed like clockwork every 30 days. But the other components of cost respond to the changes in S.

      Figure 3: The experimental results and corresponding tradeoff curve showing how changing the Order-Up-To Level (“S”) impacts both Service Level and Total Annual Cost

      Note that the Service Level is always lower than the Fill Rate in these scenarios. As a professor, I always think of this difference in terms of exam grading. Each replenishment cycle is like a test. Service Level is about the probability of a stockout, so it’s a like the grade on pass/fail exam with one question that must be answered perfectly. If there is no stockout in a cycle, that’s an A. If there is a stockout, that’s an F. It doesn’t matter if it’s one unit that’s not supplied or 50 – it’s still an F. But Fill Rate is like a question that is graded with partial credit. So being short one of ten units gets you 90% Fill Rate for that cycle, not 0%. It’s important to understand the difference between these two important metrics for inventory planning – check out this vlog describing service level vs. fill rate via an interactive exercise in Excel.

      The plot in Figure 3 is the real news. It pairs Total Cost and Service Level for various levels of S. If you read the graph right to left, it tells us that there are dramatic cost savings to be had by reducing S with very little penalty in terms of reduced item availability. For instance, reducing S from 60 to 55 saves close to $800 per year on this one item while reducing service level just a bit from (essentially) 100% to a still-impressive 99%. Cutting S some more does the same, though not as dramatically. If you read the graph left to right, you see that moving up from S = 30 to S = 35 costs about $1,000 per year but improves Service Level from an F grade (45%) to at least a C grade (71%). After that, pushing S higher costs progressively more while gaining progressive less.

      The tradeoff curve doesn’t give you an answer to how to set the Order-Up-To Level, but it does let you evaluate the costs and benefits of each possible answer. Take a minute and pretend that this is your problem: Where would you want to be along the tradeoff curve?

      You may object and say you hate your choices and want to change the game. Is there escape from the curve? Not from the general curve, but you might be able to shape a less painful curve. How?

      You may have other cards to play. One avenue is to try to “shape” the demand so that it is less variable. The demand plot in Figure 2 shows a lot of variability. If you could smooth out the demand, the whole tradeoff curve would shift down, making every choice less expensive. A second avenue is to try to reduce the mean and variability of supplier lead times. Achieving either would also shift the curve down to make the choice less painful. Check out our article on how suppliers influence your inventory costs

      Summary

      The tradeoff curve is always with us. Sometimes we may be able to make it more friendly, but we always to pick our spot along it. It is better to know what you’re getting for any choice of inventory policy than to try to guess, and the curve gives you that.  When you have an accurate estimate of that curve, you are no longer flying blind when it comes to inventory planning. 


      Leave a Comment

      Related Posts

      Why MRO Businesses Need Add-on Service Parts Planning & Inventory Software

      Why MRO Businesses Need Add-on Service Parts Planning & Inventory Software

      MRO organizations exist in a wide range of industries, including public transit, electrical utilities, wastewater, hydro power, aviation, and mining. To get their work done, MRO professionals use Enterprise Asset Management (EAM) and Enterprise Resource Planning (ERP) systems. These systems are designed to do a lot of jobs. Given their features, cost, and extensive implementation requirements, there is an assumption that EAM and ERP systems can do it all. In this post, we summarize the need for add-on software that addresses specialized analytics for inventory optimization, forecasting, and service parts planning.

      Head to Head: Which Service Parts Inventory Policy is Best?

      Head to Head: Which Service Parts Inventory Policy is Best?

      Our customers have usually settled into one way to manage their service parts inventory. The professor in me would like to think that the chosen inventory policy was a reasoned choice among considered alternatives, but more likely it just sort of happened. Maybe the inventory honcho from long ago had a favorite and that choice stuck. Maybe somebody used an EAM or ERP system that offered only one choice. Perhaps there were some guesses made, based on the conditions at the time.

      Leveraging ERP Planning BOMs with Smart IP&O to Forecast the Unforecastable

      Leveraging ERP Planning BOMs with Smart IP&O to Forecast the Unforecastable

      In a highly configurable manufacturing environment, forecasting finished goods can become a complex and daunting task. The number of possible finished products will skyrocket when many components are interchangeable. A traditional MRP would force us to forecast every single finished product which can be unrealistic or even impossible. Several leading ERP solutions introduce the concept of the “Planning BOM”, which allows the use of forecasts at a higher level in the manufacturing process. In this article, we will discuss this functionality in ERP, and how you can take advantage of it with Smart Inventory Planning and Optimization (Smart IP&O) to get ahead of your demand in the face of this complexity.

      Recent Posts

      • Learning from Inventory Models Software AILearning from Inventory Models
        In this video blog, the spotlight is on a critical aspect of inventory management: the analysis and interpretation of inventory data. The focus is specifically on a dataset from a public transit agency detailing spare parts for buses. […]
      • Smart Software is in the process of adapting our products to help you cope with your own irregular opsIrregular Operations
        This blog is about “irregular operations.” Smart Software is in the process of adapting our products to help you cope with your own irregular ops. This is a preview. […]
      • Epicor AI Forecasting and Inventory Technology Combined with Planner Knowledge for InsightsSmart Software to Present at Epicor Insights 2024
        Smart Software will present at this year's Epicor Insights event in Nashville. If you plan to attend this year, please join us at booth #13 or #501, and learn more about Epicor Smart Inventory Planning and Optimization. . […]
      • Looking for Trouble in Your Inventory DataLooking for Trouble in Your Inventory Data
        In this video blog, the spotlight is on a critical aspect of inventory management: the analysis and interpretation of inventory data. The focus is specifically on a dataset from a public transit agency detailing spare parts for buses. […]
      • BAF Case Study SIOP planning Distribution CenterBig Ass Fans Turns to Smart Software as Demand Heats Up
        Big Ass Fans is the best-selling big fan manufacturer in the world, delivering comfort to spaces where comfort seems impossible. BAF had a problem: how to reliably plan production to meet demand. BAF was experiencing a gap between bookings forecasts vs. shipments, and this was impacting revenue and customer satisfaction BAF turned to Smart Software for help. […]

        Inventory Optimization for Manufacturers, Distributors, and MRO

        • Why MRO Businesses Need Add-on Service Parts Planning & Inventory SoftwareWhy MRO Businesses Need Add-on Service Parts Planning & Inventory Software
          MRO organizations exist in a wide range of industries, including public transit, electrical utilities, wastewater, hydro power, aviation, and mining. To get their work done, MRO professionals use Enterprise Asset Management (EAM) and Enterprise Resource Planning (ERP) systems. These systems are designed to do a lot of jobs. Given their features, cost, and extensive implementation requirements, there is an assumption that EAM and ERP systems can do it all. In this post, we summarize the need for add-on software that addresses specialized analytics for inventory optimization, forecasting, and service parts planning. […]
        • Spare-parts-demand-forecasting-a-different-perspective-for-planning-service-partsThe Forecast Matters, but Maybe Not the Way You Think
          True or false: The forecast doesn't matter to spare parts inventory management. At first glance, this statement seems obviously false. After all, forecasts are crucial for planning stock levels, right? It depends on what you mean by a “forecast”. If you mean an old-school single-number forecast (“demand for item CX218b will be 3 units next week and 6 units the week after”), then no. If you broaden the meaning of forecast to include a probability distribution taking account of uncertainties in both demand and supply, then yes. […]
        • Whyt MRO Businesses Should Care about Excess InventoryWhy MRO Businesses Should Care About Excess Inventory
          Do MRO companies genuinely prioritize reducing excess spare parts inventory? From an organizational standpoint, our experience suggests not necessarily. Boardroom discussions typically revolve around expanding fleets, acquiring new customers, meeting service level agreements (SLAs), modernizing infrastructure, and maximizing uptime. In industries where assets supported by spare parts cost hundreds of millions or generate significant revenue (e.g., mining or oil & gas), the value of the inventory just doesn’t raise any eyebrows, and organizations tend to overlook massive amounts of excessive inventory. […]
        • Top Differences between Inventory Planning for Finished Goods and for MRO and Spare PartsTop Differences Between Inventory Planning for Finished Goods and for MRO and Spare Parts
          In today’s competitive business landscape, companies are constantly seeking ways to improve their operational efficiency and drive increased revenue. Optimizing service parts management is an often-overlooked aspect that can have a significant financial impact. Companies can improve overall efficiency and generate significant financial returns by effectively managing spare parts inventory. This article will explore the economic implications of optimized service parts management and how investing in Inventory Optimization and Demand Planning Software can provide a competitive advantage. […]

          The Scourge of Skewness

          The Smart Forecaster

           Pursuing best practices in demand planning,

          forecasting and inventory optimization

          Demand planners have to cope with multiple problems to get their job done. One is the Irritation of Intermittency. The “now you see it, now you don’t” character of intermittent demand, with its heavy mix of zero values, forces the use of advanced statistical methods, such as Smart Software’s patented Markov Bootstrap algorithm. But even within the dark realm of intermittent demand, there are degrees of difficulty: planners must further cope with the potentially costly Scourge of Skewness.

          Skewness is a statistical term describing the degree to which a demand distribution is not symmetrical. The classic (and largely mythic) “bell-shaped” curve is symmetric, with equal chances of demand in any time period falling below or above the average. In contrast, a skewed distribution is lopsided, with most values falling either above or below the average. In most cases, demand data are positively skewed, with a long tail of values extending toward the higher end of the demand scale.

          Bar graphs of two time series
          Figure 1: Two intermittent demand series with different levels of skewness
          Figure 1 shows two time series of 60 months of intermittent demand. Both are positively skewed, but the data in the bottom panel are more skewed. Both series have nearly the same average demand, but the one on top is a mix of 0’s, 1’s and 2’s, while the one on the bottom is a mix of 0’s, 1’s and 4’s.

          What makes positive skewness a problem is that it reduces an item’s fill rate. Fill rate is an important inventory management performance metric. It measures the percentage of demand that is satisfied immediately from on-hand inventory. Any backorders or lost sales reduce the fill rate (besides squandering customer good will).

          Fill rate is a companion to the other key performance metric: Service level. Service level measures the chance that an item will stock out during the replenishment lead time. Lead time is measured from the moment when inventory drops to or below an item’s reorder point, triggering a replenishment order, until the arrival of the replacement inventory.

          Inventory management software, such as Smart Software’s SmartForecasts, can analyze demand patterns to calculate the reorder point required to achieve a specified service level target. To hit a 95% service level for the item in the top panel of Figure 1, assuming a lead time of 1 month, the required reorder point is 3; for the bottom item, the reorder point is 1. (The first reorder point is 3 to allow for the distinct possibility that future demand values will exceed the largest values, 2, observed so far. In fact, values as large as 8 are possible.) See Figure 2.

          Histograms of two time series
          Figure 2: Distributions of total demand during a replenishment lead time of 1 month
          (Figure 2 plots the predicted distribution of demand over the lead time. The green bars represent the probability that any particular level of demand will materialize.)

          Using the required reorder point of 3 units, the fill rate for the less skewed item is a healthy 93%. However, the fill rate for the more skewed item is a troubling 44%, even though this item too achieves a service level of 95%. This is the scourge of skewness.

          The explanation for the difference in fill rates is the degree of skewness. The reorder point for the more skewed item is 1 unit. Having 1 unit on hand at the start of the lead time will be sufficient to handle 95% of the demands arriving during a 1 month lead time. However, the monthly demand could reach above 15 units, so when the more skewed unit stocks out, it will “stock out big time”, losing a much larger number of units.

          Most demand planners would be proud to achieve a 95% service level and a 93% fill rate. Most would be troubled, and puzzled, by achieving the 95% service level but only a 44% fill rate. This partial failure would not be their fault: it can be traced directly to the nasty skewness in the distribution of monthly demand values.

          There is no painless fix to this problem. The only way to boost the fill rate in this situation is to raise the service level target, which will in turn boost the reorder point, which finally will reduce both the frequency of stockouts and their size whenever they occur. In this example, raising the reorder point from 1 unit to 3 units will achieve a 99% service level and boost fill rate to a respectable, but not outstanding, 84%. This improvement would come at the cost of essentially tripling the dollars tied up in managing this more skewed item.

          Thomas Willemain, PhD, co-founded Smart Software and currently serves as Senior Vice President for Research. Dr. Willemain also serves as Professor Emeritus of Industrial and Systems Engineering at Rensselear Polytechnic Institute and as a member of the research staff at the Center for Computing Sciences, Institute for Defense Analyses.

          Leave a Comment

          Related Posts

          Why MRO Businesses Need Add-on Service Parts Planning & Inventory Software

          Why MRO Businesses Need Add-on Service Parts Planning & Inventory Software

          MRO organizations exist in a wide range of industries, including public transit, electrical utilities, wastewater, hydro power, aviation, and mining. To get their work done, MRO professionals use Enterprise Asset Management (EAM) and Enterprise Resource Planning (ERP) systems. These systems are designed to do a lot of jobs. Given their features, cost, and extensive implementation requirements, there is an assumption that EAM and ERP systems can do it all. In this post, we summarize the need for add-on software that addresses specialized analytics for inventory optimization, forecasting, and service parts planning.

          The Objectives in Forecasting

          The Objectives in Forecasting

          A forecast is a prediction about the value of a time series variable at some time in the future. For instance, one might want to estimate next month’s sales or demand for a product item. A time series is a sequence of numbers recorded at equally spaced time intervals; for example, unit sales recorded every month. The objectives you pursue when you forecast depend on the nature of your job and your business. Every forecast is uncertain; in fact, there is a range of possible values for any variable you forecast. Values near the middle of this range have a higher likelihood of actually occurring, while values at the extremes of the range are less likely to occur.

          The Forecasting Process for Decision-Makers

          The Forecasting Process for Decision-Makers

          In almost every business and industry, decision-makers need reliable forecasts of critical variables, such as sales, revenues, product demand, inventory levels, market share, expenses, and industry trends.Many kinds of people make these forecasts. Some are sophisticated technical analysts such as business economists and statisticians. Many others regard forecasting as an important part of their overall work: general managers, production planners, inventory control specialists, financial analysts, strategic planners, market researchers, and product and sales managers. Still, others seldom think of themselves as forecasters but often have to make forecasts on an intuitive, judgmental basis.

          Recent Posts

          • Learning from Inventory Models Software AILearning from Inventory Models
            In this video blog, the spotlight is on a critical aspect of inventory management: the analysis and interpretation of inventory data. The focus is specifically on a dataset from a public transit agency detailing spare parts for buses. […]
          • Smart Software is in the process of adapting our products to help you cope with your own irregular opsIrregular Operations
            This blog is about “irregular operations.” Smart Software is in the process of adapting our products to help you cope with your own irregular ops. This is a preview. […]
          • Epicor AI Forecasting and Inventory Technology Combined with Planner Knowledge for InsightsSmart Software to Present at Epicor Insights 2024
            Smart Software will present at this year's Epicor Insights event in Nashville. If you plan to attend this year, please join us at booth #13 or #501, and learn more about Epicor Smart Inventory Planning and Optimization. . […]
          • Looking for Trouble in Your Inventory DataLooking for Trouble in Your Inventory Data
            In this video blog, the spotlight is on a critical aspect of inventory management: the analysis and interpretation of inventory data. The focus is specifically on a dataset from a public transit agency detailing spare parts for buses. […]
          • BAF Case Study SIOP planning Distribution CenterBig Ass Fans Turns to Smart Software as Demand Heats Up
            Big Ass Fans is the best-selling big fan manufacturer in the world, delivering comfort to spaces where comfort seems impossible. BAF had a problem: how to reliably plan production to meet demand. BAF was experiencing a gap between bookings forecasts vs. shipments, and this was impacting revenue and customer satisfaction BAF turned to Smart Software for help. […]

            Inventory Optimization for Manufacturers, Distributors, and MRO

            • Why MRO Businesses Need Add-on Service Parts Planning & Inventory SoftwareWhy MRO Businesses Need Add-on Service Parts Planning & Inventory Software
              MRO organizations exist in a wide range of industries, including public transit, electrical utilities, wastewater, hydro power, aviation, and mining. To get their work done, MRO professionals use Enterprise Asset Management (EAM) and Enterprise Resource Planning (ERP) systems. These systems are designed to do a lot of jobs. Given their features, cost, and extensive implementation requirements, there is an assumption that EAM and ERP systems can do it all. In this post, we summarize the need for add-on software that addresses specialized analytics for inventory optimization, forecasting, and service parts planning. […]
            • Spare-parts-demand-forecasting-a-different-perspective-for-planning-service-partsThe Forecast Matters, but Maybe Not the Way You Think
              True or false: The forecast doesn't matter to spare parts inventory management. At first glance, this statement seems obviously false. After all, forecasts are crucial for planning stock levels, right? It depends on what you mean by a “forecast”. If you mean an old-school single-number forecast (“demand for item CX218b will be 3 units next week and 6 units the week after”), then no. If you broaden the meaning of forecast to include a probability distribution taking account of uncertainties in both demand and supply, then yes. […]
            • Whyt MRO Businesses Should Care about Excess InventoryWhy MRO Businesses Should Care About Excess Inventory
              Do MRO companies genuinely prioritize reducing excess spare parts inventory? From an organizational standpoint, our experience suggests not necessarily. Boardroom discussions typically revolve around expanding fleets, acquiring new customers, meeting service level agreements (SLAs), modernizing infrastructure, and maximizing uptime. In industries where assets supported by spare parts cost hundreds of millions or generate significant revenue (e.g., mining or oil & gas), the value of the inventory just doesn’t raise any eyebrows, and organizations tend to overlook massive amounts of excessive inventory. […]
            • Top Differences between Inventory Planning for Finished Goods and for MRO and Spare PartsTop Differences Between Inventory Planning for Finished Goods and for MRO and Spare Parts
              In today’s competitive business landscape, companies are constantly seeking ways to improve their operational efficiency and drive increased revenue. Optimizing service parts management is an often-overlooked aspect that can have a significant financial impact. Companies can improve overall efficiency and generate significant financial returns by effectively managing spare parts inventory. This article will explore the economic implications of optimized service parts management and how investing in Inventory Optimization and Demand Planning Software can provide a competitive advantage. […]

              A Check on Forecast Automation with the Attention Index

              The Smart Forecaster

              Pursuing best practices in demand planning,

              forecasting and inventory optimization

              A new metric we call the “Attention Index” will help forecasters identify situations where “data behaving badly” can distort automatic statistical forecasts (see adjacent poem). It quickly identifies those items most likely to require forecast overrides—providing a more efficient way to put business experience and other human intelligence to work maximizing the accuracy of forecasts. How does it work?

              Classical forecasting methods, such as the various flavors of exponential smoothing and moving averages, insist on a leap of faith. They require that we trust present conditions to persist into the future. If present conditions do persist, then it is sensible to use these extrapolative methods—methods which quantify the current level, trend, seasonality and “noise” of a time series and project them into the future.

              But if they do not persist, extrapolative methods can get us into trouble. What had been going up might suddenly be going down. What used to be centered around one level might suddenly jump to another. Or something really odd might happen that is entirely out of pattern. In these surprising circumstances, forecast accuracy deteriorates, inventory calculations go wrong and general unhappiness ensues.

              One way to cope with this problem is to rely on more complex forecasting models that account for external factors that drive the variable being forecasted. For instance, sales promotions attempt to disrupt buying patterns and move them in a positive direction, so including promotion activity in the forecasting process can improve sales forecasting. Sometimes macroeconomic indicators, such as housing starts or inflation rates, can be used to improve forecast accuracy. But more complex models require more data and more expertise, and they may not be useful for some problems—such as managing parts or subsystems, rather than finished goods.

              If one is stuck using simple extrapolative methods, it is useful to have a way to flag items that will be difficult to forecast. This is the Attention Index. As the name suggests, items to be forecast with a high Attention Index require special handling—at least a review, and usually some sort of forecast adjustment.


              The Attention Index detects three types of problems:

              An outlier in the demand history of an item.
              An abrupt change in the level of an item.
              An abrupt change in the trend of an item.
              Using software like SmartForecasts™, the forecaster can deal with an outlier by replacing it with a more typical value.

              An abrupt change in level or trend can be dealt with by omitting, from the forecasting calculations, all data from before the “rupture” in the demand pattern—assuming that the item has switched into a new regime that renders the older data irrelevant.

              While no index is perfect, the Attention Index does a good job of focusing attention on the most problematic demand histories. This is demonstrated in the two figures below, which were produced with data from the M3 Competition, well known in the forecasting world. Figure 1 shows the 20 items (out of the contest’s 3,003) with the highest Attention Index scores; all of these have grotesque outliers and ruptures. Figure 2 shows the 20 items with the lowest Attention Index scores; most (but not all) of the items with low scores have relatively benign patterns.

              If you have thousands of items to forecast, the new Attention Index will be very useful for focusing your attention on those items most likely to be problematic.

              Thomas Willemain, PhD, co-founded Smart Software and currently serves as Senior Vice President for Research. Dr. Willemain also serves as Professor Emeritus of Industrial and Systems Engineering at Rensselaer Polytechnic Institute and as a member of the research staff at the Center for Computing Sciences, Institute for Defense Analyses.

              Leave a Comment

              Related Posts

              The Objectives in Forecasting

              The Objectives in Forecasting

              A forecast is a prediction about the value of a time series variable at some time in the future. For instance, one might want to estimate next month’s sales or demand for a product item. A time series is a sequence of numbers recorded at equally spaced time intervals; for example, unit sales recorded every month. The objectives you pursue when you forecast depend on the nature of your job and your business. Every forecast is uncertain; in fact, there is a range of possible values for any variable you forecast. Values near the middle of this range have a higher likelihood of actually occurring, while values at the extremes of the range are less likely to occur.

              The Forecasting Process for Decision-Makers

              The Forecasting Process for Decision-Makers

              In almost every business and industry, decision-makers need reliable forecasts of critical variables, such as sales, revenues, product demand, inventory levels, market share, expenses, and industry trends.Many kinds of people make these forecasts. Some are sophisticated technical analysts such as business economists and statisticians. Many others regard forecasting as an important part of their overall work: general managers, production planners, inventory control specialists, financial analysts, strategic planners, market researchers, and product and sales managers. Still, others seldom think of themselves as forecasters but often have to make forecasts on an intuitive, judgmental basis.

              Leveraging ERP Planning BOMs with Smart IP&O to Forecast the Unforecastable

              Leveraging ERP Planning BOMs with Smart IP&O to Forecast the Unforecastable

              In a highly configurable manufacturing environment, forecasting finished goods can become a complex and daunting task. The number of possible finished products will skyrocket when many components are interchangeable. A traditional MRP would force us to forecast every single finished product which can be unrealistic or even impossible. Several leading ERP solutions introduce the concept of the “Planning BOM”, which allows the use of forecasts at a higher level in the manufacturing process. In this article, we will discuss this functionality in ERP, and how you can take advantage of it with Smart Inventory Planning and Optimization (Smart IP&O) to get ahead of your demand in the face of this complexity.

              Recent Posts

              • Learning from Inventory Models Software AILearning from Inventory Models
                In this video blog, the spotlight is on a critical aspect of inventory management: the analysis and interpretation of inventory data. The focus is specifically on a dataset from a public transit agency detailing spare parts for buses. […]
              • Smart Software is in the process of adapting our products to help you cope with your own irregular opsIrregular Operations
                This blog is about “irregular operations.” Smart Software is in the process of adapting our products to help you cope with your own irregular ops. This is a preview. […]
              • Epicor AI Forecasting and Inventory Technology Combined with Planner Knowledge for InsightsSmart Software to Present at Epicor Insights 2024
                Smart Software will present at this year's Epicor Insights event in Nashville. If you plan to attend this year, please join us at booth #13 or #501, and learn more about Epicor Smart Inventory Planning and Optimization. . […]
              • Looking for Trouble in Your Inventory DataLooking for Trouble in Your Inventory Data
                In this video blog, the spotlight is on a critical aspect of inventory management: the analysis and interpretation of inventory data. The focus is specifically on a dataset from a public transit agency detailing spare parts for buses. […]
              • BAF Case Study SIOP planning Distribution CenterBig Ass Fans Turns to Smart Software as Demand Heats Up
                Big Ass Fans is the best-selling big fan manufacturer in the world, delivering comfort to spaces where comfort seems impossible. BAF had a problem: how to reliably plan production to meet demand. BAF was experiencing a gap between bookings forecasts vs. shipments, and this was impacting revenue and customer satisfaction BAF turned to Smart Software for help. […]

                Inventory Optimization for Manufacturers, Distributors, and MRO

                • Why MRO Businesses Need Add-on Service Parts Planning & Inventory SoftwareWhy MRO Businesses Need Add-on Service Parts Planning & Inventory Software
                  MRO organizations exist in a wide range of industries, including public transit, electrical utilities, wastewater, hydro power, aviation, and mining. To get their work done, MRO professionals use Enterprise Asset Management (EAM) and Enterprise Resource Planning (ERP) systems. These systems are designed to do a lot of jobs. Given their features, cost, and extensive implementation requirements, there is an assumption that EAM and ERP systems can do it all. In this post, we summarize the need for add-on software that addresses specialized analytics for inventory optimization, forecasting, and service parts planning. […]
                • Spare-parts-demand-forecasting-a-different-perspective-for-planning-service-partsThe Forecast Matters, but Maybe Not the Way You Think
                  True or false: The forecast doesn't matter to spare parts inventory management. At first glance, this statement seems obviously false. After all, forecasts are crucial for planning stock levels, right? It depends on what you mean by a “forecast”. If you mean an old-school single-number forecast (“demand for item CX218b will be 3 units next week and 6 units the week after”), then no. If you broaden the meaning of forecast to include a probability distribution taking account of uncertainties in both demand and supply, then yes. […]
                • Whyt MRO Businesses Should Care about Excess InventoryWhy MRO Businesses Should Care About Excess Inventory
                  Do MRO companies genuinely prioritize reducing excess spare parts inventory? From an organizational standpoint, our experience suggests not necessarily. Boardroom discussions typically revolve around expanding fleets, acquiring new customers, meeting service level agreements (SLAs), modernizing infrastructure, and maximizing uptime. In industries where assets supported by spare parts cost hundreds of millions or generate significant revenue (e.g., mining or oil & gas), the value of the inventory just doesn’t raise any eyebrows, and organizations tend to overlook massive amounts of excessive inventory. […]
                • Top Differences between Inventory Planning for Finished Goods and for MRO and Spare PartsTop Differences Between Inventory Planning for Finished Goods and for MRO and Spare Parts
                  In today’s competitive business landscape, companies are constantly seeking ways to improve their operational efficiency and drive increased revenue. Optimizing service parts management is an often-overlooked aspect that can have a significant financial impact. Companies can improve overall efficiency and generate significant financial returns by effectively managing spare parts inventory. This article will explore the economic implications of optimized service parts management and how investing in Inventory Optimization and Demand Planning Software can provide a competitive advantage. […]