Using Key Performance Predictions to Plan Stocking Policies

I can’t imagine being an inventory planner in spare parts, distribution, or manufacturing and having to create safety stock levels, reorder points, and order suggestions without using key performance predictions of service levels, fill rates, and inventory costs:

Using Key Performance Predictions to Plan Stocking Policies Iventory

Smart’s Inventory Optimization solution generates out-of-the-box key performance predictions that dynamically simulate how your current stocking policies will perform against possible future demands.  It reports on how often you’ll stock out, the size of the stockouts, the value of your inventory, holding costs, and more.  It lets you proactively identify problems before they occur so you can take corrective action in the short term. You can create what-if scenarios by setting targeted service levels and modifying lead times so you an see the predicted impact of these changes before committing to it.

For example,

  • You can see if a proposed move from the current service level of 90% to a targeted service level of 97% is financially advantageous
  • You can automatically identify if a different service level target is even more profitable to your business that the proposed target.
  • You can see exactly how much you’ll need to increase your reorder points to accommodate a longer lead time.


If you aren’t equipping planners with the right tools, they’ll be forced to set stocking policies, safety stock levels, and create demand forecasts in Excel or with outdated ERP functionality.   Not knowing how policies are predicted to perform will leave your company ill equipped to properly allocate inventory.  Contact us today to learn how we can help!


What is Inventory Planning? A Brief Dictionary of Inventory-Related Terms

Inventory Control concerns the management of physical goods, focusing on an accurate and up-to-the-minute count of every item in inventory and where it is located, as well as efficient retrieval of items. Relevant technologies include computer databases, barcoding, Radio Frequency Identification (RFID), and the use of robots for retrieval.

Inventory Management aims to execute the inventory policy defined by the company. Inventory Management is often accomplished using Enterprise Resource Planning (ERP) systems, which generate purchase orders, production orders, and reporting that details current inventory on hand, incoming, and up for order.

Inventory Planning sets operational policy details, such as item-specific reorder points and order quantities, and predicts future demand and supplier lead times. Important components of an inventory planning process include what-if scenarios for netting out on-hand inventory, analyzing how changes to demand, lead times, and stocking policies will impact ordering, as well as managing exceptions and contingencies.

Inventory Optimization utilizes an analytical process that computes values for inventory planning parameters (e.g., reorder points and order quantities) that optimize a numerical goal or “objective function” without violating a numerical constraint. For instance, an objective function might be to achieve the lowest possible inventory operating cost (defined as the sum of inventory holding costs, ordering costs, and shortage costs), and the constraint might be to achieve a fill rate of at least 90%. Using a mathematical model of the inventory system and probability forecasts of item demand, inventory optimization can quickly and automatically suggest how to best manage thousands of inventory items.

Improve Forecast Accuracy by Managing Error

The Smart Forecaster

 Pursuing best practices in demand planning,

forecasting and inventory optimization

Improve Forecast Accuracy, Eliminate Excess Inventory, & Maximize Service Levels

In this video, Dr. Thomas Willemain, co-Founder and SVP Research, talks about improving Forecast Accuracy by Managing Error. This video is the first in our series on effective methods to Improve Forecast Accuracy.  We begin by looking at how forecast error causes pain and the consequential cost related to it. Then we will explain the three most common mistakes to avoid that can help us increase revenue and prevent excess inventory. Tom concludes by reviewing the methods to improve Forecast Accuracy, the importance of measuring forecast error, and the technological opportunities to improve it.


Forecast error can be consequential

Consider one item of many

  • Product X costs $100 to make and nets $50 profit per unit.
  • Sales of Product X will turn out to be 1,000/month over the next 12 months.
  • Consider one item of many

What is the cost of forecast error?

  • If the forecast is 10% high, end the year with $120,000 of excess inventory.
  • 100 extra/month x 12 months x $100/unit
  • If the forecast is 10% low, miss out on $60,000 of profit.
  • 100 too few/month x 12 months x $50/unit


Three mistakes to avoid

1. Ignoring error.

  • Unprofessional, dereliction of duty.
  • Wishing will not make it so.
  • Treat accuracy assessment as data science, not a blame game.

2. Tolerating more error than necessary.

  • Statistical forecasting methods can improve accuracy at scale.
  • Improving data inputs can help.
  • Collecting and analyzing forecast error metrics can identify weak spots.

3. Wasting time and money going too far trying to eliminate error.

  • Some product/market combinations are inherently more difficult to forecast. After a point, let them be (but be alert for new specialized forecasting methods).
  • Sometimes steps meant to reduce error can backfire (e.g., adjustment).
Leave a Comment

RECENT POSTS

Why MRO Businesses Need Add-on Service Parts Planning & Inventory Software

Why MRO Businesses Need Add-on Service Parts Planning & Inventory Software

MRO organizations exist in a wide range of industries, including public transit, electrical utilities, wastewater, hydro power, aviation, and mining. To get their work done, MRO professionals use Enterprise Asset Management (EAM) and Enterprise Resource Planning (ERP) systems. These systems are designed to do a lot of jobs. Given their features, cost, and extensive implementation requirements, there is an assumption that EAM and ERP systems can do it all. In this post, we summarize the need for add-on software that addresses specialized analytics for inventory optimization, forecasting, and service parts planning.

Head to Head: Which Service Parts Inventory Policy is Best?

Head to Head: Which Service Parts Inventory Policy is Best?

Our customers have usually settled into one way to manage their service parts inventory. The professor in me would like to think that the chosen inventory policy was a reasoned choice among considered alternatives, but more likely it just sort of happened. Maybe the inventory honcho from long ago had a favorite and that choice stuck. Maybe somebody used an EAM or ERP system that offered only one choice. Perhaps there were some guesses made, based on the conditions at the time.

Leveraging ERP Planning BOMs with Smart IP&O to Forecast the Unforecastable

Leveraging ERP Planning BOMs with Smart IP&O to Forecast the Unforecastable

In a highly configurable manufacturing environment, forecasting finished goods can become a complex and daunting task. The number of possible finished products will skyrocket when many components are interchangeable. A traditional MRP would force us to forecast every single finished product which can be unrealistic or even impossible. Several leading ERP solutions introduce the concept of the “Planning BOM”, which allows the use of forecasts at a higher level in the manufacturing process. In this article, we will discuss this functionality in ERP, and how you can take advantage of it with Smart Inventory Planning and Optimization (Smart IP&O) to get ahead of your demand in the face of this complexity.

Recent Posts

  • Learning from Inventory Models Software AILearning from Inventory Models
    In this video blog, the spotlight is on a critical aspect of inventory management: the analysis and interpretation of inventory data. The focus is specifically on a dataset from a public transit agency detailing spare parts for buses. […]
  • Smart Software is in the process of adapting our products to help you cope with your own irregular opsIrregular Operations
    This blog is about “irregular operations.” Smart Software is in the process of adapting our products to help you cope with your own irregular ops. This is a preview. […]
  • Epicor AI Forecasting and Inventory Technology Combined with Planner Knowledge for InsightsSmart Software to Present at Epicor Insights 2024
    Smart Software will present at this year's Epicor Insights event in Nashville. If you plan to attend this year, please join us at booth #13 or #501, and learn more about Epicor Smart Inventory Planning and Optimization. . […]
  • Looking for Trouble in Your Inventory DataLooking for Trouble in Your Inventory Data
    In this video blog, the spotlight is on a critical aspect of inventory management: the analysis and interpretation of inventory data. The focus is specifically on a dataset from a public transit agency detailing spare parts for buses. […]
  • BAF Case Study SIOP planning Distribution CenterBig Ass Fans Turns to Smart Software as Demand Heats Up
    Big Ass Fans is the best-selling big fan manufacturer in the world, delivering comfort to spaces where comfort seems impossible. BAF had a problem: how to reliably plan production to meet demand. BAF was experiencing a gap between bookings forecasts vs. shipments, and this was impacting revenue and customer satisfaction BAF turned to Smart Software for help. […]

    Inventory Optimization for Manufacturers, Distributors, and MRO

    • Why MRO Businesses Need Add-on Service Parts Planning & Inventory SoftwareWhy MRO Businesses Need Add-on Service Parts Planning & Inventory Software
      MRO organizations exist in a wide range of industries, including public transit, electrical utilities, wastewater, hydro power, aviation, and mining. To get their work done, MRO professionals use Enterprise Asset Management (EAM) and Enterprise Resource Planning (ERP) systems. These systems are designed to do a lot of jobs. Given their features, cost, and extensive implementation requirements, there is an assumption that EAM and ERP systems can do it all. In this post, we summarize the need for add-on software that addresses specialized analytics for inventory optimization, forecasting, and service parts planning. […]
    • Spare-parts-demand-forecasting-a-different-perspective-for-planning-service-partsThe Forecast Matters, but Maybe Not the Way You Think
      True or false: The forecast doesn't matter to spare parts inventory management. At first glance, this statement seems obviously false. After all, forecasts are crucial for planning stock levels, right? It depends on what you mean by a “forecast”. If you mean an old-school single-number forecast (“demand for item CX218b will be 3 units next week and 6 units the week after”), then no. If you broaden the meaning of forecast to include a probability distribution taking account of uncertainties in both demand and supply, then yes. […]
    • Whyt MRO Businesses Should Care about Excess InventoryWhy MRO Businesses Should Care About Excess Inventory
      Do MRO companies genuinely prioritize reducing excess spare parts inventory? From an organizational standpoint, our experience suggests not necessarily. Boardroom discussions typically revolve around expanding fleets, acquiring new customers, meeting service level agreements (SLAs), modernizing infrastructure, and maximizing uptime. In industries where assets supported by spare parts cost hundreds of millions or generate significant revenue (e.g., mining or oil & gas), the value of the inventory just doesn’t raise any eyebrows, and organizations tend to overlook massive amounts of excessive inventory. […]
    • Top Differences between Inventory Planning for Finished Goods and for MRO and Spare PartsTop Differences Between Inventory Planning for Finished Goods and for MRO and Spare Parts
      In today’s competitive business landscape, companies are constantly seeking ways to improve their operational efficiency and drive increased revenue. Optimizing service parts management is an often-overlooked aspect that can have a significant financial impact. Companies can improve overall efficiency and generate significant financial returns by effectively managing spare parts inventory. This article will explore the economic implications of optimized service parts management and how investing in Inventory Optimization and Demand Planning Software can provide a competitive advantage. […]

      Increasing Revenue by Increasing Spare Part Availability

      The Smart Forecaster

       Pursuing best practices in demand planning,

      forecasting and inventory optimization

      Let’s start by recognizing that increased revenue is a good thing for you, and that increasing the availability of the spare parts you provide is a good thing for your customers.

      But let’s also recognize that increasing item availability will not necessarily lead to increased revenue. If you plan incorrectly and end up carrying excess inventory, the net effect may be good for your customers but will definitely be bad for you. There must be some right way to make this a win-win, if only it can be recognized.

      To make the right decision here, you have to think systematically about the problem. That requires that you use probabilistic models of the inventory control process.


      A Scenario

      Let’s consider a specific, realistic scenario. Quite a number of factors have an influence on the results:

      • The item: A specific low-volume spare part.
      • Demand mean: Averaging 0.1 units per day (so, highly “intermittent”)
      • Demand standard deviation: 0.35 units per day (so, highly variable or “overdispersed”).
      • Supplier average lead time: 5 days.
      • Unit cost: $100.
      • Holding cost per year as % of unit cost: 10%.
      • Ordering cost per PO cut: $25.
      • Stockout consequences: Lost sales (so, a competitive market, no backorders).
      • Shortage cost per lost sale: $100.
      • Service level target: 85% (so, 15% chance of a stockout in any replenishment cycle).
      • Inventory control policy: Periodic-review/Order-up-to (also called at (T,S) policy)


      Inventory Control Policy

      A word about the inventory control policy. The (T,S) policy is one of several that are common in practice. Though there are other more efficient policies (e.g., they don’t wait for T days to go by before making adjustment to stock), (T,S) is one of the simplest and so it is quite popular. It works this way: Every T days, you check how many units you have in stock, say X units. Then you order S-X units, which appear after the supplier lead time (in this case, 5 days). The T in (T,S) is the “order interval”, the number of days between orders; the S is the “order-up-to level”, the number of units you want to have on hand at the start of each replenishment cycle.

      To get the most out of this policy, you must wisely pick values of T and S. Picking wisely means you cannot win by guessing or using simple rule-of-thumb guides like “Keep an average of 3 x average demand on hand.”  Poor choices of T and S hurt both your customers and your bottom line. And sticking too long with choices that were once good can result in poor performance should any of the factors above change significantly, so the values of T and S should be recalculated now and then.

      The smart way to pick the right values of T and S is to use probabilistic models encoded in advanced software. Using software is essential when you have to scale up and pick values of T and S that are right for not one item but hundreds or thousands.


      Analysis of Scenario

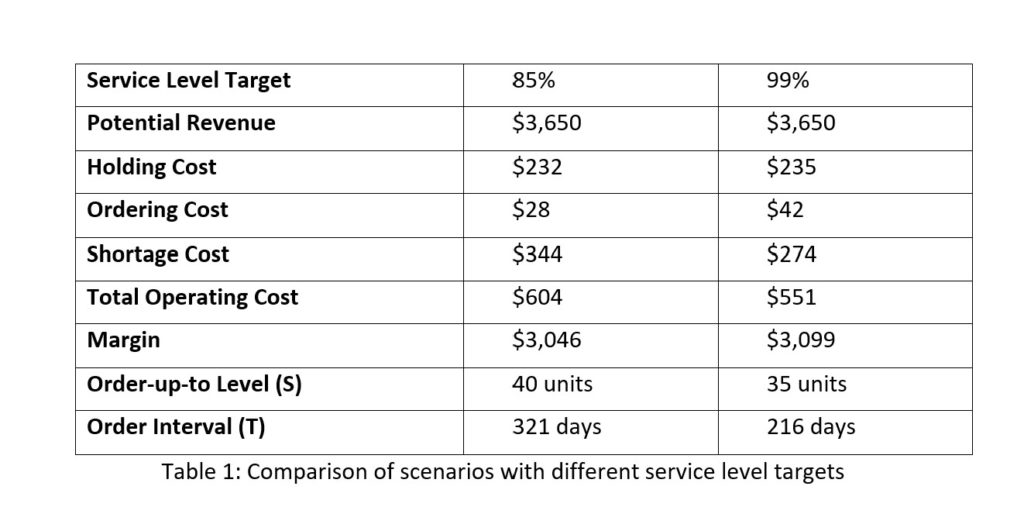
      Let’s think about how to make money in this scenario. What’s the upside? If there were no expenses, this item could generate an average of $3,650 per year: 0.1 units/day x 365 days x $100/unit. Subtracted from that will be operating costs, comprised of holding, ordering and shortage costs. Each of those will depend on your choices of T and S.

      The software provides specific numbers: Setting T = 321 days and S = 40 units will result in average annual operating costs of $604, giving an expected margin of $3,650 – $604 = $3,046. See Table 1, left column. This use of software is called “predictive analytics” because it translates system design inputs into estimates of a key performance indicator, margin.

      Now think about whether you can do better. The service level target in this scenario is 85%, which is a somewhat relaxed standard that is not going to turn any heads. What if you could offer your customers a 99% service level? That sounds like a distinct competitive advantage, but would it reduce your margin? Not if you properly adjust the values of T and S.

      Setting T = 216 days and S = 35 units will reduce average annual operating costs to $551 and increase expected margin to $3,650 – $551 = $3,099. See Table 1, right column. Here is the win-win we wanted: higher customer satisfaction and roughly 2% more revenue. This use of the software is called “sensitivity analysis” because it shows how sensitive the margin is to the choice of service level target.

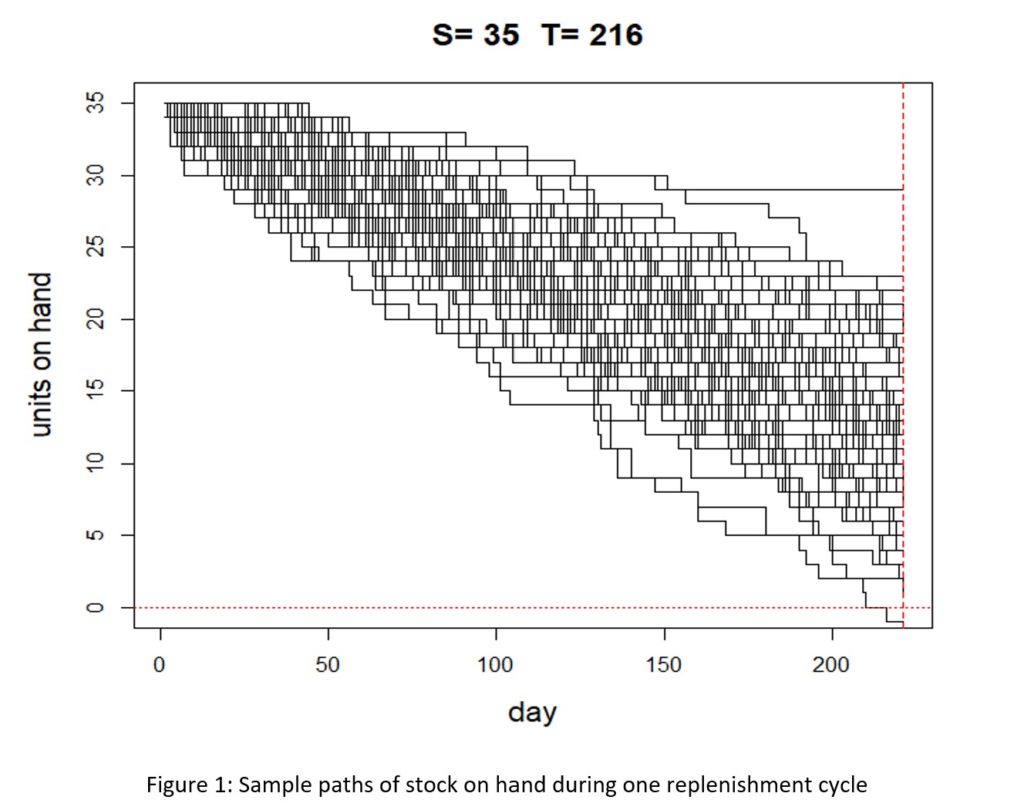
      Software can also help you visualize the complex, random dynamics of inventory movements. A by-product of the analysis that populated Table 1 are graphs showing the random paths taken by stock as it decreases over a replenishment cycle. Figure 1 shows a selection of 100 random scenarios for the scenario in which the service level target is 99%. In the figure, only 1 of the 100 scenarios resulted in a stockout, confirming the accuracy of the choice of order-up-to-level.


      Summary

      Management of spare parts inventories is often done haphazardly using gut instinct, habit, or obsolete rule-of-thumb. Winging it this way is not a reliable and reproducible path to higher margin or higher customer satisfaction. Probability theory, distilled into probability models then encoded in advanced software, is the basis for coherent, efficient guidance about how to manage spare parts based on facts: demand characteristics, lead times, service level targets, costs and the other factors. The scenarios analyzed here illustrate that it is possible to achieve both higher service levels and higher margin. A multitude of scenarios not shown here offer ways to achieve higher service levels but lose margin. Use the software.

      Scenarios with different service level targets

      Stock on hand during one replenishment cycle


      Leave a Comment

      Related Posts

      Confused about AI and Machine Learning?

      Confused about AI and Machine Learning?

      Are you confused about what is AI and what is machine learning? Are you unsure why knowing more will help you with your job in inventory planning? Don’t despair. You’ll be ok, and we’ll show you how some of whatever-it-is can be useful.

      Smart Software Announces Next-Generation Patent

      Smart Software Announces Next-Generation Patent

      Smart Software is pleased to announce the award of US Patent 11,656,887. The patent directs “technical solutions for analyzing historical demand data of resources in a technology platform to facilitate management of an automated process in the platform.

      Do your statistical forecasts suffer from the wiggle effect?

      Do your statistical forecasts suffer from the wiggle effect?

      What is the wiggle effect? It’s when your statistical forecast incorrectly predicts the ups and downs observed in your demand history when there really isn’t a pattern. It’s important to make sure your forecasts don’t wiggle unless there is a real pattern. Here is a transcript from a recent customer where this issue was discussed:

      Recent Posts

      • Learning from Inventory Models Software AILearning from Inventory Models
        In this video blog, the spotlight is on a critical aspect of inventory management: the analysis and interpretation of inventory data. The focus is specifically on a dataset from a public transit agency detailing spare parts for buses. […]
      • Smart Software is in the process of adapting our products to help you cope with your own irregular opsIrregular Operations
        This blog is about “irregular operations.” Smart Software is in the process of adapting our products to help you cope with your own irregular ops. This is a preview. […]
      • Epicor AI Forecasting and Inventory Technology Combined with Planner Knowledge for InsightsSmart Software to Present at Epicor Insights 2024
        Smart Software will present at this year's Epicor Insights event in Nashville. If you plan to attend this year, please join us at booth #13 or #501, and learn more about Epicor Smart Inventory Planning and Optimization. . […]
      • Looking for Trouble in Your Inventory DataLooking for Trouble in Your Inventory Data
        In this video blog, the spotlight is on a critical aspect of inventory management: the analysis and interpretation of inventory data. The focus is specifically on a dataset from a public transit agency detailing spare parts for buses. […]
      • BAF Case Study SIOP planning Distribution CenterBig Ass Fans Turns to Smart Software as Demand Heats Up
        Big Ass Fans is the best-selling big fan manufacturer in the world, delivering comfort to spaces where comfort seems impossible. BAF had a problem: how to reliably plan production to meet demand. BAF was experiencing a gap between bookings forecasts vs. shipments, and this was impacting revenue and customer satisfaction BAF turned to Smart Software for help. […]

        Inventory Optimization for Manufacturers, Distributors, and MRO

        • Why MRO Businesses Need Add-on Service Parts Planning & Inventory SoftwareWhy MRO Businesses Need Add-on Service Parts Planning & Inventory Software
          MRO organizations exist in a wide range of industries, including public transit, electrical utilities, wastewater, hydro power, aviation, and mining. To get their work done, MRO professionals use Enterprise Asset Management (EAM) and Enterprise Resource Planning (ERP) systems. These systems are designed to do a lot of jobs. Given their features, cost, and extensive implementation requirements, there is an assumption that EAM and ERP systems can do it all. In this post, we summarize the need for add-on software that addresses specialized analytics for inventory optimization, forecasting, and service parts planning. […]
        • Spare-parts-demand-forecasting-a-different-perspective-for-planning-service-partsThe Forecast Matters, but Maybe Not the Way You Think
          True or false: The forecast doesn't matter to spare parts inventory management. At first glance, this statement seems obviously false. After all, forecasts are crucial for planning stock levels, right? It depends on what you mean by a “forecast”. If you mean an old-school single-number forecast (“demand for item CX218b will be 3 units next week and 6 units the week after”), then no. If you broaden the meaning of forecast to include a probability distribution taking account of uncertainties in both demand and supply, then yes. […]
        • Whyt MRO Businesses Should Care about Excess InventoryWhy MRO Businesses Should Care About Excess Inventory
          Do MRO companies genuinely prioritize reducing excess spare parts inventory? From an organizational standpoint, our experience suggests not necessarily. Boardroom discussions typically revolve around expanding fleets, acquiring new customers, meeting service level agreements (SLAs), modernizing infrastructure, and maximizing uptime. In industries where assets supported by spare parts cost hundreds of millions or generate significant revenue (e.g., mining or oil & gas), the value of the inventory just doesn’t raise any eyebrows, and organizations tend to overlook massive amounts of excessive inventory. […]
        • Top Differences between Inventory Planning for Finished Goods and for MRO and Spare PartsTop Differences Between Inventory Planning for Finished Goods and for MRO and Spare Parts
          In today’s competitive business landscape, companies are constantly seeking ways to improve their operational efficiency and drive increased revenue. Optimizing service parts management is an often-overlooked aspect that can have a significant financial impact. Companies can improve overall efficiency and generate significant financial returns by effectively managing spare parts inventory. This article will explore the economic implications of optimized service parts management and how investing in Inventory Optimization and Demand Planning Software can provide a competitive advantage. […]

          Four Useful Ways to Measure Forecast Error

          The Smart Forecaster

           Pursuing best practices in demand planning,

          forecasting and inventory optimization

          Improve Forecast Accuracy, Eliminate Excess Inventory, & Maximize Service Levels

          In this video, Dr. Thomas Willemain, co-Founder and SVP Research, talks about improving forecast accuracy by measuring forecast error. We begin by overviewing the various types of error metrics: scale-dependent error, percentage error, relative error, and scale-free error metrics. While some error is inevitable, there are ways to reduce it, and forecast metrics are necessary aids for monitoring and improving forecast accuracy. Then we will explain the special problem of intermittent demand and divide-by-zero problems. Tom concludes by explaining how to assess forecasts of multiple items and how it often makes sense to use weighted averages, weighting items differently by volume or revenue.


          Four general types of error metrics 

          1. Scale-dependent error
          2. Percentage error
          3. Relative error
          4 .Scale-free error

          Remark: Scale-dependent metrics are expressed in the units of the forecasted variable. The other three are expresses as percentages.


          1. Scale-dependent error metrics

          • Mean Absolute Error (MAE) aka Mean Absolute Deviation (MAD)
          • Median Absolute Error (MdAE)
          • Root Mean Square Error (RMSE)
          • These metrics express the error in the original units of the data.
            • Ex: units, cases, barrels, kilograms, dollars, liters, etc.
          • Since forecasts can be too high or too low, the signs of the errors will be either positive or negative, allowing for unwanted cancellations.
            • Ex: You don’t want errors of +50 and -50 to cancel and show “no error”.
          • To deal with the cancellation problem, these metrics take away negative signs by either squaring or using absolute value.


          2. Percentage error metric

          • Mean Absolute Percentage Error (MAPE)
          • This metric expresses the size of the error as a percentage of the actual value of the forecasted variable.
          • The advantage of this approach is that it immediately makes clear whether the error is a big deal or not.
          • Ex: Suppose the MAE is 100 units. Is a typical error of 100 units horrible? ok? great?
          • The answer depends on the size of the variable being forecasted. If the actual value is 100, then a MAE = 100 is as big as the thing being forecasted. But if the actual value is 10,000, then a MAE = 100 shows great accuracy, since the MAPE is only 1% of the actual.


          3. Relative error metric

          • Median Relative Absolute Error (MdRAE)
          • Relative to what? To a benchmark forecast.
          • What benchmark? Usually, the “naïve” forecast.
          • What is the naïve forecast? Next forecast value = last actual value.
          • Why use the naïve forecast? Because if you can’t beat that, you are in tough shape.


          4. Scale-Free error metric

          • Median Relative Scaled Error (MdRSE)
          • This metric expresses the absolute forecast error as a percentage of the natural level of randomness (volatility) in the data.
          • The volatility is measured by the average size of the change in the forecasted variable from one time period to the next.
            • (This is the same as the error made by the naïve forecast.)
          • How does this metric differ from the MdRAE above?
            • They do both use the naïve forecast, but this metric uses errors in forecasting the demand history, while the MdRAE uses errors in forecasting future values.
            • This matters because there are usually many more history values than there are forecasts.
            • In turn, that matters because this metric would “blow up” if all the data were zero, which is less likely when using the demand history.


          Intermittent Demand Planning and Parts Forecasting


          The special problem of intermittent demand

          • “Intermittent” demand has many zero demands mixed in with random non-zero demands.
          • MAPE gets ruined when errors are divided by zero.
          • MdRAE can also get ruined.
          • MdSAE is less likely to get ruined.


          Recap and remarks

          • Forecast metrics are necessary aids for monitoring and improving forecast accuracy.
          • There are two major classes of metrics: absolute and relative.
          • Absolute measures (MAE, MdAE, RMSE) are natural choices when assessing forecasts of one item.
          • Relative measures (MAPE, MdRAE, MdSAE) are useful when comparing accuracy across items or between alternative forecasts of the same item or assessing accuracy relative to the natural variability of an item.
          • Intermittent demand presents divide-by-zero problems which favor MdSAE over MAPE.
          • When assessing forecasts of multiple items, it often makes sense to use weighted averages, weighting items differently by volume or revenue.
          Leave a Comment

          RECENT POSTS

          Why MRO Businesses Need Add-on Service Parts Planning & Inventory Software

          Why MRO Businesses Need Add-on Service Parts Planning & Inventory Software

          MRO organizations exist in a wide range of industries, including public transit, electrical utilities, wastewater, hydro power, aviation, and mining. To get their work done, MRO professionals use Enterprise Asset Management (EAM) and Enterprise Resource Planning (ERP) systems. These systems are designed to do a lot of jobs. Given their features, cost, and extensive implementation requirements, there is an assumption that EAM and ERP systems can do it all. In this post, we summarize the need for add-on software that addresses specialized analytics for inventory optimization, forecasting, and service parts planning.

          Head to Head: Which Service Parts Inventory Policy is Best?

          Head to Head: Which Service Parts Inventory Policy is Best?

          Our customers have usually settled into one way to manage their service parts inventory. The professor in me would like to think that the chosen inventory policy was a reasoned choice among considered alternatives, but more likely it just sort of happened. Maybe the inventory honcho from long ago had a favorite and that choice stuck. Maybe somebody used an EAM or ERP system that offered only one choice. Perhaps there were some guesses made, based on the conditions at the time.

          Leveraging ERP Planning BOMs with Smart IP&O to Forecast the Unforecastable

          Leveraging ERP Planning BOMs with Smart IP&O to Forecast the Unforecastable

          In a highly configurable manufacturing environment, forecasting finished goods can become a complex and daunting task. The number of possible finished products will skyrocket when many components are interchangeable. A traditional MRP would force us to forecast every single finished product which can be unrealistic or even impossible. Several leading ERP solutions introduce the concept of the “Planning BOM”, which allows the use of forecasts at a higher level in the manufacturing process. In this article, we will discuss this functionality in ERP, and how you can take advantage of it with Smart Inventory Planning and Optimization (Smart IP&O) to get ahead of your demand in the face of this complexity.

          Recent Posts

          • Learning from Inventory Models Software AILearning from Inventory Models
            In this video blog, the spotlight is on a critical aspect of inventory management: the analysis and interpretation of inventory data. The focus is specifically on a dataset from a public transit agency detailing spare parts for buses. […]
          • Smart Software is in the process of adapting our products to help you cope with your own irregular opsIrregular Operations
            This blog is about “irregular operations.” Smart Software is in the process of adapting our products to help you cope with your own irregular ops. This is a preview. […]
          • Epicor AI Forecasting and Inventory Technology Combined with Planner Knowledge for InsightsSmart Software to Present at Epicor Insights 2024
            Smart Software will present at this year's Epicor Insights event in Nashville. If you plan to attend this year, please join us at booth #13 or #501, and learn more about Epicor Smart Inventory Planning and Optimization. . […]
          • Looking for Trouble in Your Inventory DataLooking for Trouble in Your Inventory Data
            In this video blog, the spotlight is on a critical aspect of inventory management: the analysis and interpretation of inventory data. The focus is specifically on a dataset from a public transit agency detailing spare parts for buses. […]
          • BAF Case Study SIOP planning Distribution CenterBig Ass Fans Turns to Smart Software as Demand Heats Up
            Big Ass Fans is the best-selling big fan manufacturer in the world, delivering comfort to spaces where comfort seems impossible. BAF had a problem: how to reliably plan production to meet demand. BAF was experiencing a gap between bookings forecasts vs. shipments, and this was impacting revenue and customer satisfaction BAF turned to Smart Software for help. […]

            Inventory Optimization for Manufacturers, Distributors, and MRO

            • Why MRO Businesses Need Add-on Service Parts Planning & Inventory SoftwareWhy MRO Businesses Need Add-on Service Parts Planning & Inventory Software
              MRO organizations exist in a wide range of industries, including public transit, electrical utilities, wastewater, hydro power, aviation, and mining. To get their work done, MRO professionals use Enterprise Asset Management (EAM) and Enterprise Resource Planning (ERP) systems. These systems are designed to do a lot of jobs. Given their features, cost, and extensive implementation requirements, there is an assumption that EAM and ERP systems can do it all. In this post, we summarize the need for add-on software that addresses specialized analytics for inventory optimization, forecasting, and service parts planning. […]
            • Spare-parts-demand-forecasting-a-different-perspective-for-planning-service-partsThe Forecast Matters, but Maybe Not the Way You Think
              True or false: The forecast doesn't matter to spare parts inventory management. At first glance, this statement seems obviously false. After all, forecasts are crucial for planning stock levels, right? It depends on what you mean by a “forecast”. If you mean an old-school single-number forecast (“demand for item CX218b will be 3 units next week and 6 units the week after”), then no. If you broaden the meaning of forecast to include a probability distribution taking account of uncertainties in both demand and supply, then yes. […]
            • Whyt MRO Businesses Should Care about Excess InventoryWhy MRO Businesses Should Care About Excess Inventory
              Do MRO companies genuinely prioritize reducing excess spare parts inventory? From an organizational standpoint, our experience suggests not necessarily. Boardroom discussions typically revolve around expanding fleets, acquiring new customers, meeting service level agreements (SLAs), modernizing infrastructure, and maximizing uptime. In industries where assets supported by spare parts cost hundreds of millions or generate significant revenue (e.g., mining or oil & gas), the value of the inventory just doesn’t raise any eyebrows, and organizations tend to overlook massive amounts of excessive inventory. […]
            • Top Differences between Inventory Planning for Finished Goods and for MRO and Spare PartsTop Differences Between Inventory Planning for Finished Goods and for MRO and Spare Parts
              In today’s competitive business landscape, companies are constantly seeking ways to improve their operational efficiency and drive increased revenue. Optimizing service parts management is an often-overlooked aspect that can have a significant financial impact. Companies can improve overall efficiency and generate significant financial returns by effectively managing spare parts inventory. This article will explore the economic implications of optimized service parts management and how investing in Inventory Optimization and Demand Planning Software can provide a competitive advantage. […]