In a previous post, I discussed one of the thornier problems demand planners sometimes face: working with product demand data characterized by what statisticians call skewness — a situation that can necessitate costly inventory investments. This sort of problematic data is found in several different scenarios. In at least one, the combination of intermittent demand and very effective sales promotions, the problem lends itself to an effective solution.
Reviewing terms, recall that “service level” is the probability of not stocking out while waiting for a replenishment order to arrive, while “fill rate” is the percentage of demand that is satisfied immediately from stock. In my previous post, “The Scourge of Skewness”, I pointed out that a certain type of demand distribution, having a “long right tail”, will lead to fill rates that can be much lower than service levels. I also pointed out that sometimes the only way to improve the fill rate is to increase the target service level to an unusually high level, which can be expensive.
In this post, I’ll look at solving the problem in one special case: skewness resulting from effective sales promotions mixed with “intermittent demand”. Intermittent demand has a large proportion of zero values, with nonzero values mixed in at random. Successful sales promotions, obviously positive, have a downside: they can confuse the “demand signal” with spikes in your demand history, and can undermine forecasts and bias safety stock calculations. When intermittent demand and effective sales promotions are the source of your data’s skewness, methods exist to work around the problem to achieve both higher fill rates and more accurate demand forecasts.
How Promotions Increase Skewness
Successful promotions abruptly increase item demand. This creates anomalies, or “outliers”, which contribute to forming a skewed distribution. Knowing when promotions occurred in the past, we can adjust an item’s record of past demand. We produce an alternate demand history as if there had been no promotions, by replacing the outliers with values more representative of the “natural” level of demand. These adjustments reduce demand skewness. Reduced skewness can lead to significant reductions in both expected forecasts and safety stocks, which add together to form reorder points.
Successful promotions are likely to be repeated. When that happens, the promotion effects can be added in to demand forecasts to increase their accuracy. The effect of future promotions on inventory management will be to increase the risk of stockouts, so a sensible response is to work at the operational level to build up temporary supply, in a quantity keyed to the estimated impact of prior promotions on the effected items.
Using Event Modeling to Improve Demand Forecasting
It’s possible to model the impact of like events, and apply this to planned events in the future. Doing so can improve your forecast in two big ways: by projecting the demand jolt you expect from a planned event; and rationalizing the spikes in the past that were caused by events, making your baseline activity more visible and more accurately forecastable. We do a lot of this in SmartForecasts, so allow me to use our experience there to show you what I mean.
Event Modeling entails the following steps:
• Automatically estimating the impact of previous promotions (which is a useful result in itself).
• Adjusting historical demand to statistically remove the effect of promotions.
• Creating promotion-free forecasts.
• Revising the forecasts for any future time periods in which promotions are planned.
We call this this type of analysis “Promo forecasting”. We use the word “promotions” to describe what you do yourself to improve your results. We use “events” to describe what the world does to you, usually to your detriment; examples include strikes, power outages, warehouse fires and other unlucky happenings.
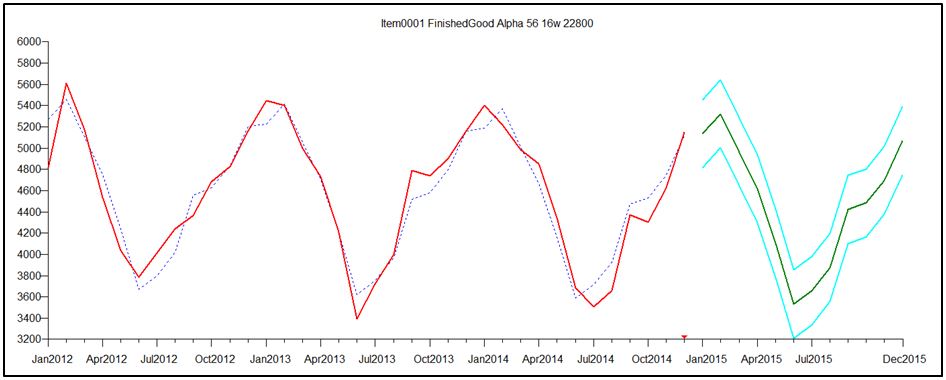
To understand how Event Modeling can help you cope with skewness when doing demand forecasting for high-volume items, consider Figures 1-3.
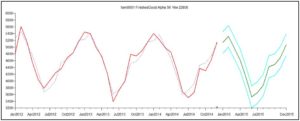
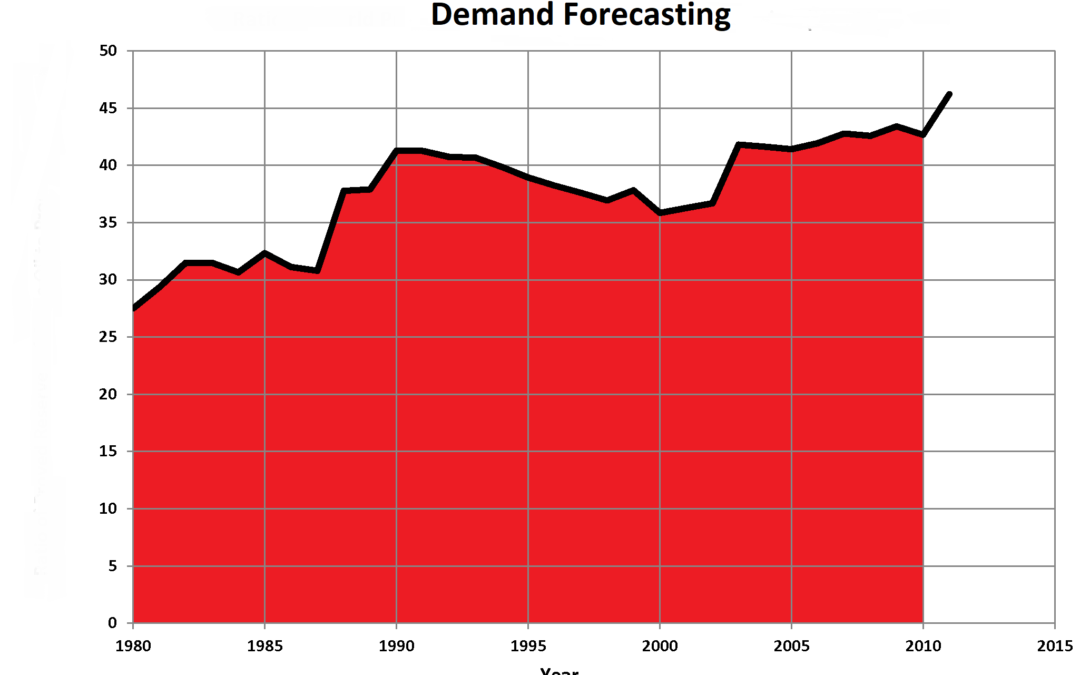
Figure 1 shows that this item’s demand pattern is clearly seasonal, and the forecast is both seasonal and “tight”, meaning that the forecast uncertainty interval (“margin of error”, shown in cyan lines) is very narrow.
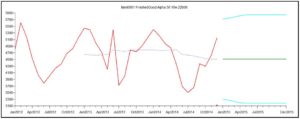
Figure 2 shows an alternative history in which a promotion in June 2014 reversed the usual seasonal low associated with June sales. This demand pattern was forecasted using the Automatic forecasting tournament in SmartForecasts, as in Figure 1. This time, the promotion scrambled the seasonal pattern enough to create an inappropriate non-seasonal forecast, and one that has a much larger margin of error.
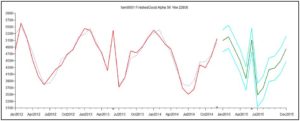
Finally, Figure 3 shows how Promo forecasting handles the same promoted scenario, retaining a seasonal forecast and building into the forecast an estimate of the effect of a planned repeat promotion in 2015.
The Case of Intermittent Demand
In Figure 1, the item was a high-volume finished good and the task was demand forecasting. Promo modeling is also useful when dealing with the task of setting safety stocks and reorder points for items with intermittent demand, whether the items are finished goods, components or spare parts. Intermittent demand very often has a skewed distribution that makes it difficult to achieve high item availability with a small investment in inventory.
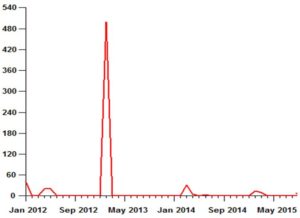
Figure 4 illustrates the problem that a successful promotion can accidentally create for inventory management. If such a spike arises from the natural, un-promoted demand, then the only way to maintain high fill rates is to provide safety stocks large enough to cope with these random surges. In this case, the big spike in demand of 500 units in February 2013 was the result of a one-time promotion.
Taking Account of Promotions to Improve Inventory Management
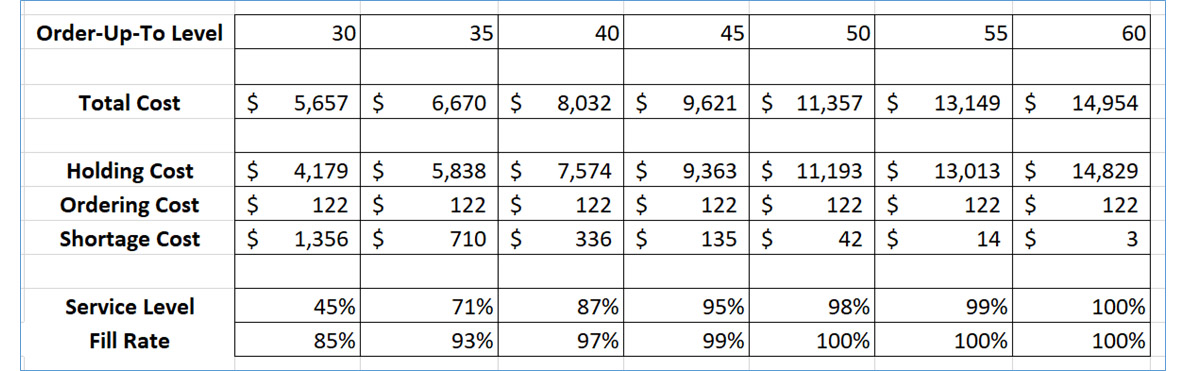
Unwittingly treating the spike in the example above as part of the natural demand variability results in a poor fill rate. To achieve a target service level of, say, 95% with a lead time of one month would require a reorder point of 38 units, computed as the sum of an expected forecast over the one month replenishment lead time of 21 units supplemented by a safety stock of 17 units. This investment would result in a disappointing fill rate of only 36%.
However, recognizing that the spike is a one-time promotion and replacing the 500 units with 0 obviously would make a big difference. The reorder point would drop from 38 units to 31 (the sum of an expected demand of 7 units and a safety stock of 24 units) and the fill rate would increase to 94%.
Of course, it is not ok to just throw out inconvenient demand spikes whenever they make life uncomfortable; there has to be a valid “business story” behind the adjustment of historical demand. If the spike is the result of a data processing error, then by all means, fix it. If the spike coincides with a promotion, then replacing the spike with, say, the median demand (often zero, as in this example) will result in a much more sustainable inventory investment that still meets aggressive performance targets. Future promotions of the same type on the same item will require some extra effort to prepare for the temporary surge in demand, but the recommended reorder point will be correct in the long run.
Thomas Willemain, PhD, co-founded Smart Software and currently serves as Senior Vice President for Research. Dr. Willemain also serves as Professor Emeritus of Industrial and Systems Engineering at Rensselear Polytechnic Institute and as a member of the research staff at the Center for Computing Sciences, Institute for Defense Analyses.

Related Posts

Reveal Your Real Inventory Planning and Forecasting Policy by Answering These 10 Questions
In this blog, we review 10 specific questions you can ask to uncover what’s really happening with the inventory planning and demand forecasting policy at your company. We detail the typical answers provided when a forecasting/inventory planning policy doesn’t really exist, explain how to interpret these answers, and offer some clear advice on what to do about it.
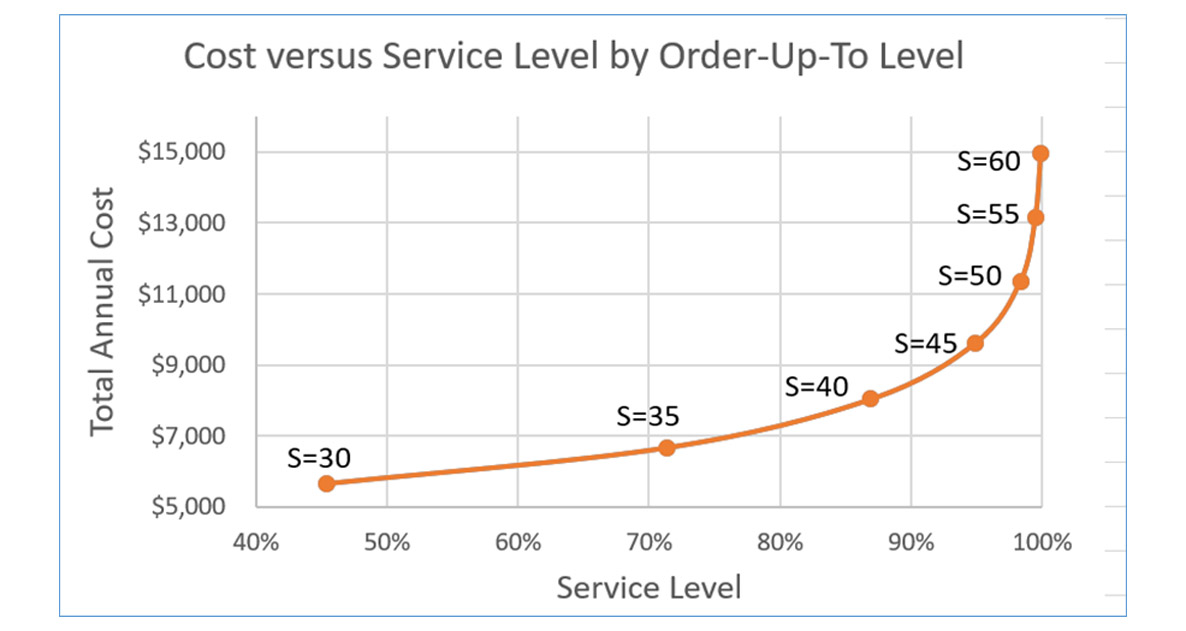
Riding the Tradeoff Curve
In the supply chain planning world, the most fundamental decision is how to balance item availability against the cost of maintaining that availability (service levels and fill rates). At one extreme, you can grossly overstock and never run out until you go broke and have to close up shop from sinking all your cash into inventory that doesn’t sell.

Quantum Inventory Theory?
Physics at the quantum level is quite weird – not at all like what we experience in our usual macroscopic life. Among the oddities are “superposition”, “entanglement”, and “quantum foam.” Weird as these phenomena are, I cannot help seeing analogs in the supposedly different world of supply chain management.
Recent Posts
 Managing Spare Parts Inventory: Best PracticesIn this blog, we’ll explore several effective strategies for managing spare parts inventory, emphasizing the importance of optimizing stock levels, maintaining service levels, and using smart tools to aid in decision-making. Managing spare parts inventory is a critical component for businesses that depend on equipment uptime and service reliability. Unlike regular inventory items, spare parts often have unpredictable demand patterns, making them more challenging to manage effectively. An efficient spare parts inventory management system helps prevent stockouts that can lead to operational downtime and costly delays while also avoiding overstocking that unnecessarily ties up capital and increases holding costs. […]
 5 Ways to Improve Supply Chain Decision SpeedThe promise of a digital supply chain has transformed how businesses operate. At its core, it can make rapid, data-driven decisions while ensuring quality and efficiency throughout operations. However, it's not just about having access to more data. Organizations need the right tools and platforms to turn that data into actionable insights. This is where decision-making becomes critical, especially in a landscape where new digital supply chain solutions and AI-driven platforms can support you in streamlining many processes within the decision matrix. […]
 12 Causes of Overstocking and Practical SolutionsManaging inventory effectively is critical for maintaining a healthy balance sheet and ensuring that resources are optimally allocated. Here is an in-depth exploration of the main causes of overstocking, their implications, and possible solutions. […]
 FAQ: Mastering Smart IP&O for Better Inventory Management.Effective supply chain and inventory management are essential for achieving operational efficiency and customer satisfaction. This blog provides clear and concise answers to some basic and other common questions from our Smart IP&O customers, offering practical insights to overcome typical challenges and enhance your inventory management practices. Focusing on these key areas, we help you transform complex inventory issues into strategic, manageable actions that reduce costs and improve overall performance with Smart IP&O. […]
 7 Key Demand Planning Trends Shaping the FutureDemand planning goes beyond simply forecasting product needs; it's about ensuring your business meets customer demands with precision, efficiency, and cost-effectiveness. Latest demand planning technology addresses key challenges like forecast accuracy, inventory management, and market responsiveness. In this blog, we will introduce critical demand planning trends, including data-driven insights, probabilistic forecasting, consensus planning, predictive analytics, scenario modeling, real-time visibility, and multilevel forecasting. These trends will help you stay ahead of the curve, optimize your supply chain, reduce costs, and enhance customer satisfaction, positioning your business for long-term success. […]

Inventory Optimization for Manufacturers, Distributors, and MRO
- Managing Spare Parts Inventory: Best PracticesIn this blog, we’ll explore several effective strategies for managing spare parts inventory, emphasizing the importance of optimizing stock levels, maintaining service levels, and using smart tools to aid in decision-making. Managing spare parts inventory is a critical component for businesses that depend on equipment uptime and service reliability. Unlike regular inventory items, spare parts often have unpredictable demand patterns, making them more challenging to manage effectively. An efficient spare parts inventory management system helps prevent stockouts that can lead to operational downtime and costly delays while also avoiding overstocking that unnecessarily ties up capital and increases holding costs. […]
 Innovating the OEM Aftermarket with AI-Driven Inventory OptimizationThe aftermarket sector provides OEMs with a decisive advantage by offering a steady revenue stream and fostering customer loyalty through the reliable and timely delivery of service parts. However, managing inventory and forecasting demand in the aftermarket is fraught with challenges, including unpredictable demand patterns, vast product ranges, and the necessity for quick turnarounds. Traditional methods often fall short due to the complexity and variability of demand in the aftermarket. The latest technologies can analyze large datasets to predict future demand more accurately and optimize inventory levels, leading to better service and lower costs. […]
 Future-Proofing Utilities: Advanced Analytics for Supply Chain OptimizationUtilities in the electrical, natural gas, urban water, and telecommunications fields are all asset-intensive and reliant on physical infrastructure that must be properly maintained, updated, and upgraded over time. Maximizing asset uptime and the reliability of physical infrastructure demands effective inventory management, spare parts forecasting, and supplier management. A utility that executes these processes effectively will outperform its peers, provide better returns for its investors and higher service levels for its customers, while reducing its environmental impact. […]
 Centering Act: Spare Parts Timing, Pricing, and ReliabilityIn this article, we'll walk you through the process of crafting a spare parts inventory plan that prioritizes availability metrics such as service levels and fill rates while ensuring cost efficiency. We'll focus on an approach to inventory planning called Service Level-Driven Inventory Optimization. Next, we'll discuss how to determine what parts you should include in your inventory and those that might not be necessary. Lastly, we'll explore ways to enhance your service-level-driven inventory plan consistently. […]