7 Digital Transformations for Utilities that will Boost MRO Performance

Utilities in the electrical, natural gas, urban water and wastewater, and telecommunications fields are all asset intensive. Generation, production, processing, transmission, and distribution of electricity, natural gas, oil, and water, are all reliant on physical infrastructure that must be properly maintained, updated, and upgraded over time. Maximizing asset uptime and the reliability of physical infrastructure demands effective inventory management, spare parts forecasting, and supplier management.

A utility that executes these processes effectively will outperform its peers, provide better returns for its investors and higher service levels for its customers, while reducing its environmental impact. Impeding these efforts are out-of-date IT systems, evolving security threats, frequent supply chain disruptions, and extreme demand variability.  However, the convergence of these challenges with mature cloud technology and recent advancements in data analytics, probabilistic forecasting, and technologies for data management, present utilities a generational opportunity to digitally transform their enterprise.

Here are seven digital transformations that require relatively small upfront investments but will generate seven-figure returns.

1. Inventory Management is the first step in MRO inventory optimization. It involves analyzing current inventory levels and usage patterns to identify opportunities for improvement. This should include looking for overstocked, understocked, or obsolete items.  New probabilistic forecasting technology will help by simulating future parts usage and predicting how current stocking policies will perform.  Pats planners can use the simulation results to proactively identify where policies should be modified.

2. Accurate forecasting and demand planning are very important in optimizing MRO service parts inventories. An accurate demand forecast is a critical supply chain driver. By understanding demand patterns that result from capital projects and planned and unplanned maintenance, parts planners can more accurately anticipate future inventory needs, budget properly, and better communicate anticipated demand to suppliers. Parts forecasting software can be used to automatically house an accurate set of historical usage that details planned vs. unplanned parts demand.

3. Managing suppliers and lead times are important components of MRO inventory optimization. It involves selecting the best vendors for the job, having backup suppliers that can deliver quickly if the preferred supplier fails, and negotiating favorable terms.  Identifying the right lead time to base stocking policies on is another important component. Probabilistic simulations available in parts planning software can be used to forecast the probability for each possible lead time that will be faced. This will result in a more accurate recommendation of what to stock compared to using a supplier quoted or average lead time.

4. SKU rationalization and master data management removes ineffective or out-of-date SKUs from the product catalog and ERP database. It also identifies different part numbers that have been used for the same SKU. The operating cost and profitability of each product are assessed during this procedure, resulting in a common list of active SKUs.  Master data management software can assess product catalogs and information stored in disparate data bases to identify SKU rationalizations ensuring that inventory policies are based on the common part number.

5.  Inventory control systems are key to synchronizing inventory optimization.    They provide a cost-efficient way for utilities to track, monitor, and manage their inventory. They helps ensure that the utility has the right supplies and materials when and where needed while minimizing inventory costs.

6. Continuous improvement is essential for optimizing MRO inventories. It involves regularly monitoring and adjusting inventory levels and stocking policies to ensure the most efficient use of resources. When operating conditions change, the utility must detect the change and adjust its operations accordingly. This means planning cycles must operate at a tempo high enough to stay up with changing conditions. Leveraging probabilistic forecasting to recalibrate service parts stocking policies each planning cycle ensures that stocking policies (such as min/max levels) are always up-to-date and reflect the latest parts usage and supplier lead times.

7. Planning for intermittent demand with modern Spare Parts Planning Software.  The result is a highly accurate estimate of safety stocks, reorder points, and order quantities, leading to higher service levels and lower inventory costs.   Smart Software’s patented probabilistic spare parts forecasting software simulates the probability for each possible demand, accurately determining how much to stock to achieve a utility’s targeted service levels.  Leveraging software to accurately simulate the inflow and outflow of repairable spare parts will better predict downtime, service levels, and inventory costs associated with any chosen pool size for repairable spares.


Spare Parts Planning Software solutions

Smart IP&O’s service parts forecasting software uses a unique empirical probabilistic forecasting approach that is engineered for intermittent demand. For consumable spare parts, our patented and APICS award winning method rapidly generates tens of thousands of demand scenarios without relying on the assumptions about the nature of demand distributions implicit in traditional forecasting methods. The result is highly accurate estimates of safety stock, reorder points, and service levels, which leads to higher service levels and lower inventory costs. For repairable spare parts, Smart’s Repair and Return Module accurately simulates the processes of part breakdown and repair. It predicts downtime, service levels, and inventory costs associated with the current rotating spare parts pool. Planners will know how many spares to stock to achieve short- and long-term service level requirements and, in operational settings, whether to wait for repairs to be completed and returned to service or to purchase additional service spares from suppliers, avoiding unnecessary buying and equipment downtime.

Contact us to learn more how this functionality has helped our customers in the MRO, Field Service, Utility, Mining, and Public Transportation sectors to optimize their inventory. You can also download the Whitepaper here.


White Paper: What you Need to know about Forecasting and Planning Service Parts


This paper describes Smart Software’s patented methodology for forecasting demand, safety stocks, and reorder points on items such as service parts and components with intermittent demand, and provides several examples of customer success.


    6 Do’s and Don’ts for Spare Parts Planning

    Managing spare parts inventories can feel impossible. You don’t know what will break and when. Feedback from mechanical departments and maintenance teams is often inaccurate. Planned maintenance schedules are often shifted around, making them anything but “planned.”   Usage (i.e., demand) patterns are most often extremely intermittent, i.e., demand jumps randomly between zero and something else, often a surprisingly big number. Intermittency, combined with the lack of significant trend or seasonal patterns, render traditional time-series forecasting methods inaccurate. The large number of part-by-locations combinations makes it impossible to manually create or even review forecasts for individual parts.   Given all these challenges, we thought it would be helpful to outline a number of do’s (and their associated don’ts).

    1. Do use probabilistic methods to compute a reorder points and Min/Max levels
      Basing stocking decisions on average daily usage isn’t the right answer. Nor is reliance on traditional forecasting methods like exponential smoothing models. Neither approach works when demand is intermittent because they don’t take proper account of demand volatility. Probabilistic methods that simulate thousands of possible demand scenarios work best. They provide a realistic estimate of the demand distribution and can handle all the zeros and random non-zeros. This will ensure the inventory level is right-sized to hit whatever service level target you choose.
       
    2. Do use service levels instead of rule-of-thumb methods to determine stocking levels
      Many parts planning organizations rely on multiples of daily demand and other rules of thumb to determine stocking policies. For example, reorder points are often based on doubling average demand over the lead time or applying some other multiple depending on the importance of the item. However, averages don’t account for how volatile (or noisy) a part is and will lead to overstocking less noisy parts and understocking more noisy parts.
       
    3. Do frequently recompute stocking policies
      Just because demand is intermittent doesn’t mean nothing changes over time. Yet after interviewing hundreds of companies managing spare parts inventory, we find that fewer than 10% recompute stocking policies monthly. Many never recompute stocking policies until there is a “problem.” Across thousands of parts, usage is guaranteed to drift up or down on at least some of the parts. Supplier lead times can also change. Using an outdated reorder point will cause orders to trigger too soon or too late, creating lots of problems. Recomputing policies every planning cycle ensures inventory will be right-sized. Don’t be reactive and wait for a problem to occur before considering whether the Min or Max should be modified. By then it’s too late – it’s like waiting for your brakes to fail before making a repair. Don’t worry about the effort of recomputing Min/Max values for large numbers of SKU’s: modern software does it automatically. Remember: Recalibration of your stocking policies is preventive maintenance against stockout!
       
    4. Do get buy-in on targeted service levels
      Inventory is expensive and should be right-sized based on striking a balance between the organization’s willingness to stock out and its willingness to budget for spares. Too often, planners make decisions in isolation based on pain avoidance or maintenance technicians’ requests without consideration of how spending on one part impacts the organization’s ability to spend on another part. Excess inventory on one part hurts service levels on other parts by disproportionally consuming the inventory budget. Make sure that service level goals and associated inventory costs of achieving the service levels are understood and agreed to.
       
    5. Do run a separate planning process for repairable parts
      Some parts are very expensive to replace, so it is preferable to send them to repair facilities or back to the OEM for repair. Accounting for the supply side randomness of when repairable parts will be returned, and knowing whether to wait for a repair or to purchase an additional spare, are critical to ensuring item availability without inventory bloat. This requires specialized reporting and the use of probabilistic models.  Don’t treat repairable parts like consumable parts when planning.
       
    6. Do count what is purchased against the budget – not just what is consumed
      Many organizations will allocate total part purchases to a separate corporate budget and ding the mechanical or maintenance team’s budget for parts that are used. In most MRO organizations, especially in public transit and utilities, the repair teams dictate what is purchased. If what is purchased doesn’t count against their budget, they will over-buy to ensure there is never any chance of stockout. They have literally zero incentive to get it right, so tens of millions in excess inventory will be purchased. If what is purchased is reflected in the budget, far more attention will be paid to purchasing only what is truly needed. Recognizing that excess inventory hurts service by robbing the organization of cash that could otherwise be used on understocked parts is an important step to ensuring responsible inventory purchasing.

    Spare Parts Planning Software solutions

    Smart IP&O’s service parts forecasting software uses a unique empirical probabilistic forecasting approach that is engineered for intermittent demand. For consumable spare parts, our patented and APICS award winning method rapidly generates tens of thousands of demand scenarios without relying on the assumptions about the nature of demand distributions implicit in traditional forecasting methods. The result is highly accurate estimates of safety stock, reorder points, and service levels, which leads to higher service levels and lower inventory costs. For repairable spare parts, Smart’s Repair and Return Module accurately simulates the processes of part breakdown and repair. It predicts downtime, service levels, and inventory costs associated with the current rotating spare parts pool. Planners will know how many spares to stock to achieve short- and long-term service level requirements and, in operational settings, whether to wait for repairs to be completed and returned to service or to purchase additional service spares from suppliers, avoiding unnecessary buying and equipment downtime.

    Contact us to learn more how this functionality has helped our customers in the MRO, Field Service, Utility, Mining, and Public Transportation sectors to optimize their inventory. You can also download the Whitepaper here.


    White Paper: What you Need to know about Forecasting and Planning Service Parts


    This paper describes Smart Software’s patented methodology for forecasting demand, safety stocks, and reorder points on items such as service parts and components with intermittent demand, and provides several examples of customer success.


      Probabilistic Forecasting for Intermittent Demand

      The Smart Forecaster

        Pursuing best practices in demand planning,

      forecasting and inventory optimization

      Intermittent, lumpy or uneven demand —particularly for low-demand items like service and spare parts — is especially difficult to predict with any accuracy. Smart Software’s proprietary probabilistic forecasting dramatically improves service level accuracy.  If any of these scenarios apply to your company then probabilistic forecasting will help improve your bottom line.

      • Do you have intermittent or lumpy demand with large, infrequent spikes that are many times the average demand?
      • Is it hard to obtain business information about when demand is likely to spike again?
      • Do you miss out on business opportunities because you can’t accurately forecast demand and estimate inventory requirements for certain unpredictable products?
      • Are you required to hold inventory on many items even if they are infrequently demanded in order to differentiate vs. the competition by providing high service levels?
      • Do you have to make unnecessarily large investments in inventory to cover unexpected orders and materials requirements?
      • Do you have to deliver to customers right away despite long supplier lead times?

      If you’ve answered yes to some or all of the questions above, you aren’t alone. Intermittent demand —also known as irregular, sporadic, lumpy, or slow-moving demand — affects industries of all types and sizes: capital goods and equipment sectors, automotive, aviation, public transit, industrial tools, specialty chemicals, utilities and high tech, to name just a few. And it makes demand forecasting and planning extremely difficult. It can be much more than a headache; it can be a multi-million-dollar problem, especially for MRO businesses and others who manage and distribute spare and service parts.

      Identifying intermittent demand data isn’t hard. It typically contains a large percentage of zero values, with non-zero values mixed in randomly. But few forecasting solutions have yielded satisfactory results even in this era of Big Data Analysis, Predictive Analytics, Machine Learning, and Artificial Intelligence.


      DOWNLOAD THE ARTICLE

      Traditional Approaches and their Reliance on an Assumed Demand Distribution

      Traditional statistical forecasting methods, like exponential smoothing and moving averages, work well when product demand data is normal, or smooth, but it doesn’t give accurate results with intermittent data. Many automated forecasting tools fail because they work by identifying patterns in demand history data, such as trend and seasonality. But with intermittent demand data, patterns are especially difficult to recognize. These methods also tend to ignore the special role of zero values in analyzing and forecasting demand.Even so, some conventional statistical forecasting methods can produce credible forecasts of the average demand per period.  However, when demand is intermittent, a forecast of the average demand is not nearly sufficient for inventory planning.  Accurate estimates of the entire distribution (i.e., complete set) of all possible lead-time demand values is needed. Without this, these methods produce misleading inputs to inventory control models — with costly consequences.

      Collague with gears ans statistical forecast modeling


      To produce reorder points, order-up-to levels, and safety stocks for inventory planning, many forecasting approaches rely on assumptions about the demand and lead time distribution.  Some assume that the probability distribution of total demand for a particular product item over a lead time (lead-time demand) will resemble a normal, classic bell-shaped curve. Other approaches might rely on a Poisson distribution or some other textbook distribution.  With intermittent demand, a one-sized fits all approach is problematic because the actual distribution will often not match the assumed distribution.  When this occurs, estimates of the buffer stock will be wrong.  This is especially the case when managing spare parts (Table 1).

      For each intermittently demanded item, the importance of having an accurate forecast of the entire distribution of all possible lead time demand values — not just one number representing the average or most likely demand per period — cannot be overstated. These forecasts are key inputs to the inventory control models that recommend correct procedures for the timing and size of replenishment orders (reorder points and order quantities). They are particularly essential in spare parts environments, where they are needed to accurately estimate customer service level inventory requirements (e.g., a 95 or 99 percent likelihood of not stocking out of an item) for satisfying total demand over a lead time.  Inventory planning departments must be confident that when they target a desired service level that they will achieve that target.  If the forecasting model consistently yields a different service level than targeted, inventory will be mismanaged and confidence in the system will erode.

      Faced with this challenge, many organizations rely on applying rule of thumb based approaches to determine stocking levels or will apply judgmental adjustments to their statistical forecasts, which they hope will more accurately predict future activity based on past business experience. But there are several problems with these approaches, as well.

      Rule of thumb approaches ignore variability in demand and lead time. They also do not update for changes in demand patterns and don’t provide critical trade-off information about the relationship between service levels and inventory costs.

      Judgmental forecasting is not feasible when dealing with large numbers (thousands and tens of thousands) of items. Furthermore, most judgmental forecasts provide a single-number estimate instead of a forecast of the full distribution of lead-time demand values. Finally, it is easy to inadvertently but incorrectly predict a downward (or upward) trend in demand, based on expectations, resulting in understocking (or over-stocking) inventory.


      How does Probabilistic Demand Forecasting Work in Practice?

      Although the full architecture of this technology includes additional proprietary features, a simple example of the approach demonstrates the usefulness of the technique. See Table 1.

      intermittently demanded product items spreedsheet

      Table 1. Monthly demand values for a service part item.

      The 24 monthly demand values for a service part itemare typical of intermittent demand. Let’s say you need forecasts of total demand for this item over the next three months because your parts supplier needs three months to fill an order to replenish inventory. The probabilistic approach is to sample from the 24 monthly values, with replacement, three times, creating a scenario of total demand over the three-month lead time.

      How does the new method of forecasting intermittent demand work

      Figure 1. The results of 25,000 scenarios.


      You might randomly select months 6, 12 and 4, which gives you demand values of 0, 6 and 3, respectively, for a total lead-time demand (in units) of 0 + 6 + 3 = 9. You then repeat this process, perhaps randomly selecting months 19, 8 and 14, which gives a lead-time demand of 0 + 32 + 0 = 32 units. Continuing this process, you can build a statistically rigorous picture of the entire distribution of possible lead-time demand values for this item. Figure 1 shows the results of 25,000 such scenarios, indicating (in this example) that the most likely value for lead-time demand is zero but that lead-time demand could be as great as 70 or more units. It also reflects the real-life possibility that nonzero demand values for the part item occurring in the future could differ from those that have occurred in the past.

      With the high-speed computational resources available in the cloud today, probabilistic forecasting methods can provide fast and realistic forecasts of total lead-time demand for thousands or tens of thousands of intermittently demanded product items. These forecasts can then be entered directly into inventory control models to insure that enough inventory is available to satisfy customer demand. This also ensures that no more inventory than necessary is maintained, minimizing costs.


      A Field Proven Method That Works

      Customers that have implemented the technology have found that it increases customer service level accuracy and significantly reduces inventory costs.

      Warehouse or storage getting inventory optimization

      A nationwide hardware retailer’s warehousing operation forecasted inventory requirements for 12,000 intermittently demanded SKUs at 95 and 99 percent service levels. The forecast results were almost 100 percent accurate. At the 95 percent service level, 95.23 percent of the items did not stock out (95 percent would have been perfect). At the 99 percent service level, 98.66 percent of the items did not stock out (99 percent would have been perfect).

      The aircraft maintenance operation of a global company got similar service level forecasting results with 6,000 SKUs. Potential annual savings in inventory carrying costs were estimated at $3 million. The aftermarket business unit of an automotive industry supplier, two-thirds of whose 7,000 SKUs demonstrate highly intermittent demand, also projected $3 million in annual cost savings.

      That the challenge of forecasting intermittent product demand has indeed been met is good news for manufacturers, distributors, and spare parts/MRO businesses.  With cloud computing, Smart Software’s field-proven probabilistic method is now accessible to the non-statistician and can be applied at scale to tens of thousands of parts.  Demand data that was once un-forecastable no longer poses an obstacle to achieving the highest customer service levels with the lowest possible investment in inventory.


      Hand placing pieces to build an arrow

      DOWNLOAD THE ARTICLE

      Leave a Comment

      Related Posts

      The Next Frontier in Supply Chain Analytics

      The Next Frontier in Supply Chain Analytics

      We believe the leading edge of supply chain analytics to be the development of digital twins of inventory systems. These twins take the form of discrete event models that use Monte Carlo simulation to generate and optimize over the full range of operational risks. We also assert that we and our colleagues at Smart Software have played an outsized role in forging that leading edge.

      Overcoming Uncertainty with Service and Inventory Optimization Technology

      Overcoming Uncertainty with Service and Inventory Optimization Technology

      In this blog, we will discuss today’s fast-paced and unpredictable market and the constant challenges businesses face in managing their inventory and service levels efficiently. The main subject of this discussion, rooted in the concept of “Probabilistic Inventory Optimization,” focuses on how modern technology can be leveraged to achieve optimal service and inventory targets amidst uncertainty. This approach not only addresses traditional inventory management issues but also offers a strategic edge in navigating the complexities of demand fluctuations and supply chain disruptions.

      Centering Act: Spare Parts Timing, Pricing, and Reliability

      Centering Act: Spare Parts Timing, Pricing, and Reliability

      In this article, we’ll walk you through the process of crafting a spare parts inventory plan that prioritizes availability metrics such as service levels and fill rates while ensuring cost efficiency. We’ll focus on an approach to inventory planning called Service Level-Driven Inventory Optimization. Next, we’ll discuss how to determine what parts you should include in your inventory and those that might not be necessary. Lastly, we’ll explore ways to enhance your service-level-driven inventory plan consistently.

      Recent Posts

      • Managing Spare Parts Inventory: Best PracticesManaging Spare Parts Inventory: Best Practices
        In this blog, we’ll explore several effective strategies for managing spare parts inventory, emphasizing the importance of optimizing stock levels, maintaining service levels, and using smart tools to aid in decision-making. Managing spare parts inventory is a critical component for businesses that depend on equipment uptime and service reliability. Unlike regular inventory items, spare parts often have unpredictable demand patterns, making them more challenging to manage effectively. An efficient spare parts inventory management system helps prevent stockouts that can lead to operational downtime and costly delays while also avoiding overstocking that unnecessarily ties up capital and increases holding costs. […]
      • 5 Ways to Improve Supply Chain Decision Speed5 Ways to Improve Supply Chain Decision Speed
        The promise of a digital supply chain has transformed how businesses operate. At its core, it can make rapid, data-driven decisions while ensuring quality and efficiency throughout operations. However, it's not just about having access to more data. Organizations need the right tools and platforms to turn that data into actionable insights. This is where decision-making becomes critical, especially in a landscape where new digital supply chain solutions and AI-driven platforms can support you in streamlining many processes within the decision matrix. […]
      • Two employees checking inventory in temporary storage in a distribution warehouse.12 Causes of Overstocking and Practical Solutions
        Managing inventory effectively is critical for maintaining a healthy balance sheet and ensuring that resources are optimally allocated. Here is an in-depth exploration of the main causes of overstocking, their implications, and possible solutions. […]
      • FAQ Mastering Smart IP&O for Better Inventory ManagementFAQ: Mastering Smart IP&O for Better Inventory Management.
        Effective supply chain and inventory management are essential for achieving operational efficiency and customer satisfaction. This blog provides clear and concise answers to some basic and other common questions from our Smart IP&O customers, offering practical insights to overcome typical challenges and enhance your inventory management practices. Focusing on these key areas, we help you transform complex inventory issues into strategic, manageable actions that reduce costs and improve overall performance with Smart IP&O. […]
      • 7 Key Demand Planning Trends Shaping the Future7 Key Demand Planning Trends Shaping the Future
        Demand planning goes beyond simply forecasting product needs; it's about ensuring your business meets customer demands with precision, efficiency, and cost-effectiveness. Latest demand planning technology addresses key challenges like forecast accuracy, inventory management, and market responsiveness. In this blog, we will introduce critical demand planning trends, including data-driven insights, probabilistic forecasting, consensus planning, predictive analytics, scenario modeling, real-time visibility, and multilevel forecasting. These trends will help you stay ahead of the curve, optimize your supply chain, reduce costs, and enhance customer satisfaction, positioning your business for long-term success. […]

        Inventory Optimization for Manufacturers, Distributors, and MRO

        • Managing Spare Parts Inventory: Best PracticesManaging Spare Parts Inventory: Best Practices
          In this blog, we’ll explore several effective strategies for managing spare parts inventory, emphasizing the importance of optimizing stock levels, maintaining service levels, and using smart tools to aid in decision-making. Managing spare parts inventory is a critical component for businesses that depend on equipment uptime and service reliability. Unlike regular inventory items, spare parts often have unpredictable demand patterns, making them more challenging to manage effectively. An efficient spare parts inventory management system helps prevent stockouts that can lead to operational downtime and costly delays while also avoiding overstocking that unnecessarily ties up capital and increases holding costs. […]
        • Innovating the OEM Aftermarket with AI-Driven Inventory Optimization XLInnovating the OEM Aftermarket with AI-Driven Inventory Optimization
          The aftermarket sector provides OEMs with a decisive advantage by offering a steady revenue stream and fostering customer loyalty through the reliable and timely delivery of service parts. However, managing inventory and forecasting demand in the aftermarket is fraught with challenges, including unpredictable demand patterns, vast product ranges, and the necessity for quick turnarounds. Traditional methods often fall short due to the complexity and variability of demand in the aftermarket. The latest technologies can analyze large datasets to predict future demand more accurately and optimize inventory levels, leading to better service and lower costs. […]
        • Future-Proofing Utilities. Advanced Analytics for Supply Chain OptimizationFuture-Proofing Utilities: Advanced Analytics for Supply Chain Optimization
          Utilities in the electrical, natural gas, urban water, and telecommunications fields are all asset-intensive and reliant on physical infrastructure that must be properly maintained, updated, and upgraded over time. Maximizing asset uptime and the reliability of physical infrastructure demands effective inventory management, spare parts forecasting, and supplier management. A utility that executes these processes effectively will outperform its peers, provide better returns for its investors and higher service levels for its customers, while reducing its environmental impact. […]
        • Centering Act Spare Parts Timing Pricing and ReliabilityCentering Act: Spare Parts Timing, Pricing, and Reliability
          In this article, we'll walk you through the process of crafting a spare parts inventory plan that prioritizes availability metrics such as service levels and fill rates while ensuring cost efficiency. We'll focus on an approach to inventory planning called Service Level-Driven Inventory Optimization. Next, we'll discuss how to determine what parts you should include in your inventory and those that might not be necessary. Lastly, we'll explore ways to enhance your service-level-driven inventory plan consistently. […]

          Service Parts Planning: Planning for consumable parts vs. Repairable Parts

          When deciding on the right stocking parameters for spare parts and service parts, it is important to distinguish between consumable and repairable service parts.  These differences are often overlooked by service parts planning software and can result in incorrect estimates of what to stock.  Different approaches are required when planning for consumables vs. repairable spare parts.

          First, let’s define these two types of spare parts.

          • Consumable parts are spares contained within the equipment which are replaced rather than repaired when they fail. Examples of consumable parts include batteries, oil filters, screws, and brake pads.  Consumable spare parts tend to be lower-cost parts for which replacement is cheaper than repair or repair may not be possible.
          • Repairable parts are parts that are capable of being repaired and returned to service after failing due to causes like wear and tear, damage, or corrosion. Repairable service parts tend to be more expensive than consumable parts, so repair is usually preferable to replacement. Examples of repairable parts include traction motors in rail cars, jet engines, and copy machines.

          Traditional spare parts planning software fail to do the job

          Traditional parts planning software is not well-adapted to deal with the randomness in both the demand side and the supply side of MRO operations.

          Demand-Side Randomness
          Planning for consumable spare parts requires calculation of inventory control parameters (such as reorder points and order quantities, min and max levels, and safety stocks). Planning to manage repairable service parts requires calculation of the right number of spares. In both cases, the analysis must be based on probability models of the random usage of consumables or the random breakdown of repairable parts.  For over 90% of these parts, this random demand is “intermittent” (sometimes called “lumpy” or “anything but normally distributed”). Traditional spare parts forecasting methods were not developed to deal with intermittent demand. Relying on traditional methods leads to costly planning mistakes. For consumables, this means avoidable stockouts, excess carrying costs, and increased inventory obsolescence. For repairable parts, this means excessive equipment downtime and the attendant costs from unreliable performance and disruption of operations.

          Supply-Side Randomness
          Planning for consumable spare parts must take account of randomness in replenishment lead times from suppliers. Planning for repairable parts must account for randomness in repair and return processes, whether provided internally or contracted out. Planners managing these items often ignore exploitable company data. Instead, they may cross their fingers and hope everything works out, or they may call on gut instinct to “call audibles” and then hope everything works out.  Hoping and guessing cannot beat proper probability modeling. It wastes millions annually in unneeded capital investments and avoidable equipment downtime.

          Spare Parts Planning Software solutions

          Smart IP&O’s service parts forecasting software uses a unique empirical probabilistic forecasting approach that is engineered for intermittent demand. For consumable spare parts, our patented and APICS award winning method rapidly generates tens of thousands of demand scenarios without relying on the assumptions about the nature of demand distributions implicit in traditional forecasting methods. The result is highly accurate estimates of safety stock, reorder points, and service levels, which leads to higher service levels and lower inventory costs. For repairable spare parts, Smart’s Repair and Return Module accurately simulates the processes of part breakdown and repair. It predicts downtime, service levels, and inventory costs associated with the current rotating spare parts pool. Planners will know how many spares to stock to achieve short- and long-term service level requirements and, in operational settings, whether to wait for repairs to be completed and returned to service or to purchase additional service spares from suppliers, avoiding unnecessary buying and equipment downtime.

          Contact us to learn more how this functionality has helped our customers in the MRO, Field Service, Utility, Mining, and Public Transportation sectors to optimize their inventory. You can also download the Whitepaper here.


          White Paper: What you Need to know about Forecasting and Planning Service Parts

            This paper describes Smart Software’s patented methodology for forecasting demand, safety stocks, and reorder points on items such as service parts and components with intermittent demand, and provides several examples of customer success.  

            A Beginner’s Guide to Downtime and What to Do about It

            This blog provides an overview of this topic written for non-experts. It

            • explains why you might want to read this blog.
            • lists the various types of “machine maintenance.”
            • explains what “probabilistic modeling” is.
            • describes models for predicting downtime.
            • explains what these models can do for you.

            Importance of Downtime

            If you manufacture things for sale, you need machines to make those things. If your machines are up and running, you have a fighting chance to make money. If your machines are down, you lose opportunities to make money. Since downtime is so fundamental, it is worth some investment of money and thought to minimize downtime. By thought I mean probability math, since machine downtime is inherently a random phenomenon. Probability models can guide maintenance policies.

            Machine Maintenance Policies

            Maintenance is your defense against downtime. There are multiple types of maintenance policies, ranging from “Do nothing and wait for failure” to sophisticated analytic approaches involving sensors and probability models of failure.

            A useful list of maintenance policies is:

            • Sitting back and wait for trouble, then sitting around some more wondering what to do when trouble inevitably happens. This is as foolish as it sounds.
            • Same as above except you prepare for the failure to minimize downtime, e.g., stockpiling spare parts.
            • Periodically checking for impending trouble coupled with interventions such as lubricating moving parts or replacing worn parts.
            • Basing the timing of maintenance on data about machine condition rather than relying on a fixed schedule; requires ongoing data collection and analysis. This is called condition-based maintenance.
            • Using data on machine condition more aggressively by converting it into predictions of failure time and suggestions for steps to take to delay failure. This is called predictive maintenance.

            The last three types of maintenance rely on probability math to establish a maintenance schedule, or determine when data on machine condition call for intervention, or calculate when failure might occur and how best to postpone it.


            Probability Models of Machine Failure

            How long a machine will run before it fails is a random variable. So is the time it will spend down. Probability theory is the part of math that deals with random variables. Random variables are described by their probability distributions, e.g., what is the chance that the machine will run for 100 hours before it goes down? 200 hours? Or, equivalently, what is the chance that the machine is still working after 100 hours or 200 hours?

            A sub-field called “reliability theory” answers this type of question and addresses related concepts like Mean Time Before Failure (MTBF), which is a shorthand summary of the information encoded in the probability distribution of time before failure.

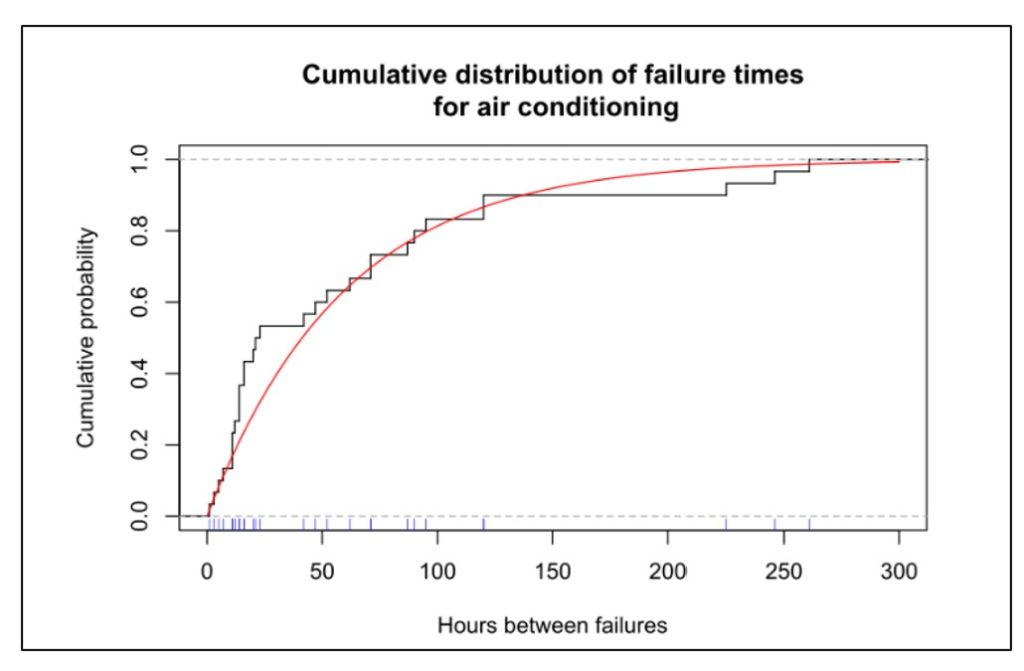
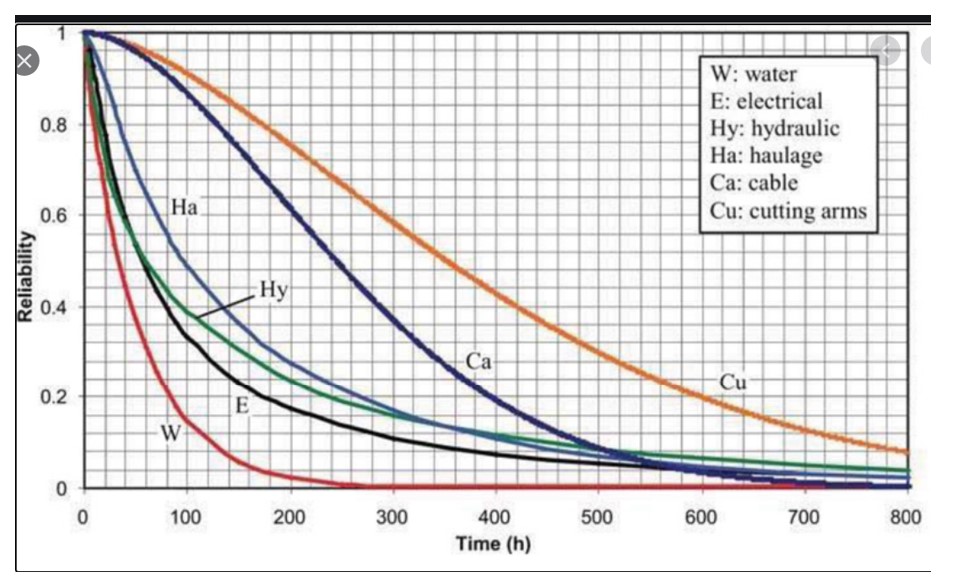
            Figures 1 shows data on the time before failure of air conditioning units. This type of plot depicts the cumulative probability distribution and shows the chance that a unit will have failed after some amount of time has elapsed. Figure 2 shows a reliability function, plotting the same type of information in an inverse format, i.e., depicting the chance that a unit is still functioning after some amount of time has elapsed.

            In Figure 1, the blue tick marks next to the x-axis show the times at which individual air conditioners were observed to fail; this is the basic data. The black curve shows the cumulative proportion of units failed over time. The red curve is a mathematical approximation to the black curve – in this case an exponential distribution. The plots show that about 80 percent of the units will fail before 100 hours of operation.

            Figure 1 Cumulative distribution function of uptime for air conditioners

            Figure 1 Cumulative distribution function of uptime for air conditioners


            Probability models can be applied to an individual part or component or subsystem, to a collection of related parts (e.g., “the hydraulic system”), or to an entire machine. Any of these can be described by the probability distribution of the time before they fail.

            Figure 2 shows the reliability function of six subsystems in a machine for digging tunnels. The plot shows that the most reliable subsystem is the cutting arms and the least reliable is the water subsystem. The reliability of the entire system could be approximated by multiplying all six curves (because for the system as a whole to work, every subsystem must be functioning), which would result in a very short interval before something goes wrong.

            Figure 2 Examples of probability distributions of subsystems in a tunneling machine

            Figure 2 Examples of probability distributions of subsystems in a tunneling machine


            Various factors influence the distribution of the time before failure. Investing in better parts will prolong system life. So will investing in redundancy. So will replacing used pars with new.

            Once a probability distribution is available, it can be used to answer any number of what-if questions, as illustrated below in the section on Benefits of Models.


            Approaches to Modeling Machine Reliability

            Probability models can describe either the most basic units, such as individual system components (Figure 2), or collections of basic units, such as entire machines (Figure 1). In fact, an entire machine can be modeled either as a single unit or as a collection of components. If treating an entire machine as a single unit, the probability distribution of lifetime represents a summary of the combined effect of the lifetime distributions of each component.

            If we have a model of an entire machine, we can jump to models of collections of machines. If instead we start with models of the lifetimes of individual components, then we must somehow combine those individual models into an overall model of the entire machine.

            This is where the math can get hairy. Modeling always requires a wise balance between simplification, so that some results are possible, and complication, so that whatever results emerge are realistic. The usual trick is to assume that failures of the individual pieces of the system occur independently.

            If we can assume failures occur independently, it is usually possible to model collections of machines. For instance, suppose a production line has four machines churning out the same product. Having a reliability model for a single machine (as in Figure 1) lets us predict, for instance, the chance that only three of the machines will still be working one week from now. Even here there can be a complication: the chance that a machine working today will still be working tomorrow often depends on how long it has been since its last failure. If the time between failures has an exponential distribution like the one in Figure 1, then it turns out that the time of the next failure doesn’t depend on how long it has been since the last failure. Unfortunately, many or even most systems do not have exponential distributions of uptime, so the complication remains.

            Even worse, if we start with models of many individual component reliabilities, working our way up to predicting failure times for the entire complex machine may be nearly impossible if we try to work with all the relevant equations directly. In such cases, the only practical way to get results is to use another style of modeling: Monte Carlo simulation.

            Monte Carlo simulation is a way to substitute computation for analysis when it is possible to create random scenarios of system operation. Using simulation to extrapolate machine reliability from component reliabilities works as follows.

            1. Start with the cumulative distribution functions (Figure 1) or reliability functions (Figure 2) of each machine component.
            2. Create a random sample from each component lifetime to get a set of sample failure times consistent with its reliability function.
            3. Using the logic of how components are related to one another, compute the failure time of the entire machine.
            4. Repeat steps 1-3 many times to see the full range of possible machine lifetimes.
            5. Optionally, average the results of step 4 to summarize the machine lifetime with such metrics such as the MTBF or the chance that the machine will run more than 500 hours before failing.

            Step 1 would be a bit complicated if we do not have a nice probability model for a component lifetime, e.g., something like the red line in Figure 1.

            Step 2 can require some careful bookkeeping. As time moves forward in the simulation, some components will fail and be replaced while others will keep grinding on. Unless a component’s lifetime has an exponential distribution, its remaining lifetime will depend on how long the component has been in continual use. So this step must account for the phenomena of burn in or wear out.

            Step 3 is different from the others in that it does require some background math, though of a simple type. If Machine A only works when both components 1 and 2 are working, then (assuming failure of one component does not influence failure of the other)

            Probability [A works] = Probability [1 works] x Probability [2 works].

            If instead Machine A works if either component 1 works or component 2 works or both work, then

            Probability [A fails] = Probability [1 fails] x Probability [2 fails]

            so Probability [A works] = 1 – Probability [A fails].

            Step 4 can involve creation of thousands of scenarios to show the full range of random outcomes. Computation is fast and cheap.

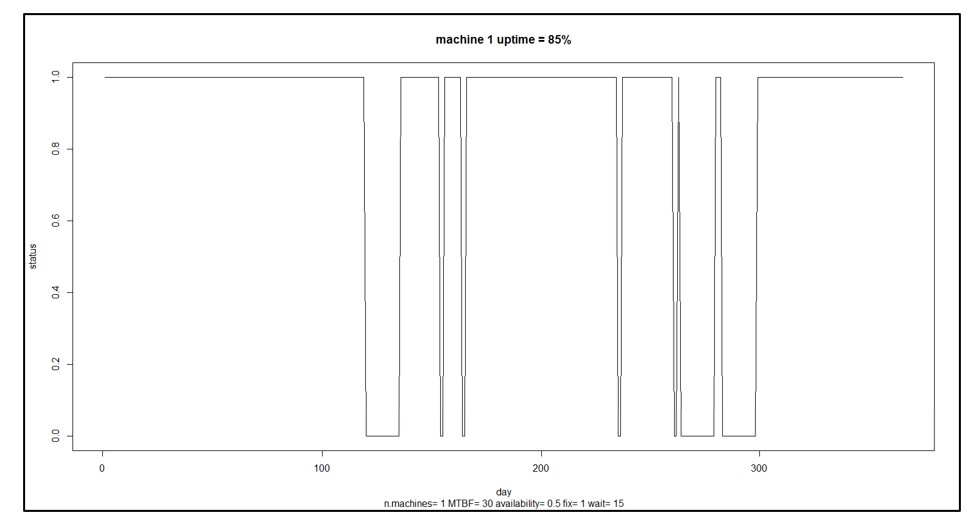
            Step 5 can vary depending on the user’s goals. Computing the MTBF is standard. Choose others to suit the problem. Besides the summary statistics provided by step 5, individual simulation runs can be plotted to build intuition about the random dynamics of machine uptime and downtime. Figure 3 shows an example for a single machine showing alternating cycles of uptime and downtime resulting in 85% uptime.

            Figure 3 A sample scenario for a single machine

            Figure 3 A sample scenario for a single machine


            Benefits of Machine Reliability Models

            In Figure 3, the machine is up and running 85% of the time. That may not be good enough. You may have some ideas about how to improve the machine’s reliability, e.g., maybe you can improve the reliability of component 3 by buying a newer, better version from a different supplier. How much would that help? That is hard to guess: component 3 may only one of several and perhaps not the weakest link, and how much the change pays off depends on how much better the new one would be. Maybe you should develop a specification for component 3 that you can then shop to potential suppliers, but how long does component 3 have to last to have a material impact on the machine’s MTBF?

            This is where having a model pays off. Without a model, you’re relying on guesswork. With a model, you can turn speculation about what-if situations into accurate estimates. For instance, you could analyze how a 10% increase in MTBF for component 3 would translate into an improvement in MTBF for the entire machine.

            As another example, suppose you have seven machines producing an important product. You calculate that you must dedicate six of the seven to fill a major order from your one big customer, leaving one machine to handle demand from a number of miscellaneous small customers and to serve as a spare. A reliability model for each machine could be used to estimate the probabilities of various contingencies: all seven machines work and life is good; six machines work so you can at least keep your key customer happy; only five machines work so you have to negotiate something with your key customer, etc.

            In sum, probability models of machine or component failure can provide the basis for converting failure time data into smart business decisions.


            Read more about  Maximize Machine Uptime with Probabilistic Modeling


            Read more about   Probabilistic forecasting for intermittent demand


            Leave a Comment
            Related Posts
            The Next Frontier in Supply Chain Analytics

            The Next Frontier in Supply Chain Analytics

            We believe the leading edge of supply chain analytics to be the development of digital twins of inventory systems. These twins take the form of discrete event models that use Monte Carlo simulation to generate and optimize over the full range of operational risks. We also assert that we and our colleagues at Smart Software have played an outsized role in forging that leading edge.

            Overcoming Uncertainty with Service and Inventory Optimization Technology

            Overcoming Uncertainty with Service and Inventory Optimization Technology

            In this blog, we will discuss today’s fast-paced and unpredictable market and the constant challenges businesses face in managing their inventory and service levels efficiently. The main subject of this discussion, rooted in the concept of “Probabilistic Inventory Optimization,” focuses on how modern technology can be leveraged to achieve optimal service and inventory targets amidst uncertainty. This approach not only addresses traditional inventory management issues but also offers a strategic edge in navigating the complexities of demand fluctuations and supply chain disruptions.

            Centering Act: Spare Parts Timing, Pricing, and Reliability

            Centering Act: Spare Parts Timing, Pricing, and Reliability

            In this article, we’ll walk you through the process of crafting a spare parts inventory plan that prioritizes availability metrics such as service levels and fill rates while ensuring cost efficiency. We’ll focus on an approach to inventory planning called Service Level-Driven Inventory Optimization. Next, we’ll discuss how to determine what parts you should include in your inventory and those that might not be necessary. Lastly, we’ll explore ways to enhance your service-level-driven inventory plan consistently.

            Thoughts on Spare Parts Planning for Public Transit

            The Covid19 pandemic has placed unusual stress on public transit agencies. This stress forces agencies to look again at their spare parts planning processes, which is a key driver up ensuring uptime and balancing service parts inventory costs.

            This blog focuses on bus systems and their practices for spare parts management and planning. However, there are lessons here for other types of public transit, including rail and light rail.

            Back in 1995, the Transportation Research Board (TRB) of the National Research Council published a report that still has relevance. System-Specific Spare Bus Ratios: A Synthesis of Transit Practice stated

            The purpose of this study was to document and examine the critical site-specific variables that affect the number of spare vehicles that bus systems need to maintain maximum service requirements. … Although transit managers generally acknowledged that right-sizing the fleet actually improves operations and lowers cost, many reported difficulties in achieving and consistently maintaining a 20 percent spare ratio as recommended by FTA… The respondents to the survey advocated that more emphasis be placed on developing improved and innovative bus maintenance techniques, which would assist them in minimizing downtime and improving vehicle availability, ultimately leading to reduced spare vehicles and labor and material costs.

            Grossly simplified guidelines like “keep 20% spare buses” are easy to understand and measure but grossly mask more detailed tactics that can provide more tailored policies that better steward taxpayer dollars spent on spare parts while ensuring the highest levels of availability. If operational reliability can be improved for each bus, then fewer spares are needed.

            One way to keep each bus up and running more often is to improve the management of inventories of spare parts – specifically by forecasting service parts usage and the required replenishment policies more accurately. Here is where modern supply chain management can make a significant contribution. The TRB noted this in their report:

            Many agencies have been successful in limiting reliance on excess spare vehicles. Those transit officials agree that several factors and initiatives have led to their success and are critical to the success of any program [including] … Effective use of advanced technology to manage critical maintenance functions, including the orderly and timely replacement of parts… Failure to have available service parts and other components when they are needed will adversely affect any maintenance program.

            As long as managers are cognizant of the issues and vigilant about what tools are available to them, the probability of buses [being] ‘out for no stock’ will greatly diminish.”

            Effective spare parts inventory management requires a balance between “having enough” and “having too much.” What modern service parts planning software can do is make visible the tradeoff between these two goals so that transit managers can make fact-based decisions about spare parts inventories.

            There are enough complications in finding the right balance to require moving beyond simple rules of thumb such as “keep ten days’ worth of demand on hand” or “reorder when you are down to five units in stock.” Factors that drive these decisions include both the average demand for a part, the volatility of that demand, the average replenishment lead time (which can be a problem when the part arrives by slow boat from Germany), the variability in lead time, and several cost factors: holding costs, ordering costs, and shortage costs (e.g., lost fares, loss of public goodwill).

            Innovative supply chain analytics and spare parts planning software uses advanced probabilistic forecasting and stochastic optimization methods to manage these complexities and provide greater parts availability at lower cost. For instance, Minnesota’s Metro Transit documented a 4x increase in return on investment in the first six months of implementing a new system. To read more about how public transit agencies are exploiting innovative supply chain analytics, see:


            Leave a Comment
            Related Posts
            The Next Frontier in Supply Chain Analytics

            The Next Frontier in Supply Chain Analytics

            We believe the leading edge of supply chain analytics to be the development of digital twins of inventory systems. These twins take the form of discrete event models that use Monte Carlo simulation to generate and optimize over the full range of operational risks. We also assert that we and our colleagues at Smart Software have played an outsized role in forging that leading edge.

            Overcoming Uncertainty with Service and Inventory Optimization Technology

            Overcoming Uncertainty with Service and Inventory Optimization Technology

            In this blog, we will discuss today’s fast-paced and unpredictable market and the constant challenges businesses face in managing their inventory and service levels efficiently. The main subject of this discussion, rooted in the concept of “Probabilistic Inventory Optimization,” focuses on how modern technology can be leveraged to achieve optimal service and inventory targets amidst uncertainty. This approach not only addresses traditional inventory management issues but also offers a strategic edge in navigating the complexities of demand fluctuations and supply chain disruptions.

            Centering Act: Spare Parts Timing, Pricing, and Reliability

            Centering Act: Spare Parts Timing, Pricing, and Reliability

            In this article, we’ll walk you through the process of crafting a spare parts inventory plan that prioritizes availability metrics such as service levels and fill rates while ensuring cost efficiency. We’ll focus on an approach to inventory planning called Service Level-Driven Inventory Optimization. Next, we’ll discuss how to determine what parts you should include in your inventory and those that might not be necessary. Lastly, we’ll explore ways to enhance your service-level-driven inventory plan consistently.