An inventory professional who is responsible for 10,000 items has 10,000 things to stress over every day. Double that for someone responsible for 20,000 items.
In the crush of business, routine decisions often take second place to fire-fighting: dealing with supplier hiccups, straightening out paperwork mistakes, recovering from that collision between a truck and the loading dock.
In the meantime, however, your company’s accumulated inventory control policies keep on doing what they do, even if they are leaking money. A good manager will make time to listen to the “background noise” even when he or she hears loud crashing in the warehouse.
Consider the current settings for your inventory control parameters (e.g., reorder points and order quantities). It’s easy to think of these as “fire and forget” decisions. But these settings usually accumulate over time and end up comprising a mish-mash of forgotten judgement calls that may be misaligned with your current operating environment. Many factors can drift away from their previous levels, such as supplier lead times, ordering costs, or average item demand. These changes can force invisible tradeoffs that are not to your best advantage.
It’s wise to revisit these control settings now and then to see if it’s possible to align your day-to-day operations with current realities. Of course, it would be infeasible for a busy manager to manually calculate the effects of changing the control settings on, say, 10,000 items. But that’s what modern inventory optimization and demand planning software is for: making large scale analytical tasks feasible. Such software will allow you to automatically process new information and compute adjustments at scale. The result will be easy wins – many of which would otherwise go unrealized. And continuously saving a little here and there adds up to significant dollars when you are managing thousands of items.
Consider this example. Company A uses a periodic review inventory system. Every 30 days, they check on-hand inventory for all their items and decide how much replenishment stock to order. Each of their 10,000 items has a specified Order-Up-To Level that determines the size of their replenishment orders.
For instance, suppose Item 1234 has an Order-Up-To Level of 74, determined by factoring in the average item demand of 1.0 units per day, an average replenishment lead time of 8 days, and a target fill rate of 90% for this item. The choice of 74 as the Order-Up-To Level lets Company A meet its 90% fill rate target for Item 1234, but it also results in an average on hand inventory level of 40 units. At $1,500 per unit, this item alone represents $45,000 of inventory investment.
Now supposed that average item demand were to drift up from 1.0 to 1.2 units/day. Without anyone noticing, the fill rate for Item 1234 would drop to 82%!
Now suppose demand were to shift in the other direction and drift down to 0.8 units/day. As with the increase in average demand from 1.0 to 1.2 units/day, this kind of change is difficult to see when looking at a plot (see Figure 1) but can have a significant operational impact. In this case, the fill rate would zoom to a generous 96% but on hand inventory would also zoom: from 40 units to 46. Those six extra units would represent $9,000 in excess inventory.
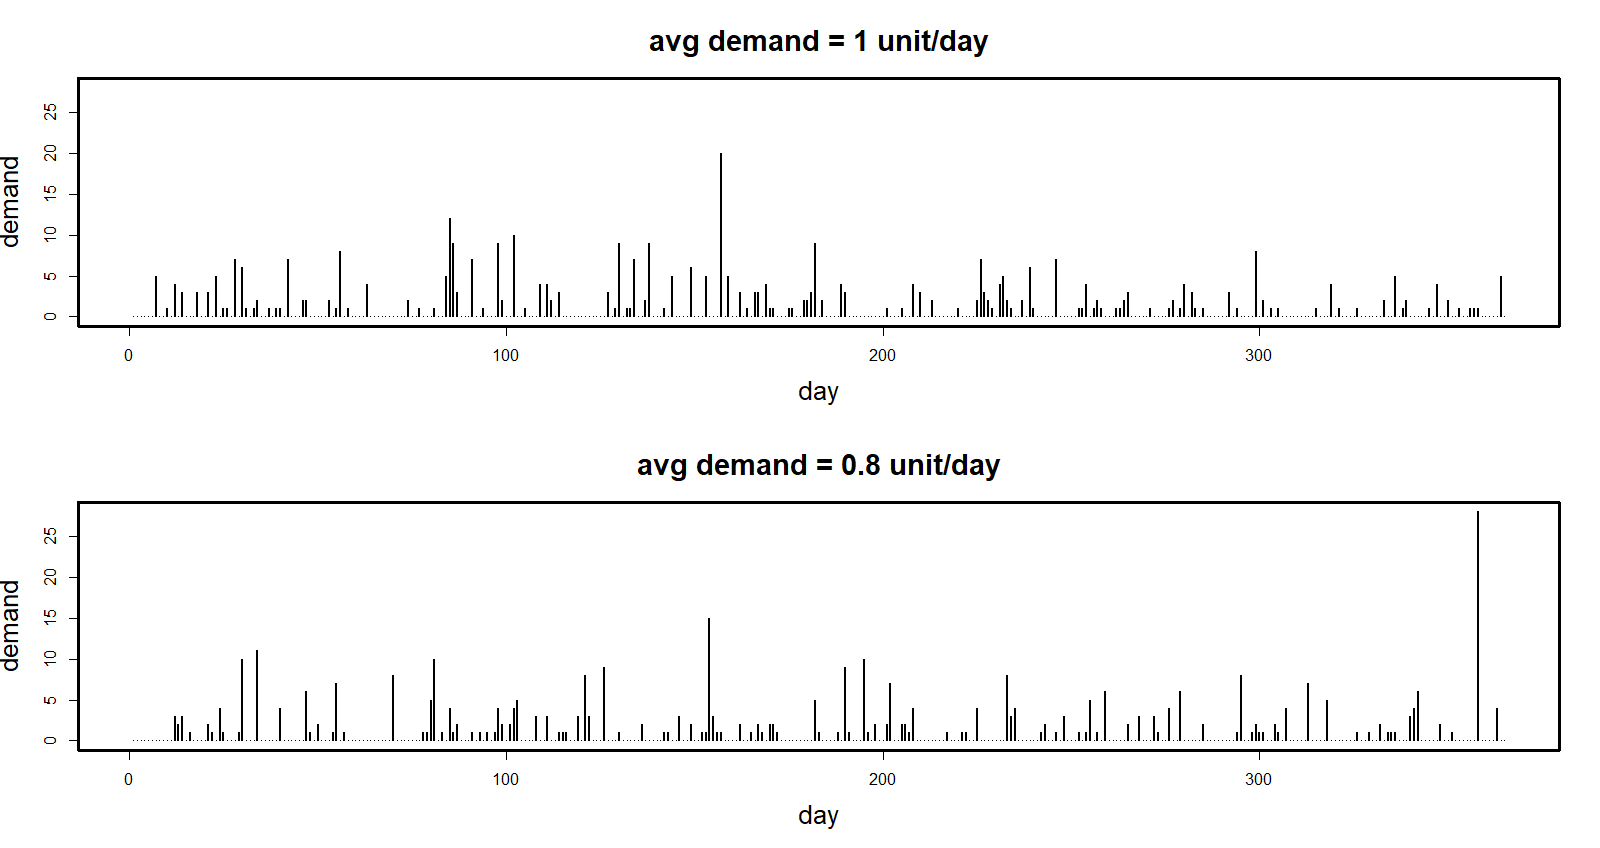
Figure 1: Samples of daily demand with two different average values. The difference in demand is unnoticeable to the naked eye but if not accounted for will have a large operational impact on inventory spend and service levels
Now imagine similar small shifts happening unnoticed across a full fleet of 10,000 inventory items. The total financial impact of all such shifts would be sufficient to get onto the radar of any CFO. Trying to keep on top of this turbulence would be impossible if done manually but modern inventory optimization software could calculate the proper adjustments automatically as frequently as your company can handle, even daily helping you realize substantial improvements in service levels, inventory efficiency, while lowering stockout and holding costs!

Related Posts

Managing Spare Parts Inventory: Best Practices
In this blog, we’ll explore several effective strategies for managing spare parts inventory, emphasizing the importance of optimizing stock levels, maintaining service levels, and using smart tools to aid in decision-making. Managing spare parts inventory is a critical component for businesses that depend on equipment uptime and service reliability. Unlike regular inventory items, spare parts often have unpredictable demand patterns, making them more challenging to manage effectively. An efficient spare parts inventory management system helps prevent stockouts that can lead to operational downtime and costly delays while also avoiding overstocking that unnecessarily ties up capital and increases holding costs.

12 Causes of Overstocking and Practical Solutions
Managing inventory effectively is critical for maintaining a healthy balance sheet and ensuring that resources are optimally allocated. Here is an in-depth exploration of the main causes of overstocking, their implications, and possible solutions.

FAQ: Mastering Smart IP&O for Better Inventory Management.
Effective supply chain and inventory management are essential for achieving operational efficiency and customer satisfaction. This blog provides clear and concise answers to some basic and other common questions from our Smart IP&O customers, offering practical insights to overcome typical challenges and enhance your inventory management practices. Focusing on these key areas, we help you transform complex inventory issues into strategic, manageable actions that reduce costs and improve overall performance with Smart IP&O.
Recent Posts
 Managing Spare Parts Inventory: Best PracticesIn this blog, we’ll explore several effective strategies for managing spare parts inventory, emphasizing the importance of optimizing stock levels, maintaining service levels, and using smart tools to aid in decision-making. Managing spare parts inventory is a critical component for businesses that depend on equipment uptime and service reliability. Unlike regular inventory items, spare parts often have unpredictable demand patterns, making them more challenging to manage effectively. An efficient spare parts inventory management system helps prevent stockouts that can lead to operational downtime and costly delays while also avoiding overstocking that unnecessarily ties up capital and increases holding costs. […]
 5 Ways to Improve Supply Chain Decision SpeedThe promise of a digital supply chain has transformed how businesses operate. At its core, it can make rapid, data-driven decisions while ensuring quality and efficiency throughout operations. However, it's not just about having access to more data. Organizations need the right tools and platforms to turn that data into actionable insights. This is where decision-making becomes critical, especially in a landscape where new digital supply chain solutions and AI-driven platforms can support you in streamlining many processes within the decision matrix. […]
 12 Causes of Overstocking and Practical SolutionsManaging inventory effectively is critical for maintaining a healthy balance sheet and ensuring that resources are optimally allocated. Here is an in-depth exploration of the main causes of overstocking, their implications, and possible solutions. […]
 FAQ: Mastering Smart IP&O for Better Inventory Management.Effective supply chain and inventory management are essential for achieving operational efficiency and customer satisfaction. This blog provides clear and concise answers to some basic and other common questions from our Smart IP&O customers, offering practical insights to overcome typical challenges and enhance your inventory management practices. Focusing on these key areas, we help you transform complex inventory issues into strategic, manageable actions that reduce costs and improve overall performance with Smart IP&O. […]
 7 Key Demand Planning Trends Shaping the FutureDemand planning goes beyond simply forecasting product needs; it's about ensuring your business meets customer demands with precision, efficiency, and cost-effectiveness. Latest demand planning technology addresses key challenges like forecast accuracy, inventory management, and market responsiveness. In this blog, we will introduce critical demand planning trends, including data-driven insights, probabilistic forecasting, consensus planning, predictive analytics, scenario modeling, real-time visibility, and multilevel forecasting. These trends will help you stay ahead of the curve, optimize your supply chain, reduce costs, and enhance customer satisfaction, positioning your business for long-term success. […]

Inventory Optimization for Manufacturers, Distributors, and MRO
- Managing Spare Parts Inventory: Best PracticesIn this blog, we’ll explore several effective strategies for managing spare parts inventory, emphasizing the importance of optimizing stock levels, maintaining service levels, and using smart tools to aid in decision-making. Managing spare parts inventory is a critical component for businesses that depend on equipment uptime and service reliability. Unlike regular inventory items, spare parts often have unpredictable demand patterns, making them more challenging to manage effectively. An efficient spare parts inventory management system helps prevent stockouts that can lead to operational downtime and costly delays while also avoiding overstocking that unnecessarily ties up capital and increases holding costs. […]
 Innovating the OEM Aftermarket with AI-Driven Inventory OptimizationThe aftermarket sector provides OEMs with a decisive advantage by offering a steady revenue stream and fostering customer loyalty through the reliable and timely delivery of service parts. However, managing inventory and forecasting demand in the aftermarket is fraught with challenges, including unpredictable demand patterns, vast product ranges, and the necessity for quick turnarounds. Traditional methods often fall short due to the complexity and variability of demand in the aftermarket. The latest technologies can analyze large datasets to predict future demand more accurately and optimize inventory levels, leading to better service and lower costs. […]
 Future-Proofing Utilities: Advanced Analytics for Supply Chain OptimizationUtilities in the electrical, natural gas, urban water, and telecommunications fields are all asset-intensive and reliant on physical infrastructure that must be properly maintained, updated, and upgraded over time. Maximizing asset uptime and the reliability of physical infrastructure demands effective inventory management, spare parts forecasting, and supplier management. A utility that executes these processes effectively will outperform its peers, provide better returns for its investors and higher service levels for its customers, while reducing its environmental impact. […]
 Centering Act: Spare Parts Timing, Pricing, and ReliabilityIn this article, we'll walk you through the process of crafting a spare parts inventory plan that prioritizes availability metrics such as service levels and fill rates while ensuring cost efficiency. We'll focus on an approach to inventory planning called Service Level-Driven Inventory Optimization. Next, we'll discuss how to determine what parts you should include in your inventory and those that might not be necessary. Lastly, we'll explore ways to enhance your service-level-driven inventory plan consistently. […]