
Many companies adopt a philosophy of “it’s better to have it and not need it, then to need it and not have it.” Planning initiatives such as implementing inventory optimization software in order to optimize reorder points, safety stocks, and order quantities are often seen as narrowly focused on reducing inventory and not pursued. Stock-out costs may very well be extremely high. However, resources are finite. The opportunity cost of keeping too much of one product means less space, cash, and resources for another product. Overstocking on one item reduces the ability to provide adequate levels of service on other items. Justifying overstocks by stating it is good for the customer is a poor excuse at best that hurts the customer and ignores what inventory optimization is really about – properly reallocating inventory investments.
Diminishing Returns and Inventory
Each additional unit of inventory that you carry buys proportionally less service. Inventory optimization software can help you understand the exact stock out risk given a certain level of stock. For example, say your stock-out risk with 20 units of inventory is 10%. If you add another 10 units and carry 30 units, the stock out risk might get cut in half to 5%. If you then add an additional 10 for a total of 40 units, the stock-out risk may only drop to 4%. At some point, the additional inventory just isn’t worth the extra service it buys. This is especially so if the cash used to buy that extra 10 units to get a small service level bump on one item could have been spent on another equally important item for a larger increase in service.
Carrying more than you need means you aren’t efficiently managing assets, which costs money, which means you can’t offer the best price to your customer, which hurts your ability to beat the competition. It also means there is less money for investment in other items. This results in the common adage “We have too much of the stuff we don’t need and not enough of the stuff we do.”
Inventory Optimization is about reallocation
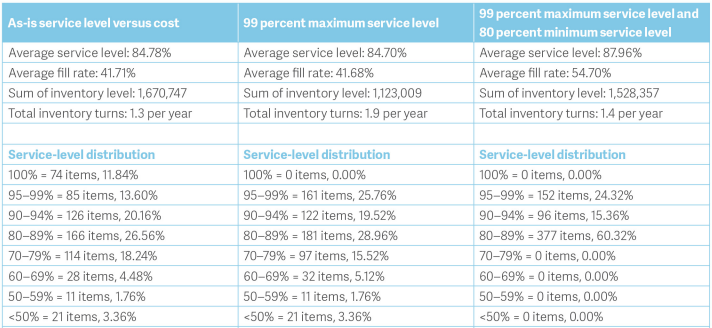
The example presented in the blog’s main image highlights the benefits of reallocating inventory. We used probability forecasting to estimate the service levels and inventory costs that would result from the current stocking policy. We then conducted a “what-if” scenario by modifying the policy. In the benchmark shown in the first column, the current stock levels were forecasted to yield a 84.78% service level and required $1.67 Million in inventory. Nearly 12% of the items numbers had reached their point of diminishing return and were forecasted to achieve a 100% service level. By imposing a maximum service level of 99% and a minimum service level of 80%, we reallocated inventory. As a result, the inventory investment dropped to $1.5 Million and service level increased by 3%!
The exact point of diminishing returns will differ depending on the item, the customers involved, and the company making the stocking decision. It is important to understand the inherent levels of stock-out risk that result from current inventory policies and how changes to current policies will impact risk and costs. This enables the reshaping of inventory so that service can be maximized at the minimum possible cost.
Download Smart Inventory Optimization product sheet here: https://smartcorp.com/inventory-optimization/

Related Posts

Forecast-Based Inventory Management for Better Planning
Forecast-based inventory management, or MRP (Material Requirements Planning) logic, is a forward-planning method that helps businesses meet demand without overstocking or understocking. By anticipating demand and adjusting inventory levels, it maintains a balance between meeting customer needs and minimizing excess inventory costs. This approach optimizes operations, reduces waste, and enhances customer satisfaction.

Make AI-Driven Inventory Optimization an Ally for Your Organization
In this blog, we will explore how organizations can achieve exceptional efficiency and accuracy with AI-driven inventory optimization. Traditional inventory management methods often fall short due to their reactive nature and reliance on manual processes. Maintaining optimal inventory levels is fundamental for meeting customer demand while minimizing costs. The introduction of AI-driven inventory optimization can significantly reduce the burden of manual processes, providing relief to supply chain managers from tedious tasks.

The Importance of Clear Service Level Definitions in Inventory Management
Inventory optimization software that supports what-if analysis will expose the tradeoff of stockouts vs. excess costs of varying service level targets. But first it is important to identify how “service levels” is interpreted, measured, and reported. This will avoid miscommunication and the false sense of security that can develop when less stringent definitions are used. Clearly defining how service level is calculated puts all stakeholders on the same page. This facilitates better decision-making.
Recent Posts
 Forecast-Based Inventory Management for Better PlanningForecast-based inventory management, or MRP (Material Requirements Planning) logic, is a forward-planning method that helps businesses meet demand without overstocking or understocking. By anticipating demand and adjusting inventory levels, it maintains a balance between meeting customer needs and minimizing excess inventory costs. This approach optimizes operations, reduces waste, and enhances customer satisfaction. […]
 Make AI-Driven Inventory Optimization an Ally for Your OrganizationIn this blog, we will explore how organizations can achieve exceptional efficiency and accuracy with AI-driven inventory optimization. Traditional inventory management methods often fall short due to their reactive nature and reliance on manual processes. Maintaining optimal inventory levels is fundamental for meeting customer demand while minimizing costs. The introduction of AI-driven inventory optimization can significantly reduce the burden of manual processes, providing relief to supply chain managers from tedious tasks. […]
 The Importance of Clear Service Level Definitions in Inventory ManagementInventory optimization software that supports what-if analysis will expose the tradeoff of stockouts vs. excess costs of varying service level targets. But first it is important to identify how “service levels” is interpreted, measured, and reported. This will avoid miscommunication and the false sense of security that can develop when less stringent definitions are used. Clearly defining how service level is calculated puts all stakeholders on the same page. This facilitates better decision-making. […]
 Future-Proofing Utilities: Advanced Analytics for Supply Chain OptimizationUtilities in the electrical, natural gas, urban water, and telecommunications fields are all asset-intensive and reliant on physical infrastructure that must be properly maintained, updated, and upgraded over time. Maximizing asset uptime and the reliability of physical infrastructure demands effective inventory management, spare parts forecasting, and supplier management. A utility that executes these processes effectively will outperform its peers, provide better returns for its investors and higher service levels for its customers, while reducing its environmental impact. […]
 The Cost of Spreadsheet PlanningCompanies that depend on spreadsheets for demand planning, forecasting, and inventory management are often constrained by the spreadsheet’s inherent limitations. This post examines the drawbacks of traditional inventory management approaches caused by spreadsheets and their associated costs, contrasting these with the significant benefits gained from embracing state-of-the-art planning technologies. […]

Inventory Optimization for Manufacturers, Distributors, and MRO
- Future-Proofing Utilities: Advanced Analytics for Supply Chain OptimizationUtilities in the electrical, natural gas, urban water, and telecommunications fields are all asset-intensive and reliant on physical infrastructure that must be properly maintained, updated, and upgraded over time. Maximizing asset uptime and the reliability of physical infrastructure demands effective inventory management, spare parts forecasting, and supplier management. A utility that executes these processes effectively will outperform its peers, provide better returns for its investors and higher service levels for its customers, while reducing its environmental impact. […]
 Centering Act: Spare Parts Timing, Pricing, and ReliabilityIn this article, we'll walk you through the process of crafting a spare parts inventory plan that prioritizes availability metrics such as service levels and fill rates while ensuring cost efficiency. We'll focus on an approach to inventory planning called Service Level-Driven Inventory Optimization. Next, we'll discuss how to determine what parts you should include in your inventory and those that might not be necessary. Lastly, we'll explore ways to enhance your service-level-driven inventory plan consistently. […]
 Why MRO Businesses Need Add-on Service Parts Planning & Inventory SoftwareMRO organizations exist in a wide range of industries, including public transit, electrical utilities, wastewater, hydro power, aviation, and mining. To get their work done, MRO professionals use Enterprise Asset Management (EAM) and Enterprise Resource Planning (ERP) systems. These systems are designed to do a lot of jobs. Given their features, cost, and extensive implementation requirements, there is an assumption that EAM and ERP systems can do it all. In this post, we summarize the need for add-on software that addresses specialized analytics for inventory optimization, forecasting, and service parts planning. […]
 5 Steps to Improve the Financial Impact of Spare Parts PlanningIn today’s competitive business landscape, companies are constantly seeking ways to improve their operational efficiency and drive increased revenue. Optimizing service parts management is an often-overlooked aspect that can have a significant financial impact. Companies can improve overall efficiency and generate significant financial returns by effectively managing spare parts inventory. This article will explore the economic implications of optimized service parts management and how investing in Inventory Optimization and Demand Planning Software can provide a competitive advantage. […]