The 3 Types of Supply Chain Analytics

The Smart Forecaster

 Pursuing best practices in demand planning,

forecasting and inventory optimization

There’s a stale old joke: “There are two types of people – those who believe there are two types of people, and those who don’t.” We can modify that joke: “There are two types of people – those who know there are three types of supply chain analytics, and those who haven’t yet read this blog.”

The three types of supply chain analytics are “descriptive”, “predictive”, and “prescriptive.” Each plays a different role in helping you manage your inventory. Modern supply chain software lets you exploit all three.

Descriptive Analytics

Descriptive Analytics are the stuff of dashboards. They tell you “what’s happenin’ now.” Included in this category are such summary numbers as dollars currently invested in inventory, current customer service level and fill rate, and average supplier lead times. These statistics are useful for keeping track of your operations, especially when you track changes in them from month to month. You will rely on them every day. They require accurate corporate databases, processed statistically.

Predictive Analytics

Predictive Analytics most commonly manifest as forecasts of demand, often broken down by product and location and sometimes also by customer. These statistics provide early warning so you can gear up production, staffing and raw material procurement to satisfy demand. They also provide predictions of the effect of changes in operating policies, e.g., what happens if we increase our order quantity for Product X from 20 to 25 units? You might rely on Predictive Analytics periodically, perhaps weekly or monthly, when you look up from what’s happening now to see what will happen next. Predictive Analytics uses Descriptive Analytics as a foundation but adds more capability. Predictive Analytics for demand forecasting requires advanced statistical processing to detect and estimate such features of product demand as trend, seasonality and regime change.  Predictive Analytics for inventory management uses forecasts of demand as inputs into models of the operation of inventory policies, which in turn provide estimates of key performance metrics such as service levels, fill rates, and operating costs.

Prescriptive Analytics

Prescriptive Analytics are not about what is happening now, or what will happen next, but about what you should do next, i.e., they recommend decisions aimed at maximizing inventory system performance. You might rely on Prescriptive Analytics to best posture your entire inventory policy. Prescriptive Analytics uses Predictive Analytics as a foundation then adds optimization capability. For instance, Prescriptive Analytics software can automatically work out the best choices for future values of Min’s and Max’s for thousands of inventory items. Here, “best” might mean the values of Min and Max for each item that minimize operating cost (the sum of holding, ordering, and shortage costs) while maintaining a 90% floor on item fill rate.

Example

The figure below shows how supply chain analytics can help the inventory manager. The columns show three predicted Key Performance Indicators (KPI’s): service level, inventory investment, and operating costs (holding costs + ordering costs + shortage costs).

 Figure 1: The three types of analytics used to evaluate planning scenarios

The rows show four alternative inventory policies, expressed as scenarios. The “Live” scenario reports on the values of the KPI’s on July 1, 2018. The “99% All” scenario changes the current policy by raising the service level of all items to 99%. The “75 floor/99 ceiling” scenario raises service levels that are too low up to 75% and lowers very high (i.e., expensive) service levels down to 95%. The “Optimization” scenario prescribes item specific service levels that minimizes total operating costs.

The “Live 07-01-2018” scenario is an example of Descriptive Analytics. It shows the current baseline performance. The software then allows the user to try out changes in inventory policy by creating new “What If” scenarios that might then be converted to named scenarios for further consideration. The next two scenarios are examples of Predictive Analytics. They both assess the consequences of their recommended inventory control policies, i.e., recommended values of Min and Max for all items. The “Optimization” scenario is an example of Prescriptive Analytics because it recommends a best compromise policy.

Consider how the three alternative scenarios compare to the baseline “Live” scenario. The “99% All” scenario raises the item availability metrics, increasing service level from 88% to 99%. However, doing so increases the total inventory investment from $3 million to about $4 million. In contrast, the “75 floor/99 ceiling” scenario increases both service level and reduces the cash tied up in inventory by about $300,000. Finally, the “Optimization” scenario achieves an 80% service level, a reduction from the current 88%, but it cuts more than $2 million from the inventory value and reduces operating costs by more than $400,000 annually. From here, managers could try further options, such as giving back some of the $2 million savings to achieve a higher average service level.

Summary

Modern software packages for inventory planning and inventory optimization should offer three kinds of supply chain analytics: Descriptive, Predictive, and Prescriptive. Their combination lets inventory managers track their operations (Descriptive), forecast where their operations will be in the future (Predictive), and optimize their inventory policies in response in anticipation of future conditions (Prescriptive).


Leave a Comment

Related Posts

The Supply Chain Blame Game:  Top 3 Excuses for Inventory Shortage and Excess

The Supply Chain Blame Game: Top 3 Excuses for Inventory Shortage and Excess

The supply chain has become the blame game for almost any industrial or retail problem. Shortages on lead time variability, bad forecasts, and problems with bad data are facts of life, yet inventory-carrying organizations are often caught by surprise when any of these difficulties arise. So, again, who is to blame for the supply chain chaos? Keep reading this blog and we will try to show you how to prevent product shortages and overstocking.

Recent Posts

  • Managing Spare Parts Inventory: Best PracticesManaging Spare Parts Inventory: Best Practices
    In this blog, we’ll explore several effective strategies for managing spare parts inventory, emphasizing the importance of optimizing stock levels, maintaining service levels, and using smart tools to aid in decision-making. Managing spare parts inventory is a critical component for businesses that depend on equipment uptime and service reliability. Unlike regular inventory items, spare parts often have unpredictable demand patterns, making them more challenging to manage effectively. An efficient spare parts inventory management system helps prevent stockouts that can lead to operational downtime and costly delays while also avoiding overstocking that unnecessarily ties up capital and increases holding costs. […]
  • 5 Ways to Improve Supply Chain Decision Speed5 Ways to Improve Supply Chain Decision Speed
    The promise of a digital supply chain has transformed how businesses operate. At its core, it can make rapid, data-driven decisions while ensuring quality and efficiency throughout operations. However, it's not just about having access to more data. Organizations need the right tools and platforms to turn that data into actionable insights. This is where decision-making becomes critical, especially in a landscape where new digital supply chain solutions and AI-driven platforms can support you in streamlining many processes within the decision matrix. […]
  • Two employees checking inventory in temporary storage in a distribution warehouse.12 Causes of Overstocking and Practical Solutions
    Managing inventory effectively is critical for maintaining a healthy balance sheet and ensuring that resources are optimally allocated. Here is an in-depth exploration of the main causes of overstocking, their implications, and possible solutions. […]
  • FAQ Mastering Smart IP&O for Better Inventory ManagementFAQ: Mastering Smart IP&O for Better Inventory Management.
    Effective supply chain and inventory management are essential for achieving operational efficiency and customer satisfaction. This blog provides clear and concise answers to some basic and other common questions from our Smart IP&O customers, offering practical insights to overcome typical challenges and enhance your inventory management practices. Focusing on these key areas, we help you transform complex inventory issues into strategic, manageable actions that reduce costs and improve overall performance with Smart IP&O. […]
  • 7 Key Demand Planning Trends Shaping the Future7 Key Demand Planning Trends Shaping the Future
    Demand planning goes beyond simply forecasting product needs; it's about ensuring your business meets customer demands with precision, efficiency, and cost-effectiveness. Latest demand planning technology addresses key challenges like forecast accuracy, inventory management, and market responsiveness. In this blog, we will introduce critical demand planning trends, including data-driven insights, probabilistic forecasting, consensus planning, predictive analytics, scenario modeling, real-time visibility, and multilevel forecasting. These trends will help you stay ahead of the curve, optimize your supply chain, reduce costs, and enhance customer satisfaction, positioning your business for long-term success. […]

    Inventory Optimization for Manufacturers, Distributors, and MRO

    • Managing Spare Parts Inventory: Best PracticesManaging Spare Parts Inventory: Best Practices
      In this blog, we’ll explore several effective strategies for managing spare parts inventory, emphasizing the importance of optimizing stock levels, maintaining service levels, and using smart tools to aid in decision-making. Managing spare parts inventory is a critical component for businesses that depend on equipment uptime and service reliability. Unlike regular inventory items, spare parts often have unpredictable demand patterns, making them more challenging to manage effectively. An efficient spare parts inventory management system helps prevent stockouts that can lead to operational downtime and costly delays while also avoiding overstocking that unnecessarily ties up capital and increases holding costs. […]
    • Innovating the OEM Aftermarket with AI-Driven Inventory Optimization XLInnovating the OEM Aftermarket with AI-Driven Inventory Optimization
      The aftermarket sector provides OEMs with a decisive advantage by offering a steady revenue stream and fostering customer loyalty through the reliable and timely delivery of service parts. However, managing inventory and forecasting demand in the aftermarket is fraught with challenges, including unpredictable demand patterns, vast product ranges, and the necessity for quick turnarounds. Traditional methods often fall short due to the complexity and variability of demand in the aftermarket. The latest technologies can analyze large datasets to predict future demand more accurately and optimize inventory levels, leading to better service and lower costs. […]
    • Future-Proofing Utilities. Advanced Analytics for Supply Chain OptimizationFuture-Proofing Utilities: Advanced Analytics for Supply Chain Optimization
      Utilities in the electrical, natural gas, urban water, and telecommunications fields are all asset-intensive and reliant on physical infrastructure that must be properly maintained, updated, and upgraded over time. Maximizing asset uptime and the reliability of physical infrastructure demands effective inventory management, spare parts forecasting, and supplier management. A utility that executes these processes effectively will outperform its peers, provide better returns for its investors and higher service levels for its customers, while reducing its environmental impact. […]
    • Centering Act Spare Parts Timing Pricing and ReliabilityCentering Act: Spare Parts Timing, Pricing, and Reliability
      In this article, we'll walk you through the process of crafting a spare parts inventory plan that prioritizes availability metrics such as service levels and fill rates while ensuring cost efficiency. We'll focus on an approach to inventory planning called Service Level-Driven Inventory Optimization. Next, we'll discuss how to determine what parts you should include in your inventory and those that might not be necessary. Lastly, we'll explore ways to enhance your service-level-driven inventory plan consistently. […]

      The Top 5 Myths about Demand Planning Implementations

      The Smart Forecaster

       Pursuing best practices in demand planning,

      forecasting and inventory optimization

      1. The setup will be straightforward.

      We just need to feed our demand histories into our new statistical methods, and we can start planning more effectively.  Not quite: it’s about the technology and the process. You are investing in a new business process to develop forecasts for driving business strategy and inventory planning decisions. It will take time to get all stakeholders involved: sales, marketing, procurement, operations, and maintenance/technicians (for spare parts inventory).  Who owns the forecast? What will your items’ forecast hierarchy look like?  Where will the most business knowledge come from?  Is there a consensus process that will use the business knowledge to customize the forecasts to your particular situation? Does everyone understand the statistical methods?   Is there agreement on the underlying values that balance holding, ordering and (especially) shortage costs? Are you prepared to make choices along the crucial tradeoff curve relating inventory costs to customer service levels?  How do you plan on measuring forecasting accuracy/error? Does management understand the concept of “forecast value add” whereby you track the error with each version of the forecast (statistical error vs. sales forecast error vs. consensus error).  Without this context and agreed upon participation from key stake holders, the system will still be implemented but used in silo

      2. All I need is historical demand data, and then I can start forecasting.

      Almost.  Getting good data isn’t easy.  Are your demand history data complete and correct? Are your supplier data (e.g., lead times) also complete and correct? Have you recognized the special needs of new and end-of-life items? Sure, IT could export a file of aggregated demand data (weekly or monthly), but how do you know it is correct?  When orders and shipments are booked, they fall under a variety of different transactions codes.  You have to be able to know how to compose your demand signal.  Orders or shipments? Include or exclude returns? What about warehouse transfers?  What about returns that occur many periods after initial shipment?  How will my ERP interpret the forecast?  But wait…we are using a solution with an ERP connector that promises data will flow back and forth seamlessly.  An ERP connector will certainly cover the transfer of historical data and forecast results between systems but it won’t improve bad data quality.  You also have to make sure the ERP connector has the flexibility of determining how to compose your demand history.  For example, if it is hard coded to pull certain transactions types that you may not want or require different transactions it doesn’t include, you’ll need customizations.  There is also the problem of product supersession and/or location changes – i.e., Product A gets phased out and becomes Product B, or now Product A ships from a different warehouse.   Sounds simple, but if this happens often across thousands of items then it must be accounted for as part of an automatic forecasting process.  Otherwise, your users are required to manually manage this constant updating. Then you lose economies of scale. More “data wrangling” means more hassle, more errors, and missed decision deadlines. Less frequent updates can mean less accurate forecasts, which leads to excess inventory for some items and insufficient inventory for others

      3. If we get a better forecast, we’ll have the right inventory, reduce stockouts, and increase service.

      The demand forecast is one component of a larger process.  If you have another department that applies incorrect buffers (too much or too little safety stock), then a lot of the benefit of a more accurate forecast goes out the window.  You have to look holistically at forecasting within the context of inventory management. You can’t get maximum benefit (and in some cases, any benefit) unless you account for all components including buffer levels such as safety stock and reorder points, ordering rules, and managing supplier/internal lead times. It is not uncommon for buyers to implement rules of thumb inventory policies such as ordering early or inflating the forecast to reduce the risk of running out.  The opposite behavior where an order signal triggered by the forecast is deferred to a later date to prevent an order from being placed “too early” is equally prevalent.  This type of behavior is based on a pain avoidance response that occurs within companies that have an ad-hoc inventory planning process that doesn’t holistically connect the forecast to inventory strategy.  

      4. The more forecasting models the better.

       This is true in some cases. In an ironic twist, the more models to choose from sometimes means you’ll have a greater chance of picking the wrong one.  This occurs even when there is an automated system selecting the right method.  This is because most automated forecasting systems still make the mistake of selecting methods based on best fit to past demand. This backward-looking approach usually results in poor performance when looking forward in time; this can be tested by waiting a bit and then comparing forecasted versus actual demand (or, if you don’t want to wait, by hiding some of the recent data and forecasting it, in which case the actuals are already in hand). In principle, having more models might be useful, but what is important is understanding the approach for model selection.  Furthermore, most forecasting models produce a single-number forecast (“Demand for Product A will be 17 units next month”) without any indication of the forecast uncertainty or margin of error. Without knowing the margin of error, you cannot appreciate and rationally manage forecast risk.

      In our software, we offer automated time series selection that chooses from dozens of proven techniques on the basis of estimated future performance, not fit to past data.  We also go beyond single-number forecasting using probabilistic methods to generate thousands of forecast scenarios to assess forecast uncertainty.  We’ve found that this approach is considerably more accurate for certain types of data than the traditional tournament selection.  So, in these situations the number of models we’d recommend using is “One!”  Does that it make inferior?  Of course not.  Take the time to fine-tune your models in order to see what works best for your business.

      5. With the right software, anybody can do the job well.

      Would that it were so. However, after our involvement in decades of implementations, it is clear that not everybody should be at the demand planning keyboard. The job doesn’t need a super-hero, but certain traits make for success:

      • Having a company-wide perspective. So many problems in demand planning stem from stove-piped thinking. A proper planning process surfaces the need for all stakeholders’ involvement, so a user unable to think beyond his or her previous fiefdom can be a liability.
      • Being innumerate. A user who is not comfortable with numbers will struggle.
      • Appreciating randomness. This is similar to innumeracy but goes beyond. Most of the friction in demand planning and inventory optimization derives from randomness: in product demand, in supplier lead time, etc. Without a good feel for how randomness causes trouble, a user will often be puzzled at how poorly his or her decisions turn out
      • Being incurious. Top-flight software encourages users to game out “what if?” scenarios to see how to tweak automatically computed solutions to get even better results. If the user never gets into a “what if?” mentality, they will under perform. Furthermore, playing with alternative scenarios is one of the best ways to build an instinctive feel for the randomness in the system.

      Conclusion

      The five reasons outlined here show why implementing a forecasting, demand planning, or inventory optimization system isn’t as simple as turning on the software, importing your historical data, and getting some user training on how to operate the software.  You are implementing a new process for planning your business and determining stocking policy that will drive spending on inventory and impact your ability to capture sales.  However, the effort is well worth it.  Per an Institute of Business Forecasting (IBF) blog, a 1% reduction in under-forecast error at a $50 Million company yields a savings as much as $1.52M.  Conversely, the benefits of a 1% reduction in over-forecast error were $1.28M yielding an average benefit of $1.4M.  This means you stand to save your business $260,000 annually for every $10 Million in revenue! 


      Leave a Comment

      Related Posts

      The Supply Chain Blame Game:  Top 3 Excuses for Inventory Shortage and Excess

      The Supply Chain Blame Game: Top 3 Excuses for Inventory Shortage and Excess

      The supply chain has become the blame game for almost any industrial or retail problem. Shortages on lead time variability, bad forecasts, and problems with bad data are facts of life, yet inventory-carrying organizations are often caught by surprise when any of these difficulties arise. So, again, who is to blame for the supply chain chaos? Keep reading this blog and we will try to show you how to prevent product shortages and overstocking.

      Recent Posts

      • Managing Spare Parts Inventory: Best PracticesManaging Spare Parts Inventory: Best Practices
        In this blog, we’ll explore several effective strategies for managing spare parts inventory, emphasizing the importance of optimizing stock levels, maintaining service levels, and using smart tools to aid in decision-making. Managing spare parts inventory is a critical component for businesses that depend on equipment uptime and service reliability. Unlike regular inventory items, spare parts often have unpredictable demand patterns, making them more challenging to manage effectively. An efficient spare parts inventory management system helps prevent stockouts that can lead to operational downtime and costly delays while also avoiding overstocking that unnecessarily ties up capital and increases holding costs. […]
      • 5 Ways to Improve Supply Chain Decision Speed5 Ways to Improve Supply Chain Decision Speed
        The promise of a digital supply chain has transformed how businesses operate. At its core, it can make rapid, data-driven decisions while ensuring quality and efficiency throughout operations. However, it's not just about having access to more data. Organizations need the right tools and platforms to turn that data into actionable insights. This is where decision-making becomes critical, especially in a landscape where new digital supply chain solutions and AI-driven platforms can support you in streamlining many processes within the decision matrix. […]
      • Two employees checking inventory in temporary storage in a distribution warehouse.12 Causes of Overstocking and Practical Solutions
        Managing inventory effectively is critical for maintaining a healthy balance sheet and ensuring that resources are optimally allocated. Here is an in-depth exploration of the main causes of overstocking, their implications, and possible solutions. […]
      • FAQ Mastering Smart IP&O for Better Inventory ManagementFAQ: Mastering Smart IP&O for Better Inventory Management.
        Effective supply chain and inventory management are essential for achieving operational efficiency and customer satisfaction. This blog provides clear and concise answers to some basic and other common questions from our Smart IP&O customers, offering practical insights to overcome typical challenges and enhance your inventory management practices. Focusing on these key areas, we help you transform complex inventory issues into strategic, manageable actions that reduce costs and improve overall performance with Smart IP&O. […]
      • 7 Key Demand Planning Trends Shaping the Future7 Key Demand Planning Trends Shaping the Future
        Demand planning goes beyond simply forecasting product needs; it's about ensuring your business meets customer demands with precision, efficiency, and cost-effectiveness. Latest demand planning technology addresses key challenges like forecast accuracy, inventory management, and market responsiveness. In this blog, we will introduce critical demand planning trends, including data-driven insights, probabilistic forecasting, consensus planning, predictive analytics, scenario modeling, real-time visibility, and multilevel forecasting. These trends will help you stay ahead of the curve, optimize your supply chain, reduce costs, and enhance customer satisfaction, positioning your business for long-term success. […]

        Inventory Optimization for Manufacturers, Distributors, and MRO

        • Managing Spare Parts Inventory: Best PracticesManaging Spare Parts Inventory: Best Practices
          In this blog, we’ll explore several effective strategies for managing spare parts inventory, emphasizing the importance of optimizing stock levels, maintaining service levels, and using smart tools to aid in decision-making. Managing spare parts inventory is a critical component for businesses that depend on equipment uptime and service reliability. Unlike regular inventory items, spare parts often have unpredictable demand patterns, making them more challenging to manage effectively. An efficient spare parts inventory management system helps prevent stockouts that can lead to operational downtime and costly delays while also avoiding overstocking that unnecessarily ties up capital and increases holding costs. […]
        • Innovating the OEM Aftermarket with AI-Driven Inventory Optimization XLInnovating the OEM Aftermarket with AI-Driven Inventory Optimization
          The aftermarket sector provides OEMs with a decisive advantage by offering a steady revenue stream and fostering customer loyalty through the reliable and timely delivery of service parts. However, managing inventory and forecasting demand in the aftermarket is fraught with challenges, including unpredictable demand patterns, vast product ranges, and the necessity for quick turnarounds. Traditional methods often fall short due to the complexity and variability of demand in the aftermarket. The latest technologies can analyze large datasets to predict future demand more accurately and optimize inventory levels, leading to better service and lower costs. […]
        • Future-Proofing Utilities. Advanced Analytics for Supply Chain OptimizationFuture-Proofing Utilities: Advanced Analytics for Supply Chain Optimization
          Utilities in the electrical, natural gas, urban water, and telecommunications fields are all asset-intensive and reliant on physical infrastructure that must be properly maintained, updated, and upgraded over time. Maximizing asset uptime and the reliability of physical infrastructure demands effective inventory management, spare parts forecasting, and supplier management. A utility that executes these processes effectively will outperform its peers, provide better returns for its investors and higher service levels for its customers, while reducing its environmental impact. […]
        • Centering Act Spare Parts Timing Pricing and ReliabilityCentering Act: Spare Parts Timing, Pricing, and Reliability
          In this article, we'll walk you through the process of crafting a spare parts inventory plan that prioritizes availability metrics such as service levels and fill rates while ensuring cost efficiency. We'll focus on an approach to inventory planning called Service Level-Driven Inventory Optimization. Next, we'll discuss how to determine what parts you should include in your inventory and those that might not be necessary. Lastly, we'll explore ways to enhance your service-level-driven inventory plan consistently. […]

          The Right Forecast Accuracy Metric for Inventory Planning

          The Smart Forecaster

           Pursuing best practices in demand planning,

          forecasting and inventory optimization

          To test software solutions via a series of empirical competition can be a considerable option. For forecasting / demand planning, a traditional “hold out” test in which 2014-2018 data are provided to software vendors and 2019 is held out for later comparison against forecasts provided by competing vendors. The company then measures forecast error and bias. This approach is advocated nearly universally for assessing forecast accuracy. It’s a good way to assess monthly or weekly forecast accuracy, but it is minimally useful if you have a different objective: Optimizing inventory.

          In our last blog, we discussed how to pick a targeted service level. We indicated that just because you set a target (or a system recommends a target) doesn’t mean you’ll actually achieve the target. The right way to measure accuracy if you are interested in optimizing stock levels is to focus on the accuracy of the service level projection. This will account for both lead time demand and safety stock.

          Setting a target service level is a strategic decision about inventory risk management. Inventory software does the tactical work by computing reorder points (a.k.a. mins) meant to achieve a user-defined target or that will achieve a system-calculated optimal target. But if the software uses the wrong demand model, the achieved service level will miss the target, sometimes significantly. The result of this error will be either shortages or inventory bloat, depending on the direction of the miss.

          Graphic to approach is advocated nearly universally for assessing forecast accuracyForecasting is a means to an end. The end is to optimize inventory levels. Because demand is uncertain, companies that need to provide even moderate service levels must stock more than the forecast, often much more. But doesn’t low forecast error mean lower safety stock? The better my forecasts, the lower my inventory? Yes, true. But what matters when determining the required inventory are both accurate forecasts of the most likely demand and accurate estimates of the variability around the most likely demand.

          Especially with long tailed, intermittent demand, traditional forecast accuracy assessments over a conventional 12 month forecast horizon miss the point three ways.

          – First, the relevant time scale for inventory optimization is the replenishment lead time, which is usually much shorter than 12 months. Demand during lead times measured in days or weeks has volatility that gets averaged out over long forecast horizons. This is bad because factoring in the effect of volatility is essential to calculation of optimal reorder points.

          – Second, forecast accuracy assessed over a multi-month forecast horizon focuses on the typical error in a typical month within the horizon. In contrast, inventory optimization requires a focus on cumulative demand, not period-by-period demand.

          – Third, and most important is that forecast error metrics are focused on the middle of the demand distribution, aiming to estimate the most likely demand. But setting reorder points involves estimating high percentiles of the cumulative demand distribution over a lead time. Estimating the middle a bit better but having no clue about, say, the 95th percentile, is not helpful.

          Consider this hypothetical example. If Vendor A forecasts 20 units with 110% error and Vendor B forecasts 22 units with 105% error, then Vendor B has an advantage in the forecasting game. But if you want a high service level and the demand is intermittent, you’ll have to stock a lot more than 20 or 22 units. Let’s assume you select Vendor B’s technology to plan stocking levels. You then notice that when planning reorder points to achieve a 95% service level, you often fall short – way more often that the expected 5% of the time. You come to realize that Vendor B’s approach completely underestimates the safety stock required to achieve the target service target. Focusing on vendors’ forecast error isn’t going to help. You will come to wish that you had verified Vendor A and B’s service level accuracy. Now you are stuck arbitrarily adjusting Vendor B’s service level targets to compensate for the shortfall.

          So what’s needed in vendor competitions is assessment of their systems’ abilities to accurately forecast the inventory required to meet a given service level over an item’s replenishment lead time. Narrowly focusing on measuring forecast error is not appropriate if the mission is managing inventory. This is especially true for long tail items with intermittent demand or items that have medium to high volume but don’t have a demand distribution that looks like the classic “bell shaped curve” (Normal distribution).

          The remainder of this blog explains how to test the accuracy of software’s service level calculations, so you can monitor the risk of missing your service level targets. We recommend this accuracy test over traditional “forecast versus actuals” tests because it provides much more insight into how reorder point recommendations will influence inventory levels and customer service.

          Office staff are analyzing The Right Forecast Accuracy Metric for Inventory Planning

          Office staff are analyzing The Right Forecast Accuracy Metric for Inventory Planning

          Service Level Defined

          Consider a single inventory item. When inventory drops to or below the reorder point, a replenishment order is generated. This starts a period of risk that lasts as long as the replenishment lead time. During the period of risk, there might be enough incoming demands to create backorders or lost sales. The service level is the probability that there are no backorders or stockouts during the replenishment lead time. Critical items might be given very high target service levels, say 99%, whereas other items might have more relaxed targets, such as 75%. Whatever the target service level, it is best to hit that target.

          Calculating Service Level

          The service level for an individual item can only be estimated by repeated comparison of observed lead time demand against the calculated reorder point. These estimates take a lot of time: at least dozens of lead times. But fleet-wise service level can be estimated using data compiled over a single lead time.

          Let’s do an example. Suppose you have demand histories for 1,000 items over 365 days and that (for simplicity) all items have 45-day lead times. For each item, follow these steps to estimate the fleet-wise achieved service level:

          Step 1: Step aside (“hold out”) the most recent 45 days of demand (or however many days is closest to your typical lead times). Compute their sum, which is the most recent value of the actual lead time demand. This is the ground truth to be used to estimate the achieved service level.

          Step 2: Use the prior 320 days of demand history to forecast the required inventory to hit a range of service level targets, say 90%, 95%, 97%, and 99%.

          Step 3: Check whether the observed lead time demand is less than or equal to the reorder point. If it is, count this as a win; otherwise, count it as a loss. For instance, if the reorder point is 15 units but the most recent lead time demand is 10 units, then this is a win, since the reorder point is high enough to cover a lead time demand of 10 without any shortage. However, if the most recent lead time demand is 18 units, there would be a stockout, and 3 units would either be backordered or counted as lost sales.

          Step 4: Working across all items, and all service level targets, tally the percentage of tests for each service level target that resulted in a win. This is the achieved service level. If the target was 90% and 853 of the 1,000 units record a win, then the achieved service level is 85.3%.

          Example

          Consider a real-world example. The data are daily demand histories of 590 medical supply items used in an internationally famous clinic. For simplicity, we assume each item has a lead time of 45 days. We evaluate target service levels of 70%, 90%, 95% and 99%.
          We compare two demand models. The “Normal” model assumes that daily demand has a Normal (“bell-shaped”) distribution. This is the classic assumption used in most introductory textbooks on inventory control and in many software products. Classic though it may be, it is often an inappropriate model of demand for spare parts or supplies. The “Probability Forecast” model takes explicit account of the intermittent nature of demand.

          Exhibit 1 shows the results. Column J shows the actual demand over the final 45 observations. The computed reorder points for the Advanced Model are shown in columns L-O.  The computed reorder points for the Normal model are not displayed.  Columns Q-T and V-Y hold the results of the tests for whether the reorder points were high enough to handle the lead time demands in column J.

          The final results (yellow cells) show a clear difference between the Normal and Probability (Advanced) demand models. Both did a good job of hitting the 70% service level target, but estimating higher service levels is a more delicate calculation, and the Probability model does a much better job. For instance, the Normal model’s supposed 99% service level turned out to be only 94.4%, while the Probability model hit the target with a 98.5% achieved service level.

          Implications

          Utilizing the more accurate method achieved the targeted service level, while the less accurate method did not. If the less accurate method is used then real and costly business decisions will be made on the false assumption that a higher service level will be achieved. For example, if a Service Level Agreement (SLA) is based on these results and a 99% service level is committed to, the supplier would actually be five times more likely to stock out than planned (service level promised = 99% or 1% stockout risk vs. service level achieved = 94.5% or 5.5% stock out risk)! This means financial penalties will be incurred five times more often than expected.

          Suppose that planners knew the target service level would not be met but were stuck using an inaccurate model. They would still need a way to increase inventory and achieve the desired level of service. What might they choose to do? We have observed situations where the planner enters a higher service level target than needed in order to “trick” the system into delivering the required service level. In the above example, the Normal model needed to have a 99.99% service level entered before it could achieve a target service level of 99%. This change resulted in achieving a 99% service but more than doubled the inventory investment when compared to the Advanced model.

          Implementing a Service Level Accuracy Test

          At Smart Software, we’ve encouraged many of our customers to conduct the test of service level accuracy as a way for them to assess our and other vendors’ claims during the software selection process. Missing the service level target has extremely costly implications resulting in substantial over stocks or under stocks.  So, test service level accuracy before deploying a solution to identify situations when the modeling fails. Don’t assume that you will achieve the service level you decide to target (or that the system recommends). To request an Excel spreadsheet that serves as a template for a service level accuracy test, email your contact information to info@smartcorp.com and enter “Accuracy Template” in the subject line.

          Leave a Comment

          Related Posts

          The Supply Chain Blame Game:  Top 3 Excuses for Inventory Shortage and Excess

          The Supply Chain Blame Game: Top 3 Excuses for Inventory Shortage and Excess

          The supply chain has become the blame game for almost any industrial or retail problem. Shortages on lead time variability, bad forecasts, and problems with bad data are facts of life, yet inventory-carrying organizations are often caught by surprise when any of these difficulties arise. So, again, who is to blame for the supply chain chaos? Keep reading this blog and we will try to show you how to prevent product shortages and overstocking.

          Recent Posts

          • Managing Spare Parts Inventory: Best PracticesManaging Spare Parts Inventory: Best Practices
            In this blog, we’ll explore several effective strategies for managing spare parts inventory, emphasizing the importance of optimizing stock levels, maintaining service levels, and using smart tools to aid in decision-making. Managing spare parts inventory is a critical component for businesses that depend on equipment uptime and service reliability. Unlike regular inventory items, spare parts often have unpredictable demand patterns, making them more challenging to manage effectively. An efficient spare parts inventory management system helps prevent stockouts that can lead to operational downtime and costly delays while also avoiding overstocking that unnecessarily ties up capital and increases holding costs. […]
          • 5 Ways to Improve Supply Chain Decision Speed5 Ways to Improve Supply Chain Decision Speed
            The promise of a digital supply chain has transformed how businesses operate. At its core, it can make rapid, data-driven decisions while ensuring quality and efficiency throughout operations. However, it's not just about having access to more data. Organizations need the right tools and platforms to turn that data into actionable insights. This is where decision-making becomes critical, especially in a landscape where new digital supply chain solutions and AI-driven platforms can support you in streamlining many processes within the decision matrix. […]
          • Two employees checking inventory in temporary storage in a distribution warehouse.12 Causes of Overstocking and Practical Solutions
            Managing inventory effectively is critical for maintaining a healthy balance sheet and ensuring that resources are optimally allocated. Here is an in-depth exploration of the main causes of overstocking, their implications, and possible solutions. […]
          • FAQ Mastering Smart IP&O for Better Inventory ManagementFAQ: Mastering Smart IP&O for Better Inventory Management.
            Effective supply chain and inventory management are essential for achieving operational efficiency and customer satisfaction. This blog provides clear and concise answers to some basic and other common questions from our Smart IP&O customers, offering practical insights to overcome typical challenges and enhance your inventory management practices. Focusing on these key areas, we help you transform complex inventory issues into strategic, manageable actions that reduce costs and improve overall performance with Smart IP&O. […]
          • 7 Key Demand Planning Trends Shaping the Future7 Key Demand Planning Trends Shaping the Future
            Demand planning goes beyond simply forecasting product needs; it's about ensuring your business meets customer demands with precision, efficiency, and cost-effectiveness. Latest demand planning technology addresses key challenges like forecast accuracy, inventory management, and market responsiveness. In this blog, we will introduce critical demand planning trends, including data-driven insights, probabilistic forecasting, consensus planning, predictive analytics, scenario modeling, real-time visibility, and multilevel forecasting. These trends will help you stay ahead of the curve, optimize your supply chain, reduce costs, and enhance customer satisfaction, positioning your business for long-term success. […]

            Inventory Optimization for Manufacturers, Distributors, and MRO

            • Managing Spare Parts Inventory: Best PracticesManaging Spare Parts Inventory: Best Practices
              In this blog, we’ll explore several effective strategies for managing spare parts inventory, emphasizing the importance of optimizing stock levels, maintaining service levels, and using smart tools to aid in decision-making. Managing spare parts inventory is a critical component for businesses that depend on equipment uptime and service reliability. Unlike regular inventory items, spare parts often have unpredictable demand patterns, making them more challenging to manage effectively. An efficient spare parts inventory management system helps prevent stockouts that can lead to operational downtime and costly delays while also avoiding overstocking that unnecessarily ties up capital and increases holding costs. […]
            • Innovating the OEM Aftermarket with AI-Driven Inventory Optimization XLInnovating the OEM Aftermarket with AI-Driven Inventory Optimization
              The aftermarket sector provides OEMs with a decisive advantage by offering a steady revenue stream and fostering customer loyalty through the reliable and timely delivery of service parts. However, managing inventory and forecasting demand in the aftermarket is fraught with challenges, including unpredictable demand patterns, vast product ranges, and the necessity for quick turnarounds. Traditional methods often fall short due to the complexity and variability of demand in the aftermarket. The latest technologies can analyze large datasets to predict future demand more accurately and optimize inventory levels, leading to better service and lower costs. […]
            • Future-Proofing Utilities. Advanced Analytics for Supply Chain OptimizationFuture-Proofing Utilities: Advanced Analytics for Supply Chain Optimization
              Utilities in the electrical, natural gas, urban water, and telecommunications fields are all asset-intensive and reliant on physical infrastructure that must be properly maintained, updated, and upgraded over time. Maximizing asset uptime and the reliability of physical infrastructure demands effective inventory management, spare parts forecasting, and supplier management. A utility that executes these processes effectively will outperform its peers, provide better returns for its investors and higher service levels for its customers, while reducing its environmental impact. […]
            • Centering Act Spare Parts Timing Pricing and ReliabilityCentering Act: Spare Parts Timing, Pricing, and Reliability
              In this article, we'll walk you through the process of crafting a spare parts inventory plan that prioritizes availability metrics such as service levels and fill rates while ensuring cost efficiency. We'll focus on an approach to inventory planning called Service Level-Driven Inventory Optimization. Next, we'll discuss how to determine what parts you should include in your inventory and those that might not be necessary. Lastly, we'll explore ways to enhance your service-level-driven inventory plan consistently. […]

              Protect your Demand Planning Process from Regime Change

              The Smart Forecaster

                Pursuing best practices in demand planning,

              forecasting and inventory optimization

              No, not that kind of regime change: Nothing here about cruise missiles and stealth bombers. And no, we’re not talking about the other kind of regime change that hits closer to home: Shuffling the C-Suite at your company.

              “Regime change” has a third meaning that is relevant to your profession as a demand planner or inventory manager. To researchers in economics and finance, regime change means sudden shifts in the very character of a time series of random observations. The random time series in question here is the sequence of daily (or weekly or monthly) demand counts for your products and inventory items.

              Most forecasting software uses statistical algorithms to process historical demand. It may add additional steps, such as incorporating field intelligence from sales people, but everything starts with the demand history of whatever item you must manage.

              The question raised by regime change is, which data do you use? The simple answer is “All of it”, because that leads to the most accurate forecasts — but only if your data world is stable. If your data world is turbulent, then using all the data means you are basing forecasts on bye-gone conditions. In turn, inputting obsolete data into your forecasting algorithms inevitably leads to reduced forecast accuracy.

              Note that dealing with regime change is not the same as dealing with outliers. Outliers are usually one-off exceptions caused by transient events, such as a kink in your supply chain caused by a huge blizzard choking off all transit paths. In contrast, regime change persists over a longer period and is therefore capable of doing more damage to your forecasts. Here’s an analogy: Outliers are about weather, and regime change is about climate.

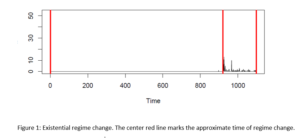
              The most drastic forms of regime change are existential. Figure 1 shows an example of an existential change: There was no demand at all for a long time, then suddenly there was demand. If you had no demand for an item because it didn’t exist but you retain zero demand values in your database, and then the item goes live and you do have sales, the transition from nothing to something is an extreme regime change. Including all those zero demand values from before “Day One” is sure to bias statistical forecasts down below where they should be. The same thing happens if you kill off a product but keep recording zero demand: Including all those recent zeros degrades your demand forecasts.

              In principle, careful record keeping should eliminate these problems. You should record only meaningful zero values. If you have a new item, start recording when it goes live. If you no longer have any demand for an item and expect none, purge it from your database, or at least forecast zero demand.

              Unfortunately, there is a difference between principle and practice. We see many instances in which the data records for both new and dormant items are not properly kept, with “fake zeros” confounded with “real zeros”. This problem is not necessarily the result of incompetence: Usually, it is a byproduct of the scale of the problem, with too few people trying to keep track of too many items.

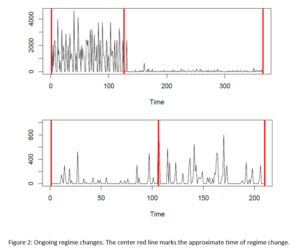
              These existential regime changes are relatively easy to deal with compared to more subtle forms, which appear to afflict more items. Figure 2 shows two examples of regime changes in a pattern of ongoing sales. There are any number of factors that can change the demand for an item: salesforce performance, marketing and advertising efforts, competitor and supplier actions, new customers arising or old customers disappearing, etc. If demand for an item has been chugging along at a steady 1 unit per day but suddenly doubles (or vice versa), that’s a regime change. In the new world order, demand is 2 units/day and forecasts should reflect that. Instead, statistical forecasting algorithms will forecast too little demand if fed all the data, including that from before the regime change.

              How do you protect yourself from regime change? The answer is the same for the cruelest dictator or the most innocent demand planner: Intelligence. And because threats are many, the intelligence is best automated. Modern software systems have the capability to screen tens of thousands of items for signs of regime change. Then the software can call your attention to the problematic items and prompt you to designate which recent data to use in calculations. Or the software can automatically detect and correct for regime change, working quickly at a scale that would easily defeat any busy person working “by hand”.


              Leave a Comment

              Related Posts

              The Supply Chain Blame Game:  Top 3 Excuses for Inventory Shortage and Excess

              The Supply Chain Blame Game: Top 3 Excuses for Inventory Shortage and Excess

              The supply chain has become the blame game for almost any industrial or retail problem. Shortages on lead time variability, bad forecasts, and problems with bad data are facts of life, yet inventory-carrying organizations are often caught by surprise when any of these difficulties arise. So, again, who is to blame for the supply chain chaos? Keep reading this blog and we will try to show you how to prevent product shortages and overstocking.

              Recent Posts

              • Managing Spare Parts Inventory: Best PracticesManaging Spare Parts Inventory: Best Practices
                In this blog, we’ll explore several effective strategies for managing spare parts inventory, emphasizing the importance of optimizing stock levels, maintaining service levels, and using smart tools to aid in decision-making. Managing spare parts inventory is a critical component for businesses that depend on equipment uptime and service reliability. Unlike regular inventory items, spare parts often have unpredictable demand patterns, making them more challenging to manage effectively. An efficient spare parts inventory management system helps prevent stockouts that can lead to operational downtime and costly delays while also avoiding overstocking that unnecessarily ties up capital and increases holding costs. […]
              • 5 Ways to Improve Supply Chain Decision Speed5 Ways to Improve Supply Chain Decision Speed
                The promise of a digital supply chain has transformed how businesses operate. At its core, it can make rapid, data-driven decisions while ensuring quality and efficiency throughout operations. However, it's not just about having access to more data. Organizations need the right tools and platforms to turn that data into actionable insights. This is where decision-making becomes critical, especially in a landscape where new digital supply chain solutions and AI-driven platforms can support you in streamlining many processes within the decision matrix. […]
              • Two employees checking inventory in temporary storage in a distribution warehouse.12 Causes of Overstocking and Practical Solutions
                Managing inventory effectively is critical for maintaining a healthy balance sheet and ensuring that resources are optimally allocated. Here is an in-depth exploration of the main causes of overstocking, their implications, and possible solutions. […]
              • FAQ Mastering Smart IP&O for Better Inventory ManagementFAQ: Mastering Smart IP&O for Better Inventory Management.
                Effective supply chain and inventory management are essential for achieving operational efficiency and customer satisfaction. This blog provides clear and concise answers to some basic and other common questions from our Smart IP&O customers, offering practical insights to overcome typical challenges and enhance your inventory management practices. Focusing on these key areas, we help you transform complex inventory issues into strategic, manageable actions that reduce costs and improve overall performance with Smart IP&O. […]
              • 7 Key Demand Planning Trends Shaping the Future7 Key Demand Planning Trends Shaping the Future
                Demand planning goes beyond simply forecasting product needs; it's about ensuring your business meets customer demands with precision, efficiency, and cost-effectiveness. Latest demand planning technology addresses key challenges like forecast accuracy, inventory management, and market responsiveness. In this blog, we will introduce critical demand planning trends, including data-driven insights, probabilistic forecasting, consensus planning, predictive analytics, scenario modeling, real-time visibility, and multilevel forecasting. These trends will help you stay ahead of the curve, optimize your supply chain, reduce costs, and enhance customer satisfaction, positioning your business for long-term success. […]

                Inventory Optimization for Manufacturers, Distributors, and MRO

                • Managing Spare Parts Inventory: Best PracticesManaging Spare Parts Inventory: Best Practices
                  In this blog, we’ll explore several effective strategies for managing spare parts inventory, emphasizing the importance of optimizing stock levels, maintaining service levels, and using smart tools to aid in decision-making. Managing spare parts inventory is a critical component for businesses that depend on equipment uptime and service reliability. Unlike regular inventory items, spare parts often have unpredictable demand patterns, making them more challenging to manage effectively. An efficient spare parts inventory management system helps prevent stockouts that can lead to operational downtime and costly delays while also avoiding overstocking that unnecessarily ties up capital and increases holding costs. […]
                • Innovating the OEM Aftermarket with AI-Driven Inventory Optimization XLInnovating the OEM Aftermarket with AI-Driven Inventory Optimization
                  The aftermarket sector provides OEMs with a decisive advantage by offering a steady revenue stream and fostering customer loyalty through the reliable and timely delivery of service parts. However, managing inventory and forecasting demand in the aftermarket is fraught with challenges, including unpredictable demand patterns, vast product ranges, and the necessity for quick turnarounds. Traditional methods often fall short due to the complexity and variability of demand in the aftermarket. The latest technologies can analyze large datasets to predict future demand more accurately and optimize inventory levels, leading to better service and lower costs. […]
                • Future-Proofing Utilities. Advanced Analytics for Supply Chain OptimizationFuture-Proofing Utilities: Advanced Analytics for Supply Chain Optimization
                  Utilities in the electrical, natural gas, urban water, and telecommunications fields are all asset-intensive and reliant on physical infrastructure that must be properly maintained, updated, and upgraded over time. Maximizing asset uptime and the reliability of physical infrastructure demands effective inventory management, spare parts forecasting, and supplier management. A utility that executes these processes effectively will outperform its peers, provide better returns for its investors and higher service levels for its customers, while reducing its environmental impact. […]
                • Centering Act Spare Parts Timing Pricing and ReliabilityCentering Act: Spare Parts Timing, Pricing, and Reliability
                  In this article, we'll walk you through the process of crafting a spare parts inventory plan that prioritizes availability metrics such as service levels and fill rates while ensuring cost efficiency. We'll focus on an approach to inventory planning called Service Level-Driven Inventory Optimization. Next, we'll discuss how to determine what parts you should include in your inventory and those that might not be necessary. Lastly, we'll explore ways to enhance your service-level-driven inventory plan consistently. […]

                  Don’t Become a Victim of Your Forecast Models

                  The Smart Forecaster

                   Pursuing best practices in demand planning,

                  forecasting and inventory optimization

                  Quants and Financial Meltdowns

                  I spend much of my time developing new quantitative methods for statistical forecasting, demand forecasting and inventory optimization. For me, this is an engaging way to contribute to society. But I know that the most prudent way to do algorithm development is to stand a little to the side and cast a skeptical eye on my own work.

                  The need for this skepticism was highlighted for me recently as I read Scott Patterson’s book The Quants: How a New Breed of Math Whizzes Conquered Wall Street and Nearly Destroyed It (Crown Publishing, 2010). This book reviewed the “quants” whose complex financial models were largely responsible for the financial meltdown in 2007. As I read along and thought “What was wrong with these guys?” I began to wonder if we supply chain quants were guilty of some of the same sins.

                  Models versus Instincts

                  Generally, the supply chain field has lagged behind finance in terms of the use of statistical models. My university colleagues and I are chipping away at that, but we have a long way to go. Some supply chains are quite technically sophisticated, but many, perhaps more, are essentially managed as much by gut instinct as by the numbers. Is this avoidance of analytics safer than relying on models?

                  What makes gut instinct dangerous is that it is so amorphous. Everyone who works long in a job develops instincts, but longevity is not the same as wisdom. It is possible to learn all the wrong lessons over a long career. It is also possible to miss the chance to learn the right lessons because certain informative scenarios may never arise in one person’s career. It is also possible to have good days and bad days; even gurus can mess up. Gut instinct is also anti-productive, since all decisions have to pass through that one gut, which becomes an enterprise chokepoint. And Golden Guts eventually reach their Golden Years and take their Golden Watch and go off into a Golden Sunset; at that point, whatever expertise had been present has walked out the door.

                  In contrast, models have certain advantages. Relative to gut instinct, models are:

                  • Explicit: The theory of the supply chain operation is exposed for all to see.
                  • Adaptive: Because the theory is visible, it can be reviewed, critiqued, tested against data, and evolved.
                  • Consistent: Models may be more or less true, but they are not subject to day-to-day variability.
                  • Comprehensive: At least potentially, models can accumulate a wide range of empirical experience, including scenarios never encountered during any one person’s career.
                  • Instructive: Models are collections of relationships among variables. If the model’s “guts” are made visible, users can learn about those relationships.

                  Model Error

                  Nevertheless, despite all their virtues, models can also be wrong. In fact, that is a given. A constructive way to live with this is encoded in the famous aphorism by Dr. George Box, one of the best modelers of the last half century: “All models are wrong. Some are useful.”

                  The finance quants’ models were wrong by being oversimplified. They started with a quasi-religious belief in the efficiency of markets and developed statistical models that made certain assumptions that were more likely to be true of the physical world than the financial world. Among these were Normal distributions of changes in asset prices and independence of events across various corners of the market. They also assumed human rationality.

                  It should be a bit alarming that the Normal distribution and independence assumptions also underlie many of the models in supply chain software. In fact, there are alternative models of supply chain dynamics that do not require these simplifying assumptions, so this is an unnecessary risk being run by many, perhaps most, of the users of supply chain software.

                  But even with more robust and realistic model assumptions, there is no denying that model error is a constant risk. So, can you be victimized by your models? Of course you can.

                  Self-Protection: Look at the Data

                  Every supply chain professional who uses models, then, is subject to model risk. But unlike with decisions based on gut feel, decisions based on model calculations can be exposed and compared to real-world outcomes. Repeated checking is the best way to protect against model error, because it not only tests whether the model is realistic but also signals when it is time to update the model.

                  As noted above, a model is a set of functional relationships between key variables. Those relationships have parameters that tune the model to the current operating context. For instance, supply chain models often rely, in part, on estimates of demand volatility. Historical demand data are used to calculate numerical values for these parameters. If demand volatility changes, the model becomes obsolete and likely to produce inapt recommendations. Therefore, good practice demands frequent updates to model parameters.

                  Even when parameter values are current, there may still be trouble due to incorrect functional relationships. For example, consider the relationship between the mean and standard deviation of demand for spare parts. Generally speaking, the greater the average demand, the greater the demand volatility as measured by the standard deviation.

                  Now consider simplified “old school” models that describe spare part demand as a Poisson process. The Poisson process is widely useful and relatively simple, so it often shows up in Statistics 101 classes. Because of their relative simplicity, Poisson models are the white rats of supply chain analytics for spare parts, i.e., people do computer experiments and theory development based on the behavior of Poisson models of demand. For Poisson models, the standard deviation of demand equals the square root of the mean. However, when we look at our customers’ actual demand data, we discover that the actual relationship between the mean and standard deviation of demand is better described by a more general power-law relationship. Thus, the simple model may use accurate estimates of mean and standard deviation but still not accurately reflect their relationship. This in turn leads to incorrect recommendations about reorder points for spare parts. Checking real data is the best antidote to cavalier assumption-making.


                  What to Do Next

                  I do not sense that today’s supply chain models are on the brink of creating the kind of meltdown we saw in the start of the Great Recession. But those of us who are supply chain quants need to show more professional maturity than our financial colleagues. We need to not fall in love with our models, and we need to alert our customers to correct model hygiene.

                  So, model users, wash your hands frequently as we begin flu season, and wash your models thoroughly through hard data to be sure that the models you rely on are both up-to-date and grounded in reality. Both those steps will protect you from being victimized by your models and let you exploit their advantages over management by gut feel.

                  Appendix: Technical Tips

                  Supply chain analytics provide various types of outputs. In the realm of forecasting and demand planning, the obvious empirical check is to compare forecasts against the actual demand values that eventually reveal themselves. This same “forecast then check” approach can also be used in the generation of forecasts.  In the realm of inventory management, the models can build on forecasts to recommend policy choices, such as reorder points and order quantities or Min and Max values. There is a smart way to confirm the accuracy of recommendations of reorder points and Min’s.  See our blog The Right Forecast Accuracy Metric for Inventory Planning


                  Leave a Comment

                  Related Posts

                  The Supply Chain Blame Game:  Top 3 Excuses for Inventory Shortage and Excess

                  The Supply Chain Blame Game: Top 3 Excuses for Inventory Shortage and Excess

                  The supply chain has become the blame game for almost any industrial or retail problem. Shortages on lead time variability, bad forecasts, and problems with bad data are facts of life, yet inventory-carrying organizations are often caught by surprise when any of these difficulties arise. So, again, who is to blame for the supply chain chaos? Keep reading this blog and we will try to show you how to prevent product shortages and overstocking.

                  Recent Posts

                  • Managing Spare Parts Inventory: Best PracticesManaging Spare Parts Inventory: Best Practices
                    In this blog, we’ll explore several effective strategies for managing spare parts inventory, emphasizing the importance of optimizing stock levels, maintaining service levels, and using smart tools to aid in decision-making. Managing spare parts inventory is a critical component for businesses that depend on equipment uptime and service reliability. Unlike regular inventory items, spare parts often have unpredictable demand patterns, making them more challenging to manage effectively. An efficient spare parts inventory management system helps prevent stockouts that can lead to operational downtime and costly delays while also avoiding overstocking that unnecessarily ties up capital and increases holding costs. […]
                  • 5 Ways to Improve Supply Chain Decision Speed5 Ways to Improve Supply Chain Decision Speed
                    The promise of a digital supply chain has transformed how businesses operate. At its core, it can make rapid, data-driven decisions while ensuring quality and efficiency throughout operations. However, it's not just about having access to more data. Organizations need the right tools and platforms to turn that data into actionable insights. This is where decision-making becomes critical, especially in a landscape where new digital supply chain solutions and AI-driven platforms can support you in streamlining many processes within the decision matrix. […]
                  • Two employees checking inventory in temporary storage in a distribution warehouse.12 Causes of Overstocking and Practical Solutions
                    Managing inventory effectively is critical for maintaining a healthy balance sheet and ensuring that resources are optimally allocated. Here is an in-depth exploration of the main causes of overstocking, their implications, and possible solutions. […]
                  • FAQ Mastering Smart IP&O for Better Inventory ManagementFAQ: Mastering Smart IP&O for Better Inventory Management.
                    Effective supply chain and inventory management are essential for achieving operational efficiency and customer satisfaction. This blog provides clear and concise answers to some basic and other common questions from our Smart IP&O customers, offering practical insights to overcome typical challenges and enhance your inventory management practices. Focusing on these key areas, we help you transform complex inventory issues into strategic, manageable actions that reduce costs and improve overall performance with Smart IP&O. […]
                  • 7 Key Demand Planning Trends Shaping the Future7 Key Demand Planning Trends Shaping the Future
                    Demand planning goes beyond simply forecasting product needs; it's about ensuring your business meets customer demands with precision, efficiency, and cost-effectiveness. Latest demand planning technology addresses key challenges like forecast accuracy, inventory management, and market responsiveness. In this blog, we will introduce critical demand planning trends, including data-driven insights, probabilistic forecasting, consensus planning, predictive analytics, scenario modeling, real-time visibility, and multilevel forecasting. These trends will help you stay ahead of the curve, optimize your supply chain, reduce costs, and enhance customer satisfaction, positioning your business for long-term success. […]

                    Inventory Optimization for Manufacturers, Distributors, and MRO

                    • Managing Spare Parts Inventory: Best PracticesManaging Spare Parts Inventory: Best Practices
                      In this blog, we’ll explore several effective strategies for managing spare parts inventory, emphasizing the importance of optimizing stock levels, maintaining service levels, and using smart tools to aid in decision-making. Managing spare parts inventory is a critical component for businesses that depend on equipment uptime and service reliability. Unlike regular inventory items, spare parts often have unpredictable demand patterns, making them more challenging to manage effectively. An efficient spare parts inventory management system helps prevent stockouts that can lead to operational downtime and costly delays while also avoiding overstocking that unnecessarily ties up capital and increases holding costs. […]
                    • Innovating the OEM Aftermarket with AI-Driven Inventory Optimization XLInnovating the OEM Aftermarket with AI-Driven Inventory Optimization
                      The aftermarket sector provides OEMs with a decisive advantage by offering a steady revenue stream and fostering customer loyalty through the reliable and timely delivery of service parts. However, managing inventory and forecasting demand in the aftermarket is fraught with challenges, including unpredictable demand patterns, vast product ranges, and the necessity for quick turnarounds. Traditional methods often fall short due to the complexity and variability of demand in the aftermarket. The latest technologies can analyze large datasets to predict future demand more accurately and optimize inventory levels, leading to better service and lower costs. […]
                    • Future-Proofing Utilities. Advanced Analytics for Supply Chain OptimizationFuture-Proofing Utilities: Advanced Analytics for Supply Chain Optimization
                      Utilities in the electrical, natural gas, urban water, and telecommunications fields are all asset-intensive and reliant on physical infrastructure that must be properly maintained, updated, and upgraded over time. Maximizing asset uptime and the reliability of physical infrastructure demands effective inventory management, spare parts forecasting, and supplier management. A utility that executes these processes effectively will outperform its peers, provide better returns for its investors and higher service levels for its customers, while reducing its environmental impact. […]
                    • Centering Act Spare Parts Timing Pricing and ReliabilityCentering Act: Spare Parts Timing, Pricing, and Reliability
                      In this article, we'll walk you through the process of crafting a spare parts inventory plan that prioritizes availability metrics such as service levels and fill rates while ensuring cost efficiency. We'll focus on an approach to inventory planning called Service Level-Driven Inventory Optimization. Next, we'll discuss how to determine what parts you should include in your inventory and those that might not be necessary. Lastly, we'll explore ways to enhance your service-level-driven inventory plan consistently. […]