Most demand forecasts are partial or incomplete: They provide only one single number: the most likely value of future demand. This is called a point forecast. Usually, the point forecast estimates the average value of future demand.
Much more useful is a forecast of full probability distribution of demand at any future time. This is more commonly referred to as probability forecasting and is much more useful.
The Average is Not the Answer
The one advantage of a point forecast is its simplicity. If your ERP system is also simple, the point forecast fills in the one number needed by the ERP system to do workforce scheduling or raw material purchases.
The disadvantage of a point forecast is that it is too simple. It ignores additional information in an item’s demand history that can give you a more complete picture of how demand might unfold: a probability forecast.
Going Beyond the Average: Probability Forecasting
While the point forecast provides limited information, e.g., “The most likely demand next month is 15 units”, the probability forecast adds crucial information, e.g., “There is a 20% chance that demand will exceed 28 units and a 10% chance that it will be less than 5 units”.
This information lets you do risk assessment and contingency planning. Contingency planning is necessary because the point forecast usually has only a small chance of actually being correct. A probability forecast may also say “The chance of demand being 15 units is only 10%, even though it is the single most likely value.” In other words, there is a 90% chance that the point forecast is wrong. This kind of error is not a mistake in the forecasting calculations: it is the reality of dealing with demand volatility. It might better be called an “uncertainty” than an “error”.
An operations manager can use the extra information in a probability forecast in both informal and formal ways. Informally, even if an ERP system requires a single-number forecast as input, a wise manager will want to have some clue about the risks associated with that point forecast, i.e., its margin of error. So a forecast of 15 ± 1 unit is a lot safer than a forecast of 15 ± 10. The ± part is a compression of a probabilistic forecast. Figure 1 below shows an item’s demand history (red line), point forecasts for the next 12 months (green line) and their margins of error (cyan lines). The lowest forecast of about 3,300 units occurs in June, but the actual demand might be as much as 800 units higher or lower.
Bonus: Application to Inventory Management
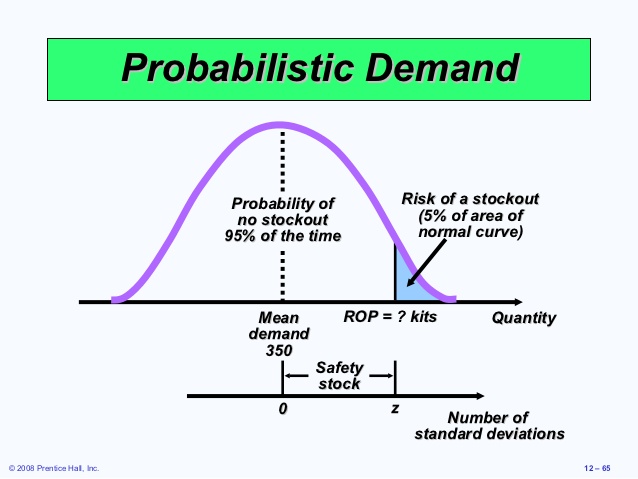
Inventory management requires that you balance item availability against the inventory cost. It turns out that knowing the full probability distribution of demand over a replenishment lead time is essential for setting reorder points (also called mins) on a rational, scientific basis. Figure 2 shows a probability forecast of total demand during the 33 week replenishment lead time for a certain spare part. While the average lead time demand is 3 units, the most likely demand is zero, and a reorder point of 14 is needed to insure that the chance of stocking out is only 1%. Once again, the average is not the answer.
Knowing more is always better than knowing less and the probability forecast provides that extra bit of crucial information. Software has been able to supply a point forecast for over 40 years, but modern software can do better and provide the whole picture.
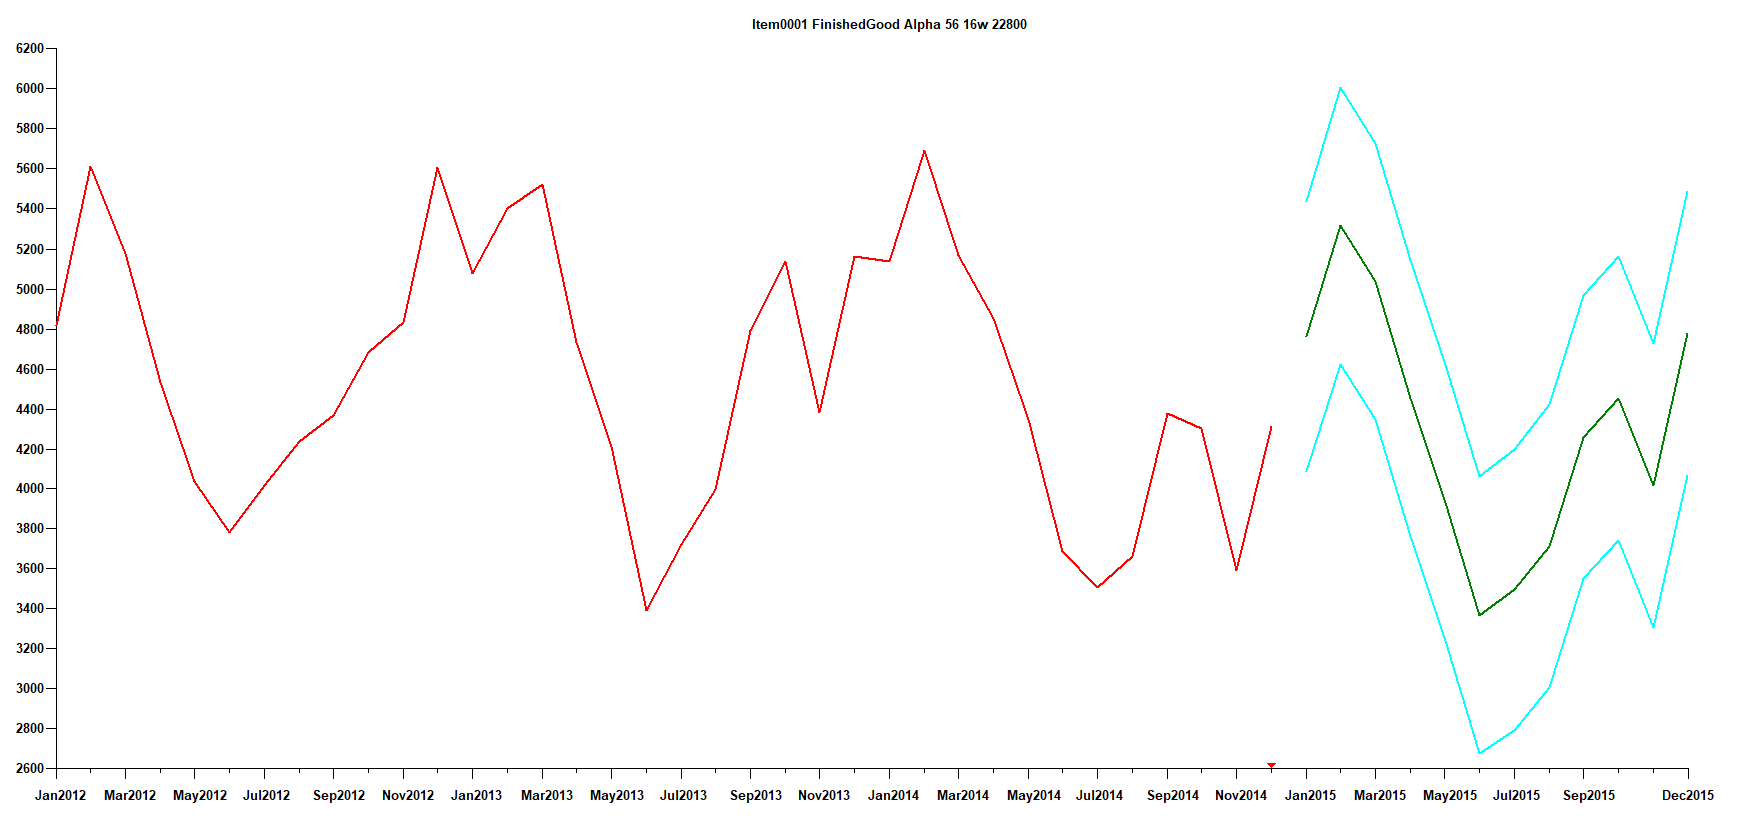
Figure 1: The red line shows the demand history of a finished good. The green line shows the point forecasts for the next 12 months. The blue lines indicate the margins of error in the 12 point forecasts.
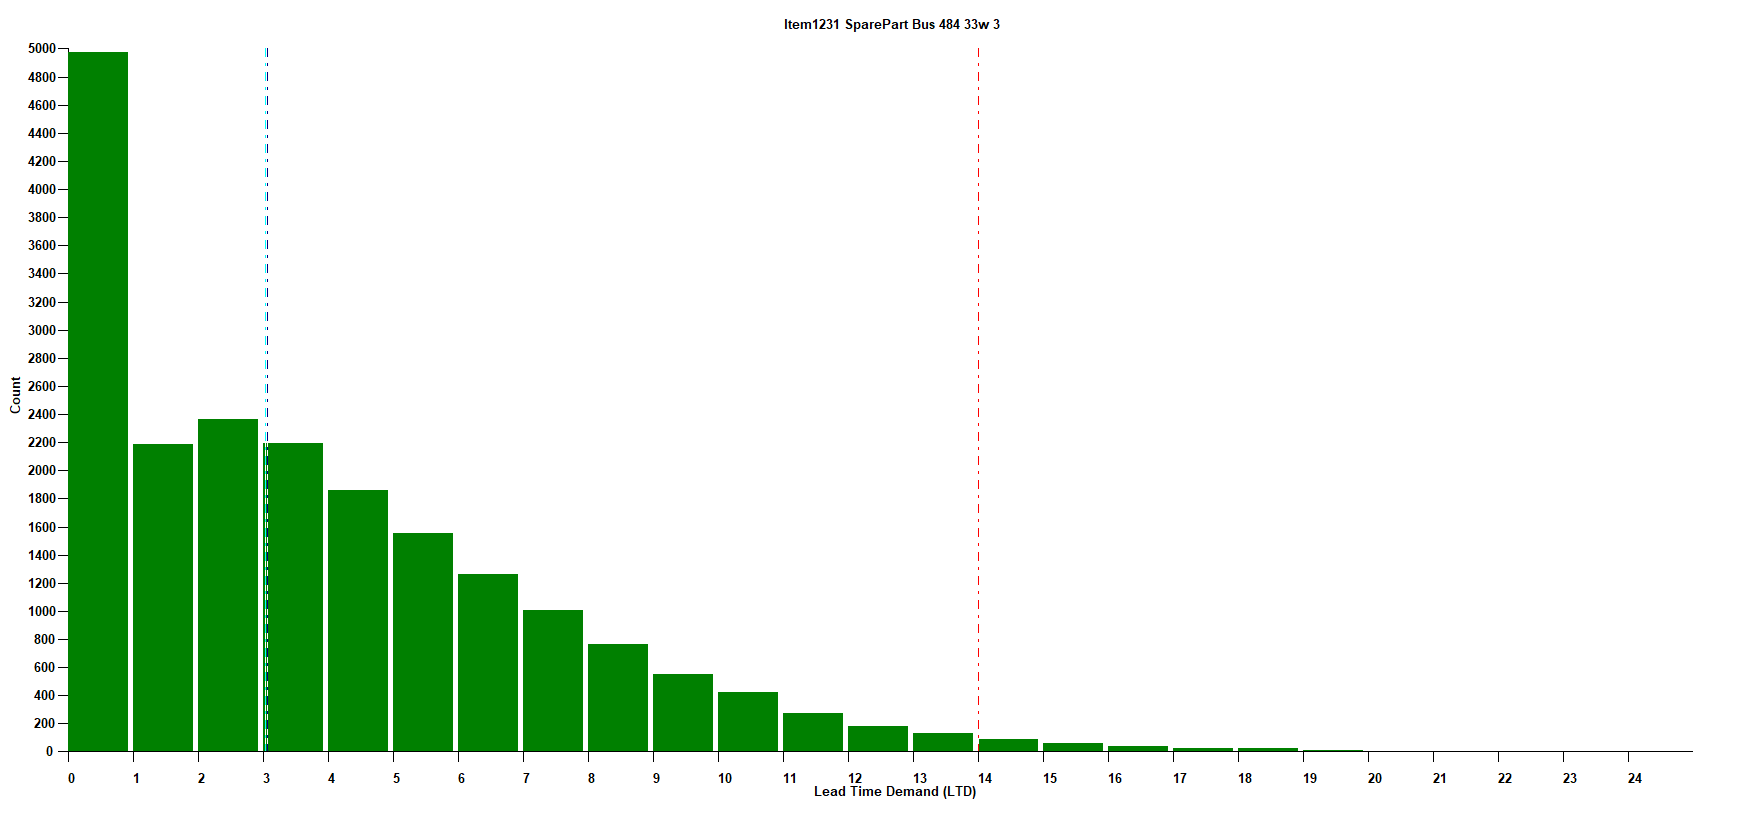
Figure 2: A probabilistic forecast of demand for a spare part over a 33 week replenishment lead time. The most likely demand is zero, the average demand is 3, but a reorder point of 14 units is required to have only a 1% chance of stock out.

Related Posts

Make AI-Driven Inventory Optimization an Ally for Your Organization
In this blog, we will explore how organizations can achieve exceptional efficiency and accuracy with AI-driven inventory optimization. Traditional inventory management methods often fall short due to their reactive nature and reliance on manual processes. Maintaining optimal inventory levels is fundamental for meeting customer demand while minimizing costs. The introduction of AI-driven inventory optimization can significantly reduce the burden of manual processes, providing relief to supply chain managers from tedious tasks.

Daily Demand Scenarios
In this Videoblog, we will explain how time series forecasting has emerged as a pivotal tool, particularly at the daily level, which Smart Software has been pioneering since its inception over forty years ago. The evolution of business practices from annual to more refined temporal increments like monthly and now daily data analysis illustrates a significant shift in operational strategies.

Constructive Play with Digital Twins
Those of you who track hot topics will be familiar with the term “digital twin.” Those who have been too busy with work may want to read on and catch up. While there are several definitions of digital twin, here’s one that works well: A digital twin is a dynamic virtual copy of a physical asset, process, system, or environment that looks like and behaves identically to its real-world counterpart. A digital twin ingests data and replicates processes so you can predict possible performance outcomes and issues that the real-world product might undergo.
Recent Posts
 Forecast-Based Inventory Management for Better PlanningForecast-based inventory management, or MRP (Material Requirements Planning) logic, is a forward-planning method that helps businesses meet demand without overstocking or understocking. By anticipating demand and adjusting inventory levels, it maintains a balance between meeting customer needs and minimizing excess inventory costs. This approach optimizes operations, reduces waste, and enhances customer satisfaction. […]
 Make AI-Driven Inventory Optimization an Ally for Your OrganizationIn this blog, we will explore how organizations can achieve exceptional efficiency and accuracy with AI-driven inventory optimization. Traditional inventory management methods often fall short due to their reactive nature and reliance on manual processes. Maintaining optimal inventory levels is fundamental for meeting customer demand while minimizing costs. The introduction of AI-driven inventory optimization can significantly reduce the burden of manual processes, providing relief to supply chain managers from tedious tasks. […]
 The Importance of Clear Service Level Definitions in Inventory ManagementInventory optimization software that supports what-if analysis will expose the tradeoff of stockouts vs. excess costs of varying service level targets. But first it is important to identify how “service levels” is interpreted, measured, and reported. This will avoid miscommunication and the false sense of security that can develop when less stringent definitions are used. Clearly defining how service level is calculated puts all stakeholders on the same page. This facilitates better decision-making. […]
 Future-Proofing Utilities: Advanced Analytics for Supply Chain OptimizationUtilities in the electrical, natural gas, urban water, and telecommunications fields are all asset-intensive and reliant on physical infrastructure that must be properly maintained, updated, and upgraded over time. Maximizing asset uptime and the reliability of physical infrastructure demands effective inventory management, spare parts forecasting, and supplier management. A utility that executes these processes effectively will outperform its peers, provide better returns for its investors and higher service levels for its customers, while reducing its environmental impact. […]
 The Cost of Spreadsheet PlanningCompanies that depend on spreadsheets for demand planning, forecasting, and inventory management are often constrained by the spreadsheet’s inherent limitations. This post examines the drawbacks of traditional inventory management approaches caused by spreadsheets and their associated costs, contrasting these with the significant benefits gained from embracing state-of-the-art planning technologies. […]

Inventory Optimization for Manufacturers, Distributors, and MRO
- Future-Proofing Utilities: Advanced Analytics for Supply Chain OptimizationUtilities in the electrical, natural gas, urban water, and telecommunications fields are all asset-intensive and reliant on physical infrastructure that must be properly maintained, updated, and upgraded over time. Maximizing asset uptime and the reliability of physical infrastructure demands effective inventory management, spare parts forecasting, and supplier management. A utility that executes these processes effectively will outperform its peers, provide better returns for its investors and higher service levels for its customers, while reducing its environmental impact. […]
 Centering Act: Spare Parts Timing, Pricing, and ReliabilityIn this article, we'll walk you through the process of crafting a spare parts inventory plan that prioritizes availability metrics such as service levels and fill rates while ensuring cost efficiency. We'll focus on an approach to inventory planning called Service Level-Driven Inventory Optimization. Next, we'll discuss how to determine what parts you should include in your inventory and those that might not be necessary. Lastly, we'll explore ways to enhance your service-level-driven inventory plan consistently. […]
 Why MRO Businesses Need Add-on Service Parts Planning & Inventory SoftwareMRO organizations exist in a wide range of industries, including public transit, electrical utilities, wastewater, hydro power, aviation, and mining. To get their work done, MRO professionals use Enterprise Asset Management (EAM) and Enterprise Resource Planning (ERP) systems. These systems are designed to do a lot of jobs. Given their features, cost, and extensive implementation requirements, there is an assumption that EAM and ERP systems can do it all. In this post, we summarize the need for add-on software that addresses specialized analytics for inventory optimization, forecasting, and service parts planning. […]
 5 Steps to Improve the Financial Impact of Spare Parts PlanningIn today’s competitive business landscape, companies are constantly seeking ways to improve their operational efficiency and drive increased revenue. Optimizing service parts management is an often-overlooked aspect that can have a significant financial impact. Companies can improve overall efficiency and generate significant financial returns by effectively managing spare parts inventory. This article will explore the economic implications of optimized service parts management and how investing in Inventory Optimization and Demand Planning Software can provide a competitive advantage. […]
