
No, not that kind of regime change: Nothing here about cruise missiles and stealth bombers. And no, we’re not talking about the other kind of regime change that hits closer to home: Shuffling the C-Suite at your company.
“Regime change” has a third meaning that is relevant to your profession as a demand planner or inventory manager. To researchers in economics and finance, regime change means sudden shifts in the very character of a time series of random observations. The random time series in question here is the sequence of daily (or weekly or monthly) demand counts for your products and inventory items.
Most forecasting software uses statistical algorithms to process historical demand. It may add additional steps, such as incorporating field intelligence from sales people, but everything starts with the demand history of whatever item you must manage.
The question raised by regime change is, which data do you use? The simple answer is “All of it”, because that leads to the most accurate forecasts — but only if your data world is stable. If your data world is turbulent, then using all the data means you are basing forecasts on bye-gone conditions. In turn, inputting obsolete data into your forecasting algorithms inevitably leads to reduced forecast accuracy.
Note that dealing with regime change is not the same as dealing with outliers. Outliers are usually one-off exceptions caused by transient events, such as a kink in your supply chain caused by a huge blizzard choking off all transit paths. In contrast, regime change persists over a longer period and is therefore capable of doing more damage to your forecasts. Here’s an analogy: Outliers are about weather, and regime change is about climate.
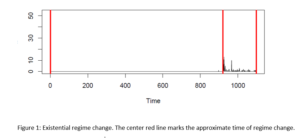
The most drastic forms of regime change are existential. Figure 1 shows an example of an existential change: There was no demand at all for a long time, then suddenly there was demand. If you had no demand for an item because it didn’t exist but you retain zero demand values in your database, and then the item goes live and you do have sales, the transition from nothing to something is an extreme regime change. Including all those zero demand values from before “Day One” is sure to bias statistical forecasts down below where they should be. The same thing happens if you kill off a product but keep recording zero demand: Including all those recent zeros degrades your demand forecasts.
In principle, careful record keeping should eliminate these problems. You should record only meaningful zero values. If you have a new item, start recording when it goes live. If you no longer have any demand for an item and expect none, purge it from your database, or at least forecast zero demand.
Unfortunately, there is a difference between principle and practice. We see many instances in which the data records for both new and dormant items are not properly kept, with “fake zeros” confounded with “real zeros”. This problem is not necessarily the result of incompetence: Usually, it is a byproduct of the scale of the problem, with too few people trying to keep track of too many items.
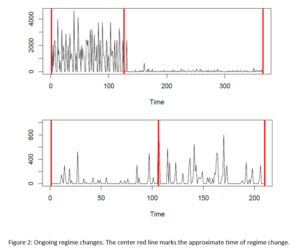
These existential regime changes are relatively easy to deal with compared to more subtle forms, which appear to afflict more items. Figure 2 shows two examples of regime changes in a pattern of ongoing sales. There are any number of factors that can change the demand for an item: salesforce performance, marketing and advertising efforts, competitor and supplier actions, new customers arising or old customers disappearing, etc. If demand for an item has been chugging along at a steady 1 unit per day but suddenly doubles (or vice versa), that’s a regime change. In the new world order, demand is 2 units/day and forecasts should reflect that. Instead, statistical forecasting algorithms will forecast too little demand if fed all the data, including that from before the regime change.
How do you protect yourself from regime change? The answer is the same for the cruelest dictator or the most innocent demand planner: Intelligence. And because threats are many, the intelligence is best automated. Modern software systems have the capability to screen tens of thousands of items for signs of regime change. Then the software can call your attention to the problematic items and prompt you to designate which recent data to use in calculations. Or the software can automatically detect and correct for regime change, working quickly at a scale that would easily defeat any busy person working “by hand”.

Related Posts

Forecast-Based Inventory Management for Better Planning
Forecast-based inventory management, or MRP (Material Requirements Planning) logic, is a forward-planning method that helps businesses meet demand without overstocking or understocking. By anticipating demand and adjusting inventory levels, it maintains a balance between meeting customer needs and minimizing excess inventory costs. This approach optimizes operations, reduces waste, and enhances customer satisfaction.

Make AI-Driven Inventory Optimization an Ally for Your Organization
In this blog, we will explore how organizations can achieve exceptional efficiency and accuracy with AI-driven inventory optimization. Traditional inventory management methods often fall short due to their reactive nature and reliance on manual processes. Maintaining optimal inventory levels is fundamental for meeting customer demand while minimizing costs. The introduction of AI-driven inventory optimization can significantly reduce the burden of manual processes, providing relief to supply chain managers from tedious tasks.

The Importance of Clear Service Level Definitions in Inventory Management
Inventory optimization software that supports what-if analysis will expose the tradeoff of stockouts vs. excess costs of varying service level targets. But first it is important to identify how “service levels” is interpreted, measured, and reported. This will avoid miscommunication and the false sense of security that can develop when less stringent definitions are used. Clearly defining how service level is calculated puts all stakeholders on the same page. This facilitates better decision-making.
Recent Posts
 Forecast-Based Inventory Management for Better PlanningForecast-based inventory management, or MRP (Material Requirements Planning) logic, is a forward-planning method that helps businesses meet demand without overstocking or understocking. By anticipating demand and adjusting inventory levels, it maintains a balance between meeting customer needs and minimizing excess inventory costs. This approach optimizes operations, reduces waste, and enhances customer satisfaction. […]
 Make AI-Driven Inventory Optimization an Ally for Your OrganizationIn this blog, we will explore how organizations can achieve exceptional efficiency and accuracy with AI-driven inventory optimization. Traditional inventory management methods often fall short due to their reactive nature and reliance on manual processes. Maintaining optimal inventory levels is fundamental for meeting customer demand while minimizing costs. The introduction of AI-driven inventory optimization can significantly reduce the burden of manual processes, providing relief to supply chain managers from tedious tasks. […]
 The Importance of Clear Service Level Definitions in Inventory ManagementInventory optimization software that supports what-if analysis will expose the tradeoff of stockouts vs. excess costs of varying service level targets. But first it is important to identify how “service levels” is interpreted, measured, and reported. This will avoid miscommunication and the false sense of security that can develop when less stringent definitions are used. Clearly defining how service level is calculated puts all stakeholders on the same page. This facilitates better decision-making. […]
 Future-Proofing Utilities: Advanced Analytics for Supply Chain OptimizationUtilities in the electrical, natural gas, urban water, and telecommunications fields are all asset-intensive and reliant on physical infrastructure that must be properly maintained, updated, and upgraded over time. Maximizing asset uptime and the reliability of physical infrastructure demands effective inventory management, spare parts forecasting, and supplier management. A utility that executes these processes effectively will outperform its peers, provide better returns for its investors and higher service levels for its customers, while reducing its environmental impact. […]
 The Cost of Spreadsheet PlanningCompanies that depend on spreadsheets for demand planning, forecasting, and inventory management are often constrained by the spreadsheet’s inherent limitations. This post examines the drawbacks of traditional inventory management approaches caused by spreadsheets and their associated costs, contrasting these with the significant benefits gained from embracing state-of-the-art planning technologies. […]

Inventory Optimization for Manufacturers, Distributors, and MRO
- Future-Proofing Utilities: Advanced Analytics for Supply Chain OptimizationUtilities in the electrical, natural gas, urban water, and telecommunications fields are all asset-intensive and reliant on physical infrastructure that must be properly maintained, updated, and upgraded over time. Maximizing asset uptime and the reliability of physical infrastructure demands effective inventory management, spare parts forecasting, and supplier management. A utility that executes these processes effectively will outperform its peers, provide better returns for its investors and higher service levels for its customers, while reducing its environmental impact. […]
 Centering Act: Spare Parts Timing, Pricing, and ReliabilityIn this article, we'll walk you through the process of crafting a spare parts inventory plan that prioritizes availability metrics such as service levels and fill rates while ensuring cost efficiency. We'll focus on an approach to inventory planning called Service Level-Driven Inventory Optimization. Next, we'll discuss how to determine what parts you should include in your inventory and those that might not be necessary. Lastly, we'll explore ways to enhance your service-level-driven inventory plan consistently. […]
 Why MRO Businesses Need Add-on Service Parts Planning & Inventory SoftwareMRO organizations exist in a wide range of industries, including public transit, electrical utilities, wastewater, hydro power, aviation, and mining. To get their work done, MRO professionals use Enterprise Asset Management (EAM) and Enterprise Resource Planning (ERP) systems. These systems are designed to do a lot of jobs. Given their features, cost, and extensive implementation requirements, there is an assumption that EAM and ERP systems can do it all. In this post, we summarize the need for add-on software that addresses specialized analytics for inventory optimization, forecasting, and service parts planning. […]
 5 Steps to Improve the Financial Impact of Spare Parts PlanningIn today’s competitive business landscape, companies are constantly seeking ways to improve their operational efficiency and drive increased revenue. Optimizing service parts management is an often-overlooked aspect that can have a significant financial impact. Companies can improve overall efficiency and generate significant financial returns by effectively managing spare parts inventory. This article will explore the economic implications of optimized service parts management and how investing in Inventory Optimization and Demand Planning Software can provide a competitive advantage. […]