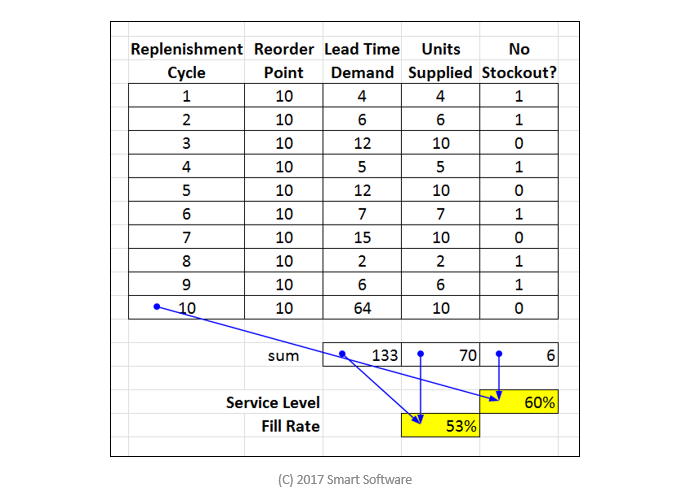
Service Level vs Fill Rate

We are often asked what the difference is between these two important performance metrics for inventory planning. While they are both important for measuring how successful a business is in meeting demand, their meaning is very different. If not understood and incorporated into the strategic inventory planning process, inventory will be inefficiently allocated resulting in lower customer service and higher carrying costs. We’ve illustrated the difference in this 4 minute recording using Microsoft Excel.
 Smart Operational Analytics automatically calculates historical service levels & fill rates across any item. To see how you calculate these and other operational metrics including inventory turns, supplier performance, and more register below to watch a five minute demonstration. The demo will show how our cloud platform continuously calculates and reports these metrics across thousands of items helping you identify opportunities for service level improvement and inventory reduction.
Related Posts

Managing Spare Parts Inventory: Best Practices
In this blog, we’ll explore several effective strategies for managing spare parts inventory, emphasizing the importance of optimizing stock levels, maintaining service levels, and using smart tools to aid in decision-making. Managing spare parts inventory is a critical component for businesses that depend on equipment uptime and service reliability. Unlike regular inventory items, spare parts often have unpredictable demand patterns, making them more challenging to manage effectively. An efficient spare parts inventory management system helps prevent stockouts that can lead to operational downtime and costly delays while also avoiding overstocking that unnecessarily ties up capital and increases holding costs.

12 Causes of Overstocking and Practical Solutions
Managing inventory effectively is critical for maintaining a healthy balance sheet and ensuring that resources are optimally allocated. Here is an in-depth exploration of the main causes of overstocking, their implications, and possible solutions.

FAQ: Mastering Smart IP&O for Better Inventory Management.
Effective supply chain and inventory management are essential for achieving operational efficiency and customer satisfaction. This blog provides clear and concise answers to some basic and other common questions from our Smart IP&O customers, offering practical insights to overcome typical challenges and enhance your inventory management practices. Focusing on these key areas, we help you transform complex inventory issues into strategic, manageable actions that reduce costs and improve overall performance with Smart IP&O.
Recent Posts
 Managing Spare Parts Inventory: Best PracticesIn this blog, we’ll explore several effective strategies for managing spare parts inventory, emphasizing the importance of optimizing stock levels, maintaining service levels, and using smart tools to aid in decision-making. Managing spare parts inventory is a critical component for businesses that depend on equipment uptime and service reliability. Unlike regular inventory items, spare parts often have unpredictable demand patterns, making them more challenging to manage effectively. An efficient spare parts inventory management system helps prevent stockouts that can lead to operational downtime and costly delays while also avoiding overstocking that unnecessarily ties up capital and increases holding costs. […]
 5 Ways to Improve Supply Chain Decision SpeedThe promise of a digital supply chain has transformed how businesses operate. At its core, it can make rapid, data-driven decisions while ensuring quality and efficiency throughout operations. However, it's not just about having access to more data. Organizations need the right tools and platforms to turn that data into actionable insights. This is where decision-making becomes critical, especially in a landscape where new digital supply chain solutions and AI-driven platforms can support you in streamlining many processes within the decision matrix. […]
 12 Causes of Overstocking and Practical SolutionsManaging inventory effectively is critical for maintaining a healthy balance sheet and ensuring that resources are optimally allocated. Here is an in-depth exploration of the main causes of overstocking, their implications, and possible solutions. […]
 FAQ: Mastering Smart IP&O for Better Inventory Management.Effective supply chain and inventory management are essential for achieving operational efficiency and customer satisfaction. This blog provides clear and concise answers to some basic and other common questions from our Smart IP&O customers, offering practical insights to overcome typical challenges and enhance your inventory management practices. Focusing on these key areas, we help you transform complex inventory issues into strategic, manageable actions that reduce costs and improve overall performance with Smart IP&O. […]
 7 Key Demand Planning Trends Shaping the FutureDemand planning goes beyond simply forecasting product needs; it's about ensuring your business meets customer demands with precision, efficiency, and cost-effectiveness. Latest demand planning technology addresses key challenges like forecast accuracy, inventory management, and market responsiveness. In this blog, we will introduce critical demand planning trends, including data-driven insights, probabilistic forecasting, consensus planning, predictive analytics, scenario modeling, real-time visibility, and multilevel forecasting. These trends will help you stay ahead of the curve, optimize your supply chain, reduce costs, and enhance customer satisfaction, positioning your business for long-term success. […]

Inventory Optimization for Manufacturers, Distributors, and MRO
- Managing Spare Parts Inventory: Best PracticesIn this blog, we’ll explore several effective strategies for managing spare parts inventory, emphasizing the importance of optimizing stock levels, maintaining service levels, and using smart tools to aid in decision-making. Managing spare parts inventory is a critical component for businesses that depend on equipment uptime and service reliability. Unlike regular inventory items, spare parts often have unpredictable demand patterns, making them more challenging to manage effectively. An efficient spare parts inventory management system helps prevent stockouts that can lead to operational downtime and costly delays while also avoiding overstocking that unnecessarily ties up capital and increases holding costs. […]
 Innovating the OEM Aftermarket with AI-Driven Inventory OptimizationThe aftermarket sector provides OEMs with a decisive advantage by offering a steady revenue stream and fostering customer loyalty through the reliable and timely delivery of service parts. However, managing inventory and forecasting demand in the aftermarket is fraught with challenges, including unpredictable demand patterns, vast product ranges, and the necessity for quick turnarounds. Traditional methods often fall short due to the complexity and variability of demand in the aftermarket. The latest technologies can analyze large datasets to predict future demand more accurately and optimize inventory levels, leading to better service and lower costs. […]
 Future-Proofing Utilities: Advanced Analytics for Supply Chain OptimizationUtilities in the electrical, natural gas, urban water, and telecommunications fields are all asset-intensive and reliant on physical infrastructure that must be properly maintained, updated, and upgraded over time. Maximizing asset uptime and the reliability of physical infrastructure demands effective inventory management, spare parts forecasting, and supplier management. A utility that executes these processes effectively will outperform its peers, provide better returns for its investors and higher service levels for its customers, while reducing its environmental impact. […]
 Centering Act: Spare Parts Timing, Pricing, and ReliabilityIn this article, we'll walk you through the process of crafting a spare parts inventory plan that prioritizes availability metrics such as service levels and fill rates while ensuring cost efficiency. We'll focus on an approach to inventory planning called Service Level-Driven Inventory Optimization. Next, we'll discuss how to determine what parts you should include in your inventory and those that might not be necessary. Lastly, we'll explore ways to enhance your service-level-driven inventory plan consistently. […]