Extend Epicor Prophet 21 with Smart IP&O’s Forecasting & Dynamic Reorder Point Planning

In this article, we will review the inventory ordering functionality in Epicor P21, explain its limitations, and summarize how Smart Inventory Planning & Optimization (Smart IP&O) can help reduce inventory, minimize stock-outs and restore your organization’s trust in your ERP by providing robust predictive analytics, consensus-based forecasting, and what-if scenario planning.

Replenishment Planning Features within Epicor Prophet 21
Epicor P21 can manage replenishment by suggesting what to order and when via reorder point-based or forecast-driven inventory policies.  Users may compute these policies externally or generate them dynamically within P21.  Once the policies and forecasts have been specified, P21’s Purchase Order Requirements Generator (PORG) will create automated order suggestions of what to replenish and when by reconciling incoming supply, current on hand, outgoing demand, stocking policies, and demand forecasts.

Epicor P21 has 4 Replenishment Methods
In the item maintenance screen of Epicor P21, users can choose from one of four replenishment methods for each stock item.

  1. Min/Max
  2. Order Point/Order Quantity
  3. EOQ
  4. Up To

There are additional settings and configurations for determining lead times and accounting for order modifiers such as supplier-imposed minimum and maximum order quantities.  Min/Max and Order Point/Order Quantity are considered “static” policies.  EOQ and Up To are considered “dynamic” policies and computed within P21.

Min/Max
The reorder point is equal to the Min.  Whenever on hand inventory drops below the Min (reorder point) the PORG report will create an order suggestion up to the Max (for example, if on hand after the breach is 20 units and the Max is 100 then the order quantity will be 80).  Min/Max is considered a static policy and once entered into P21 will remain unchanged unless overridden by the user.  Users often run spreadsheets to compute the Min/Max values and update them from time to time.

Order Point/Order Quantity
This is the same as the Min/Max policy except instead of ordering up to the Max, an order will be suggested for a fixed quantity defined by the user (for example, always order 100 units when the order point is breached). OP/OQ is considered a static policy and will remain unchanged unless overridden by the user.  Users often run spreadsheets to compute OP/OQ values and update them from time to time.

EOQ
The EOQ policy is a reorder point-based method.  The reorder point is dynamically generated based on P21’s forecast of demand over lead time + demand over the review period + safety stock.  The order quantity is based on an Economic Order Quantity calculation that considers holding costs and ordering costs and attempts to recommend an order size that minimizes total cost.  When on hand inventory breaches the reorder point, the PORG report will kick out an order equal to the computed EOQ.

Up To
The Up To method is another dynamic policy that relies on a reorder point.  It is computed the same way as the EOQ method using P21’s forecasted demand over the lead time + demand over review period + safety stock.   The order quantity suggestion is based on whatever is needed to replenish stock back “up to” the reorder point.  This tends to equate to an order quantity that is consistent with the lead time demand because as demand drives stock below the reorder point, orders will be suggested “up to” the reorder point.

Epicor Prophet 21 with Forecasting Inventory Planning P21

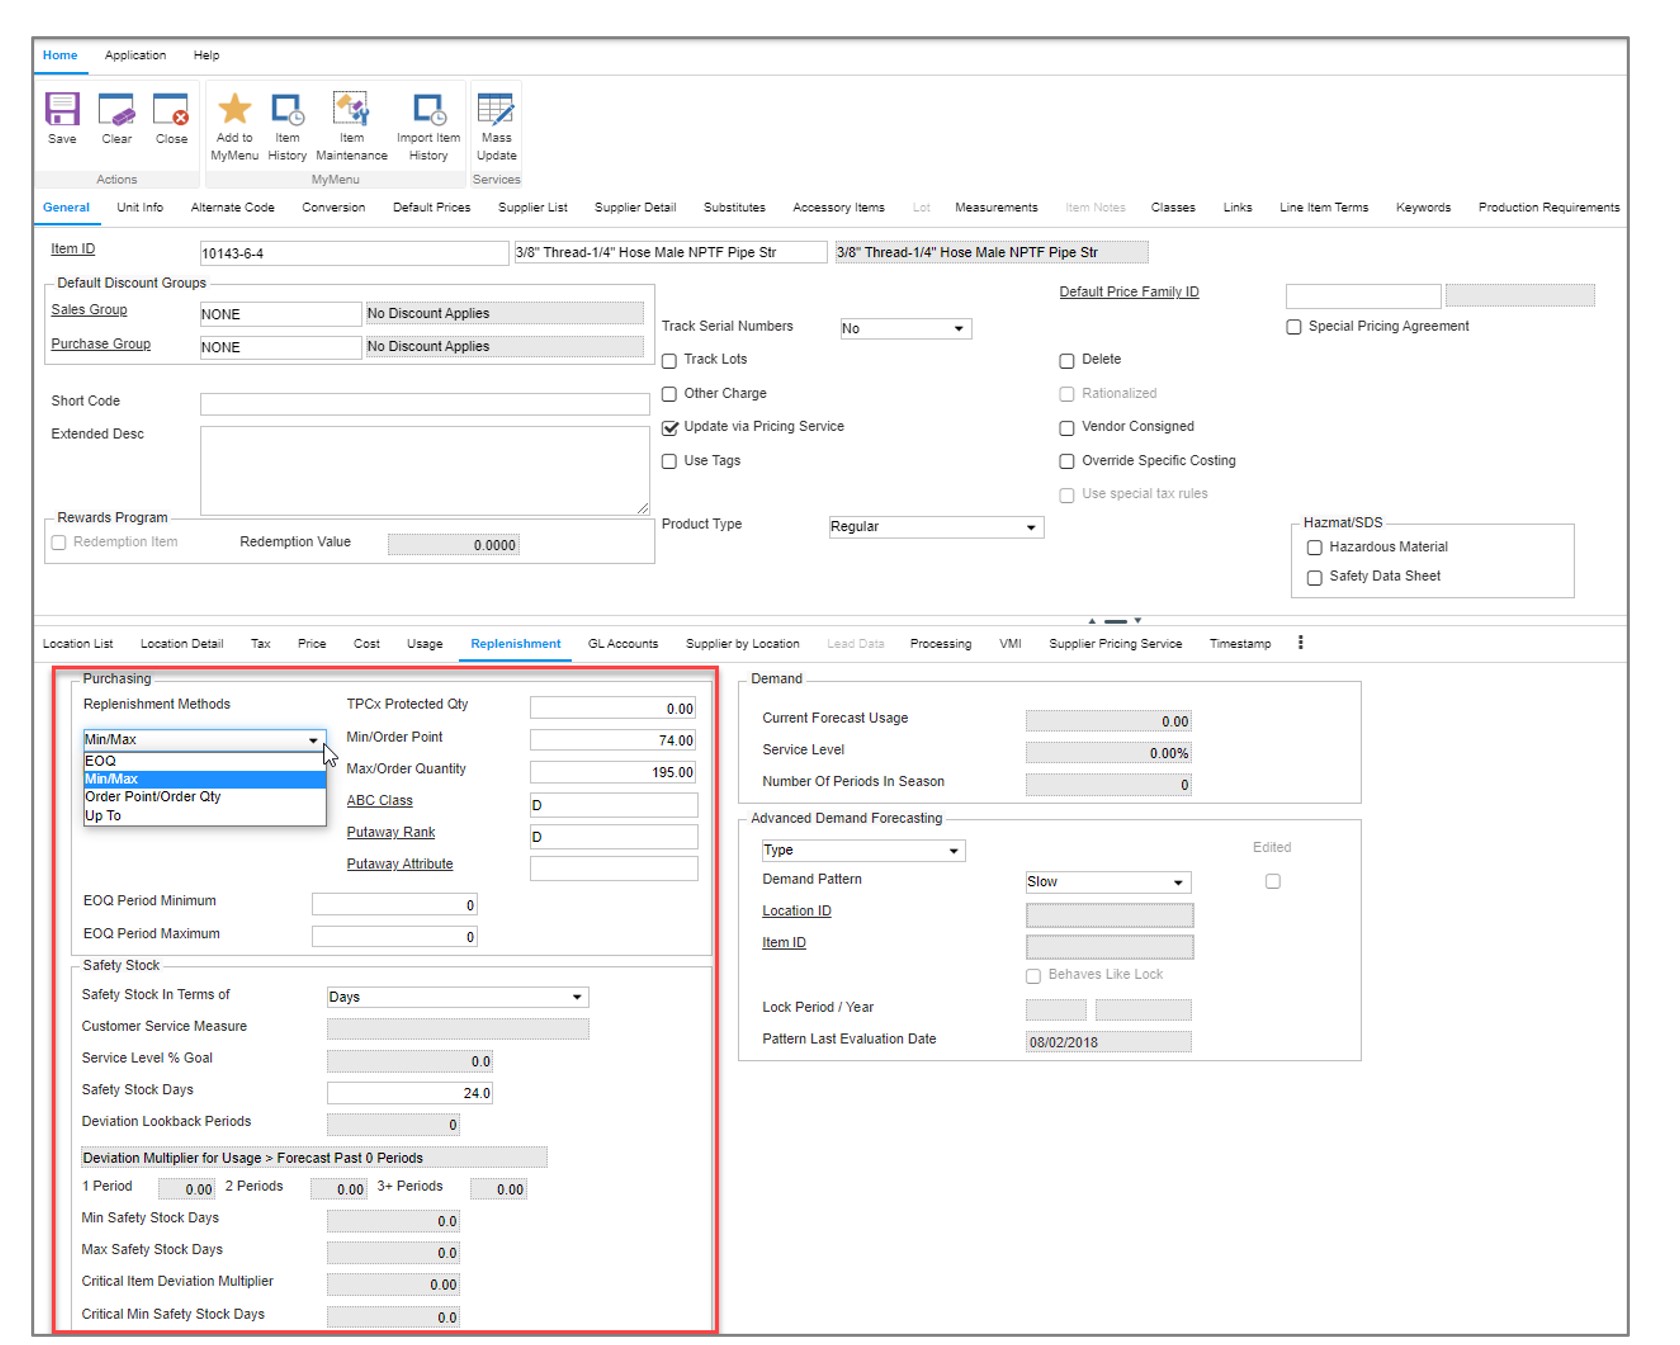
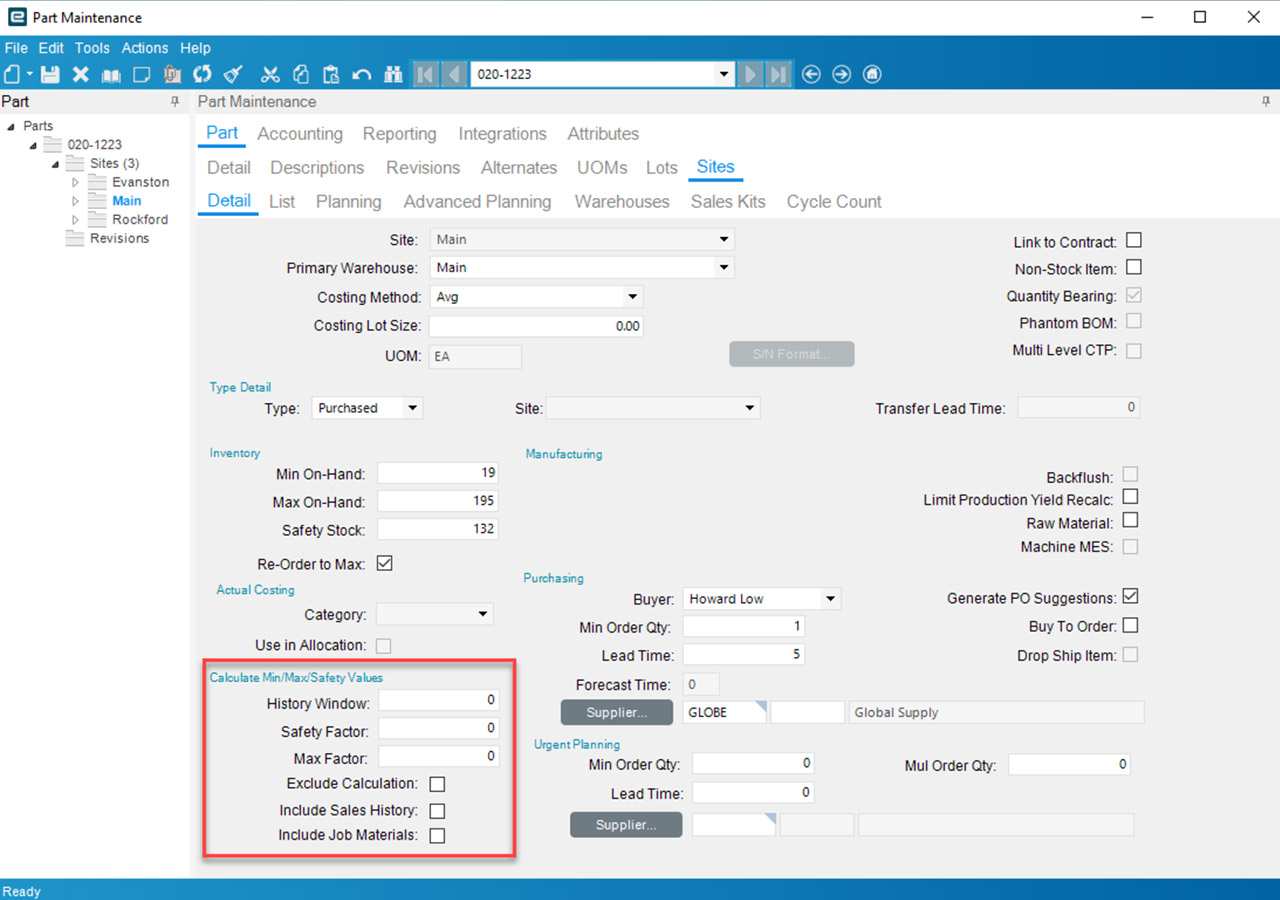
P21’s Item Maintenance Screen where users can specify the desired inventory policy and configure other settings such as safety stock and order modifiers.

Limitations

Forecast Methods
There are two forecast modes in P21:  Basic and Advanced.  Each use a series of averaging methods and require manual configurations and user determined classification rules to generate a demand forecast.  Neither mode is designed with an out-of-the-box expert system that automatically generates forecasts that account for underlying patterns such as trend or seasonality.  Lots of configuration is required that tends to inhibit user adoption and modification of the assumed forecasting rules defined in the initial implementation that may no longer be relevant.  There isn’t a way to easily compare the forecast accuracy of different configurations.  For example, is it better to use 24 months of history or 18 months?  Is it more accurate to assume a trend should be applied when an item grows by 2% per month or should it be 10%?  Is it better to assume the item is seasonal if 80% or more of it’s demand occurs in 6 months of the year or  4 months of the year? As a result, it is common for classification rules to be too broad or specific resulting in problems such as application of an incorrect forecasting model, using too much or too little history, or over/understating the trend and seasonality.   To learn more about how this works, check out this blog post (coming soon)

Forecast Management & Consensus Planning
P21 lacks forecast management features that enable organizations to plan at multiple hierarchy levels such as product family, region, or by customer.  Forecasts must be created at the lowest level of granularity (product by location) where demand is often too intermittent to get a good forecast.  There isn’t a way to share forecasts, collaborate, review, or create forecasts at aggregate levels, and agree on the consensus plan. It is difficult to incorporate business knowledge, assess forecasts at higher levels of aggregation, and track whether overrides are improving or hurting forecast accuracy. This makes forecasting too one-dimensional and dependent on the initial math configurations.  

Intermittent Demand
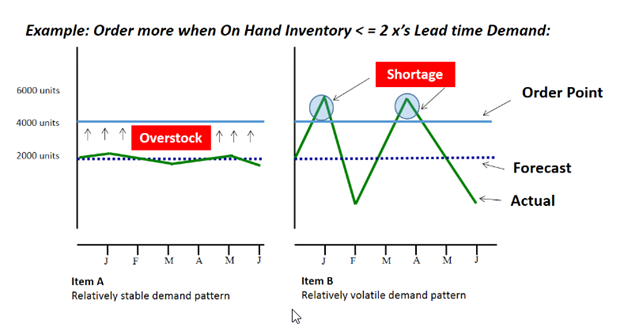
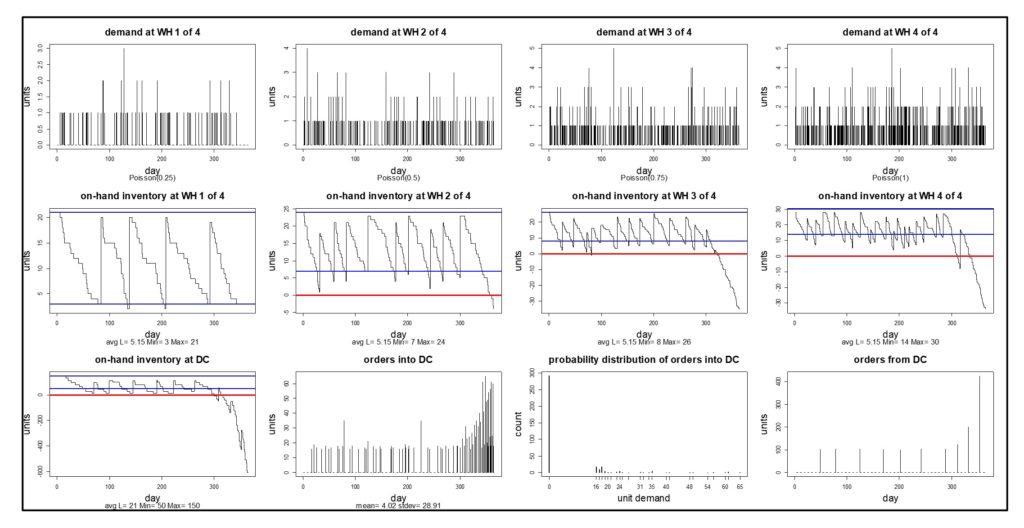
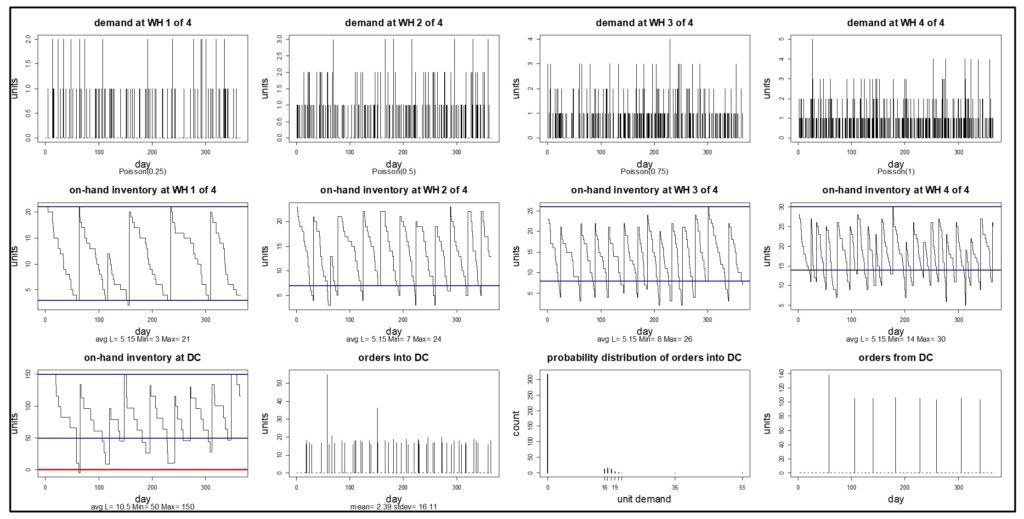
Many P21 customers rely on static methods (Min/Max and OP/OQ) because of the prevalence of intermittent demand.  Otherwise known as “lumpy”, intermittent demand is characterized by sporadic sales, large spikes in demand, and many periods with no demand at all. When demand is intermittent, traditional forecasting and safety stock methods just don’t work.  Since distributors don’t have the luxury of stocking only high movers with consistent demand, they need specialized solutions that are engineered to effectively plan intermittently demanded items. 80% or more of a distributor’s parts will have intermittent demand.  The stocking policies that are generated using traditional methods such as those available in P21 and other planning applications will result in incorrect estimates of what to stock to achieve the targeted service level.  As illustrated in the graph below, it isn’t possible to consistently forecast the spikes.  You are stuck with a forecast that is effectively an average of the prior periods.

Epicor Prophet 21 with Forecasting Inventory Management

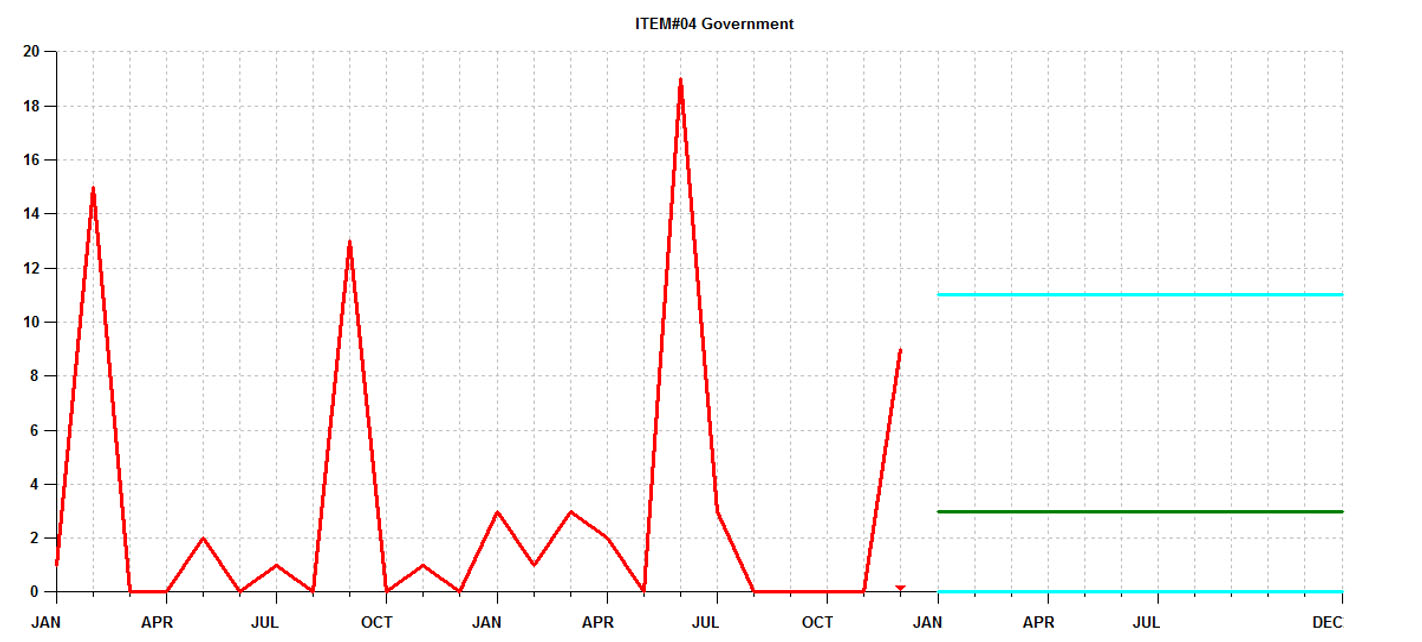
Forecasts of intermittent demand can’t predict the spikes and require safety stock buffers to protect against stockouts.


Second, P21’s safety stock methods allow you to set a target service level but the underlying logic mistakenly assumes that the demand is normally distributed.  With intermittent demand, the demand isn’t “normal” and therefore the estimate of safety stock will be wrong.   Here is what wrong means: when setting a service level of, for example 98%, the expectation is that 98% of the time the stock on hand will fill 100% of what the customer needs from the shelf.  Using a normal distribution to compute safety stocks will result in large deviations between the targeted service level and actual service level achieved.  It is not uncommon to see situations where the actual service level misses the target by 10% or more (i.e., targeted 95% but only achieved 85%).


Epicor Prophet 21 with Forecasting Inventory Analytics

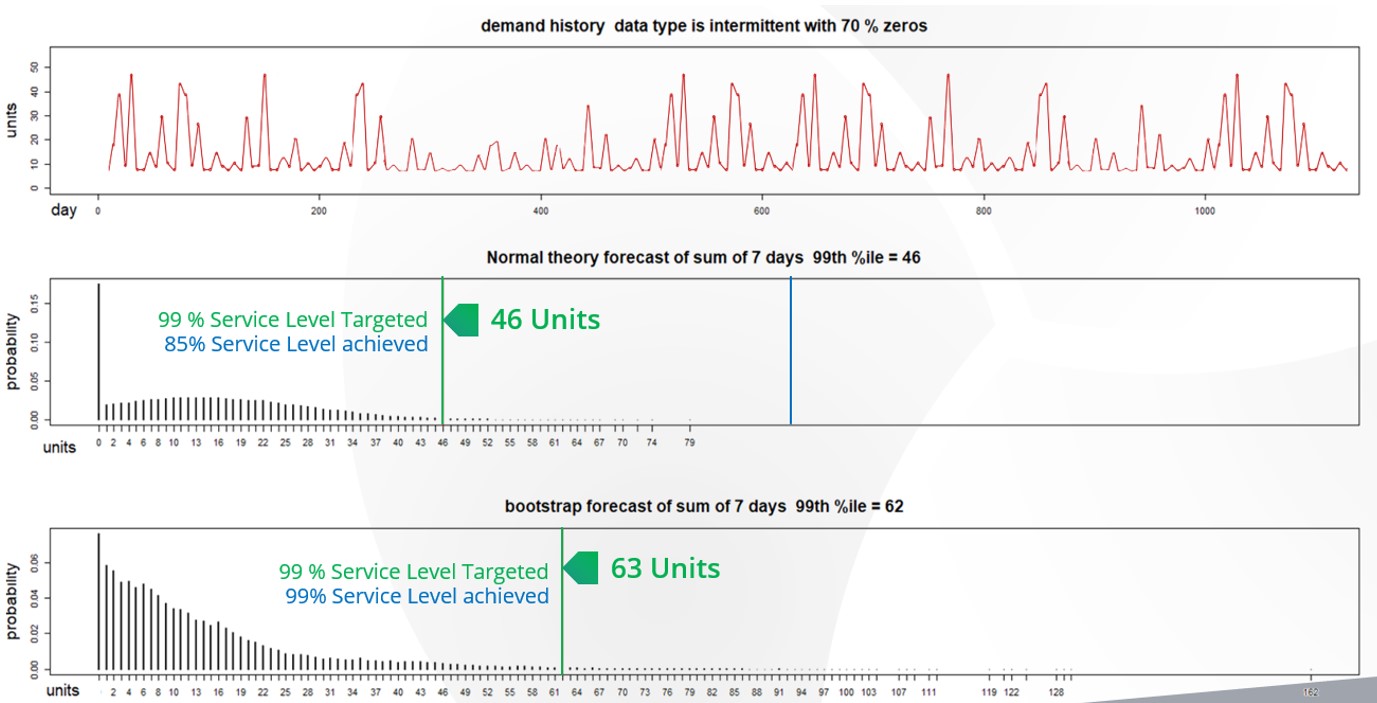
In this figure you can see the demand history of an intermittently demanded part and two distributions based on this demand history. The first distribution was generated using the same “normal distribution: logic employed by P21. The second is a simulated distribution based on Smart Software’s probabilistic forecasting. The “normal” P21 distribution recommends that 46 units is needed to achieve the 99% service level but when compared to actuals far more inventory was needed. Smart accurately predicted that 63 units was required to achieve the service level.

This blog explains how you can test your system’s service level accuracy.

Reliance on Spreadsheets & Reactive Planning
P21 customers tell us that they rely heavily on the use of spreadsheets to manage stocking policies and forecasting.  Spreadsheets aren’t purpose-built for forecasting and inventory optimization. Users will often bake in user-defined rule of thumb methods that often do more harm than good.  Once calculated, users must input the information back into P21 via manual file imports or even manual entry.  The time consuming nature of the process leads companies to infrequently compute their inventory policies – Many months and on occasion years go by in between mass updates leading to a “set it and forget it” reactive approach, where the only time a buyer/planner reviews inventory policy is at the time of order.  When policies are reviewed after the order point is already breached, it is too late.  When the order point is deemed too high, manual interrogation is required to review history, calculate forecasts, assess buffer positions, and to recalibrate.  The sheer volume of orders means that buyers will just release orders rather than take the painstaking time to review everything, leading to significant excess stock.  If the reorder point is too low, it’s already too late.  An expedite is now required driving up costs and even then, you’ll still lose sales if the customer goes elsewhere.

Limited What If Planning
Since features for modifying reorder points and order quantities are baked into P21 it is not possible to make wholesale changes across groups of items and assess predicted outcomes before deciding to commit.  This forces users to adopt a “wait and see” process when it comes to modifying parameters. Planners will make a change and then monitor actuals until they are confident the change improved things.  Managing this at scale—many planners are dealing with tens of thousands of items—is extremely time consuming and the end result is infrequent recalibration of inventory policy. This also contributes to reactive planning whereby planners will only review settings after a problem has occurred.

Epicor is Smarter
Epicor has partnered with Smart Software and offers Smart IP&O as a cross platform add-on to Prophet 21 complete with a bidirectional API-based integration.  This enables Epicor customers to leverage built-for-purpose best of breed forecasting and inventory optimization applications.  With Epicor Smart IP&O you can generate forecasts that capture trend and seasonality without having to first apply manual configurations.  You will be able to automatically recalibrate policies every planning cycle using field proven, cutting-edge statistical and probabilistic models that were engineered to accurately plan for intermittent demand.   Safety stocks will accurately account for demand and supply variability, business conditions, and priorities.  You can leverage service level driven planning so you have just enough stock or turn on optimization methods that prescribe the most profitable stocking policies and service levels that consider the real cost of carrying inventory. You can build consensus demand forecasts that blend business knowledge with statistics, better assess customer and sales forecasts, and confidently upload forecasts and stocking policies to Epicor with a few mouse-clicks.

Smart IP&O customers routinely realize 7 figure annual returns from reduced expedites, increased sales, and less excess stock, all the while gaining a competitive edge by differentiating themselves on improved customer service. To see a recorded webinar hosted by the Epicor Users Group that profiles Smart’s Demand Planning and Inventory Optimization platform, please register here: https://smartcorp.com/epicor-smart-inventory-planning-optimization/


Extend Epicor Kinetic’s Forecasting & Min/Max Planning with Smart IP&O

Extend Epicor Kinetic’s Forecasting & Min/Max Planning with Smart IP&O  
Epicor Kinetic can manage replenishment by suggesting what to order and when via reorder point-based inventory policies. Users can either manually specify these reorder points or use a daily average of demand to dynamically compute the policies.  If the policies aren’t correct then the automatic order suggestions will be inaccurate, and in turn the organization will end up with excess inventory, unnecessary shortages, and a general mistrust of their software systems.  In this article, we will review the inventory ordering functionality in Epicor Kinetic, explain its limitations, and summarize how Smart Inventory Planning & Optimization (Smart IP&O) can help reduce inventory, minimize stockouts and restore your organization’s trust in your ERP by providing the robust predictive functionality that is missing from ERP systems.

Epicor Kinetic (and Epicor ERP 10) Replenishment Policies
In the item maintenance screen of Epicor Kinetic, users can enter planning parameters for every stock item. These include Min On-Hand, Max On-Hand, Safety Stock lead times, and order modifiers such as supplier imposed minimum and maximum order quantities and order multiples.  Kinetic will reconcile incoming supply, current on hand, outgoing demand, stocking policies, and demand forecasts (that must be imported) to net out the supply plan.   Epicor’s time-phased replenishment inquiry details what is up for order and when while the Buyers Workbench enables users to assemble purchase orders.

Epicor’s Min/Max/Safety logic and forecasts that are entered into the “forecast entry” screen drives replenishment.  Here is how it works:

  • The reorder point is equal to Min + Safety. This means whenever on hand inventory drops below the reorder point an order suggestion will be created. If demand forecasts are imported via Epicor’s “forecast entry” screen the reorder point will account for the forecasted demand over the lead time and is equal to Min + Safety + Lead time forecast
  • If “reorder to Max” is selected, Epicor will generate an order quantity up to the Max. If not selected, Epicor will order the “Min Order Qty” if MOQ is less than the forecasted quantity over the time fence. Otherwise, it will order the forecasted demand over the time-period specified.  In the buyer’s workbench, the buyer can modify the actual order quantity if desired.


Limitations
Epicor’s Min/Max/Safety relies on an average of daily demand. It is easy to set up and understand.  It can also be effective when you don’t have lots of demand history. However, you’ll have to create forecasts and adjust for seasonality, trend, and other patterns externally.  Finally, multiples of averages also ignore the important role of demand or supply variability and this can result in misallocated stock as illustrated in the graphic below: 


Epicor same average demand and safety stock is determined

In this example, two equally important items have the same average demand (2,000 per month) and safety stock is determined by doubling the lead time demand resulting in a reorder point of 4,000. Because the multiple ignores the role of demand variability, Item A results in a significant overstock and Item B results in significant stockouts.

As designed, Min should hold expected demand over lead time and Safety should hold a buffer. However, these fields are often used very differently across items without a uniform policy; sometimes users even enter a Min and Safety Stock even though the item is being forecasted, effectively over estimating demand! This will generate order suggestions before it is needed, resulting in overstocks.  

Spreadsheet Planning
Many companies turn to spreadsheets when they face challenges setting policies in their ERP system.  These spreadsheets often rely on user defined rule of thumb methods that often do more harm than good.  Once calculated, they must input the information back into Epicor,  via manual file imports or even manual entry.  The time consuming nature of the process leads companies to infrequently compute their inventory policies – Many months of even years go by in between mass updates leading to a “set it and forget it” reactive approach, where the only time a buyer/planner reviews inventory policy is at the time of order.  When policies are reviewed after the order point is already breached it is too late.  When the order point is deemed too high, manual interrogation is required to review history, calculate forecasts, assess buffer positions, and to recalibrate.  The sheer volume of orders means that buyers will just release orders rather than take the painstaking time to review everything leading to significant excess stock.  If the reorder point is too low, it’s already too late.  An expedite is now required driving up costs and even then you’ll still lose sales if the customer goes elsewhere.

Epicor is Smarter
Epicor has partnered with Smart Software and offers Smart IP&O as a cross platform add-on to Epicor Kinetic and Prophet 21 with API based integrations.  This enables Epicor customers to leverage built for purpose best of breed forecasting and inventory optimization applications.  With Epicor Smart IP&O you can automatically recalibrate policies every planning cycle using field proven, cutting-edge statistical and probabilistic models.  You can calculate demand forecasts that account for seasonality, trend, and cyclical patterns.  Safety stocks will account for demand and supply variability, business conditions, and priorities.  You can leverage service level driven planning so you have just enough stock or turn on optimization methods that prescribe the most profitable stocking policies and service levels that consider the real cost of carrying inventory. You can build consensus demand forecasts that blend business knowledge with statistics, better assess customer and sales forecasts, and confidently upload forecasts and stocking policies to Epicor within a few mouse-clicks.

Smart IP&O customers routinely realize 7 figure annual returns from reduced expedites, increased sales, and less excess stock, all the while gaining a competitive edge by differentiating themselves on improved customer service. To see a recorded webinar hosted by the Epicor Users Group that profiles Smart’s Demand Planning and Inventory Optimization platform, please register here: https://smartcorp.com/epicor-smart-inventory-planning-optimization/


Smart Software Launches Smart Inventory Optimization and Demand Planning for Prophet 21

Smart Software, a leader in enterprise demand planning, consensus forecasting, and inventory optimization solutions announces the release of Smart Inventory Planning and Optimization (Smart IP&O) for Prophet 21 (P21).  The company will demonstrate the solution at the Connect 2022, P21’s Annual User Group Conference August 29th – August 31st.  With Smart IP&O, Prophet 21 users will now be able to:


  • Conduct Global What if Scenarios across thousands of parts that compare Smart prescribed, user defined, and P21 calculated stocking policies across Key Performance Predictions of Service Levels, Fill Rates, Shortage Costs, Inventory Value, and more.


  • Leverage Smart’s prescribed stocking policies and service level recommendations that will optimally yield the most profitable outcomes for each part considering predicted holding costs, ordering costs, and shortage costs.


  • Accurately forecast all demand patterns including intermittent demand that is highly prevalent with distribution businesses. Smart’s patented probabilistic modeling engine generates thousands of future demand scenarios that more accurately predict demand and stocking policies.


  • Develop consensus forecasts comparing statistical, P21 generated forecasts, sales, and customer forecasts. Smart’s Demand Planning workbench enables graphical and tabular visualizations of all forecasts considered and supports automated consensus forecasting and accuracy measurement.


  • Leverage Smart IP&O’s bi-directional integration to P21 that continually updates Smart’s common data model with planning data and writes back forecasts and stocking policies on demand.


“Smart IP&O extends an already feature rich P21 with difference making forecasting and inventory optimization technology. Our joint customers will now be able to more effectively wield inventory to build a competitive moat around their business, maximize sales, and outperform the competition,” said Greg Hartunian, Smart Software CEO.  “Today’s supply chains need far better capabilities to contend with the extreme demand and supply variability businesses are facing today.  We look forward to equipping our Epicor P21 customers with the tools to do this effectively, accurately, and at scale.”


About Smart Software, Inc.

Founded in 1981, Smart Software, Inc. is an Epicor Platinum Partner and leading provider of demand planning, forecasting, inventory optimization, and analytics solutions. Our web platform, Smart IP&O, leverages probabilistic forecast modeling, machine learning, and collaborative demand planning to optimize inventory levels and increase forecast accuracy.  Smart Software is headquartered in Belmont, Massachusetts.  To learn more, visit www.smartcorp.com.


Smart Software to Present at Epicor Insights 2022

Smart Software President and CEO to present Epicor Insights 2022 Sessions on Creating Competitive Advantage with Smart Inventory Planning and Optimization


Belmont, MA, May, 2022 – Smart Software, Inc., provider of industry-leading demand forecasting, planning, and inventory optimization solutions, today announced that it will present at Epicor Insights 2022.

Greg Hartunian, CEO of Smart Software, will present two sessions and will explain Epicor Smart Inventory Planning and Optimization at this year’s Epicor Insights event in Nashville, TN. Greg will show how to empower planning teams to reduce inventory, improve service levels, and increase operational efficiency.

  • The Prophet 21 presentation is scheduled for Wed May 25th, 11:30 am -12:15 pm  (CST) 

Prophet 21 Smart Software to present at Epicor Insights 2022

Smart Software Kinetic 21 Session Greg CEO

  • The Kinetic presentation is scheduled for Wed May 25th, 2:30 pm – 3:20 pm (CST) 

Kinetic Smart Software to present at Epicor Insights 2022


If you plan to attend this year, please join us at either session below and learn more about Smart Inventory Planning and Optimization as we highlight valuable features in our solutions. Epicor Insights 2022 will bring together more than 2,000 users of Epicor’s industry-specific ERP solutions for the manufacturing, distribution, and service industries.  To learn more, visit INSIGHTS 2022.

Insights Team at work

Smart Software is an Epicor Platinum Partner and leading provider of demand planning, forecasting, inventory optimization, and analytics solutions. Our web platform, Smart IP&O, leverages probabilistic forecast modeling, machine learning, and collaborative demand planning to optimize inventory levels and increase forecast accuracy. You’ll use Smart IP&O to create accurate forecasts and optimal stocking policies that drive automated ordering in Epicor. The platform includes bi-directional integrations to both Epicor ERP and Prophet 21.


About Smart Software, Inc.
Founded in 1981, Smart Software, Inc. is a leader in providing businesses with enterprise-wide demand forecasting, planning and inventory optimization solutions.  Smart Software’s demand forecasting and inventory optimization solutions have helped thousands of users worldwide, including customers at mid-market enterprises and Fortune 500 companies, such as Disney, Arizona Public Service, and Ameren.  Smart Inventory Planning & Optimization gives demand planners the tools to handle sales seasonality, promotions, new and aging products, multi-dimensional hierarchies, and intermittently demanded service parts and capital goods items.  It also provides inventory managers with accurate estimates of the optimal inventory and safety stock required to meet future orders and achieve desired service levels.  Smart Software is headquartered in Belmont, Massachusetts and can be found on the World Wide Web at www.smartcorp.com.


For more information, please contact Smart Software, Inc., Four Hill Road, Belmont, MA 02478.
Phone: 1-800-SMART-99 (800-762-7899); FAX: 1-617-489-2748; E-mail: info@smartcorp.com


An Example of Simulation-Based Multiechelon Inventory Optimization

Managing the inventory in a single facility is difficult enough, but the problem becomes much more complex when there are multiple facilities arrayed in multiple echelons. The complexity arises from the interactions among the echelons, with demands at the lower levels bubbling up and any shortages at the higher levels cascading down.

If each of the facilities were to be managed in isolation, standard methods could be used, without regard to interactions, to set inventory control parameters such as reorder points and order quantities. However, ignoring the interactions between levels can lead to catastrophic failures. Experience and trial and error allow the design of stable systems, but that stability can be shattered by changes in demand patterns or lead times or by the addition of new facilities. Coping with such changes is greatly aided by advanced supply chain analytics, which provide a safe “sandbox” within which to test out proposed system changes before deploying them. This blog illustrates that point.


The Scenario

To have some hope of discussing this problem usefully, this blog will simplify the problem by considering the two-level hierarchy pictured in Figure 1. Imagine the facilities at the lower level to be warehouses (WHs) from which customer demands are meant to be satisfied, and that the inventory items at each WH are service parts sold to a wide range of external customers.


Fact and Fantasy in Multiechelon Inventory Optimization

Figure 1: General structure of one type of two-level inventory system

Imagine the higher level to consist of a single distribution center (DC) which does not service customers directly but does replenish the WHs. For simplicity, assume the DC itself is replenished from a Source that always has (or makes) sufficient stock to immediately ship parts to the DC, though with some delay. (Alternatively, we could consider the system to have retail stores supplied by one warehouse).

Each level can be described in terms of demand levels (treated as random), lead times (random), inventory control parameters (here, Min and Max values) and shortage policy (here, backorders allowed).


The Method of Analysis

The academic literature has made progress on this problem, though usually at the cost of simplifications necessary to facilitate a purely mathematical solution. Our approach here is more accessible and flexible: Monte Carlo simulation. That is, we build a computer program that incorporates the logic of the system operation. The program “creates” random demand at the WH level, processes the demand according to the logic of a chosen inventory policy, and creates demand for the DC by pooling the random requests for replenishment made by the WHs. This approach lets us observe many simulated days of system operation while watching for significant events like stockouts at either level.


An Example

To illustrate an analysis, we simulated a system consisting of four WHs and one DC. Average demand varied across the WHs. Replenishment from the DC to any WH took from 4 to 7 days, averaging 5.15 days. Replenishment of the DC from the Source took either 7, 14, 21 or 28 days, but 90% of the time it was either 21 or 28 days, making the average 21 days. Each facility had Min and Max values set by analyst judgement after some rough calculations.

Figure 2 shows the results of one year of simulated daily operation of this system. The first row in the figure shows the daily demand for the item at each WH, which was assumed to be “purely random”, meaning it had a Poisson distribution. The second row shows the on-hand inventory at the end of each day, with Min and Max values indicated by blue lines. The third row describes operations at the DC.  Contrary to the assumption of much theory, the demand into the DC was not close to being Poisson, nor was the demand out of the DC to the Source. In this scenario, Min and Max values were sufficient to keep item availability was high at each WH and at the DC, with no stockouts observed at any of the five facilities.


Click here to enlarge the image

Figure 2 - Simulated year of operation of a system with four WHs and one DC.

Figure 2 – Simulated year of operation of a system with four WHs and one DC.


Now let’s vary the scenario. When stockouts are extremely rare, as in Figure 2, there is often excess inventory in the system. Suppose somebody suggests that the inventory level at the DC looks a bit fat and thinks it would be good idea to save money there. Their suggestion for reducing the stock at the DC is to reduce the value of the Min at the DC from 100 to 50. What happens? You could guess, or you could simulate.

Figure 3 shows the simulation – the result is not pretty. The system runs fine for much of the year, then the DC runs out of stock and cannot catch up despite sending successively larger replenishment orders to the Source. Three of the four WHs descend into death spirals by the end of the year (and WH1 follows thereafter). The simulation has highlighted a sensitivity that cannot be ignored and has flagged a bad decision.


Click here to enlarge image

Figure 3 - Simulated effects of reducing the Min at the DC.

Figure 3 – Simulated effects of reducing the Min at the DC.


Now the inventory managers can go back to the drawing board and test out other possible ways to reduce the investment in inventory at the DC level. One move that always helps, if you and your supplier can jointly make it happen, is to create a more agile system by reducing replenishment lead time. Working with the Source to insure that the DC always gets its replenishments in either 7 or 14 days stabilizes the system, as shown in Figure 4.


Click here to enlarge image

Figure 4 - Simulated effects of reducing the lead time for replenishing the DC.

Figure 4 – Simulated effects of reducing the lead time for replenishing the DC.


Unfortunately, the intent of reducing the inventory at the DC has not been achieved. The original daily inventory count was about 80 units and remains about 80 units after reducing the DC’s Min and drastically improving the Source-to-DC lead time. But with the simulation model, the planning team can try out other ideas until they arrive at a satisfactory redesign. Or, given that Figure 4 shows the DC inventory starting to flirt with zero, they might think it prudent to accept the need for an average of about 80 units at the DC and look for ways to trim inventory investment at the WHs instead.


The Takeaways

  1. Multiechelon inventory optimization (MEIO) is complex. Many factors interact to produce system behaviors that can be surprising in even simple two-level systems.
  2. Monte Carlo simulation is a useful tool for planners who need to design new systems or tweak existing systems.


Leave a Comment
Related Posts
Why MRO Businesses Need Add-on Service Parts Planning & Inventory Software

Why MRO Businesses Need Add-on Service Parts Planning & Inventory Software

MRO organizations exist in a wide range of industries, including public transit, electrical utilities, wastewater, hydro power, aviation, and mining. To get their work done, MRO professionals use Enterprise Asset Management (EAM) and Enterprise Resource Planning (ERP) systems. These systems are designed to do a lot of jobs. Given their features, cost, and extensive implementation requirements, there is an assumption that EAM and ERP systems can do it all. In this post, we summarize the need for add-on software that addresses specialized analytics for inventory optimization, forecasting, and service parts planning.

Head to Head: Which Service Parts Inventory Policy is Best?

Head to Head: Which Service Parts Inventory Policy is Best?

Our customers have usually settled into one way to manage their service parts inventory. The professor in me would like to think that the chosen inventory policy was a reasoned choice among considered alternatives, but more likely it just sort of happened. Maybe the inventory honcho from long ago had a favorite and that choice stuck. Maybe somebody used an EAM or ERP system that offered only one choice. Perhaps there were some guesses made, based on the conditions at the time.

Leveraging ERP Planning BOMs with Smart IP&O to Forecast the Unforecastable

Leveraging ERP Planning BOMs with Smart IP&O to Forecast the Unforecastable

In a highly configurable manufacturing environment, forecasting finished goods can become a complex and daunting task. The number of possible finished products will skyrocket when many components are interchangeable. A traditional MRP would force us to forecast every single finished product which can be unrealistic or even impossible. Several leading ERP solutions introduce the concept of the “Planning BOM”, which allows the use of forecasts at a higher level in the manufacturing process. In this article, we will discuss this functionality in ERP, and how you can take advantage of it with Smart Inventory Planning and Optimization (Smart IP&O) to get ahead of your demand in the face of this complexity.