6 Do’s and Don’ts for Spare Parts Planning

Managing spare parts inventories can feel impossible. You don’t know what will break and when. Feedback from mechanical departments and maintenance teams is often inaccurate. Planned maintenance schedules are often shifted around, making them anything but “planned.”   Usage (i.e., demand) patterns are most often extremely intermittent, i.e., demand jumps randomly between zero and something else, often a surprisingly big number. Intermittency, combined with the lack of significant trend or seasonal patterns, render traditional time-series forecasting methods inaccurate. The large number of part-by-locations combinations makes it impossible to manually create or even review forecasts for individual parts.   Given all these challenges, we thought it would be helpful to outline a number of do’s (and their associated don’ts).

  1. Do use probabilistic methods to compute a reorder points and Min/Max levels
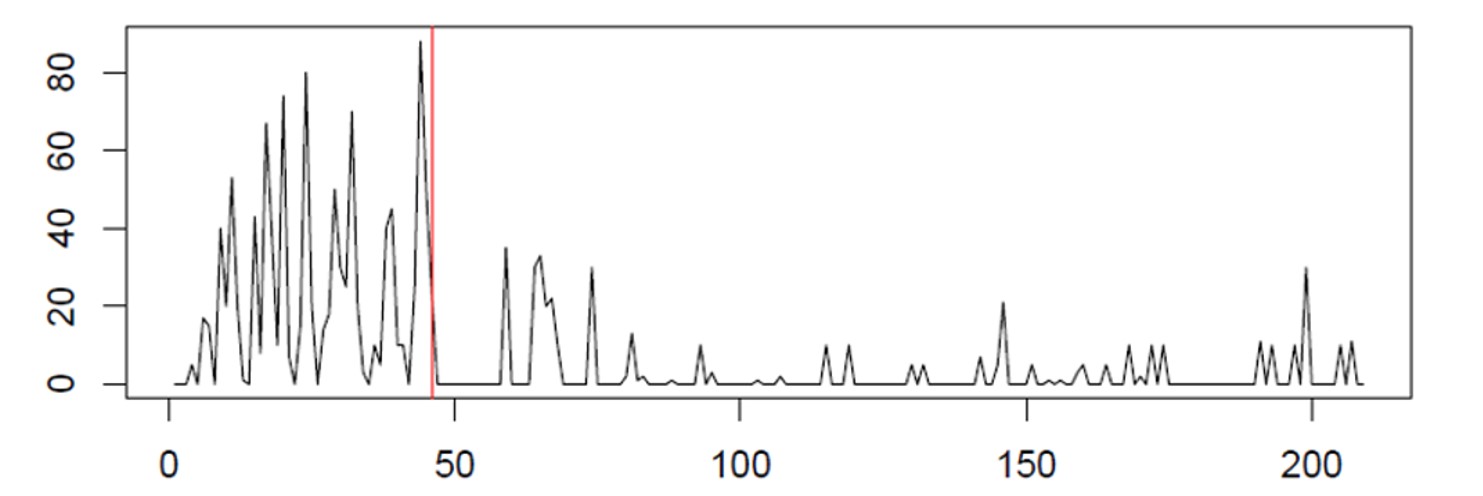
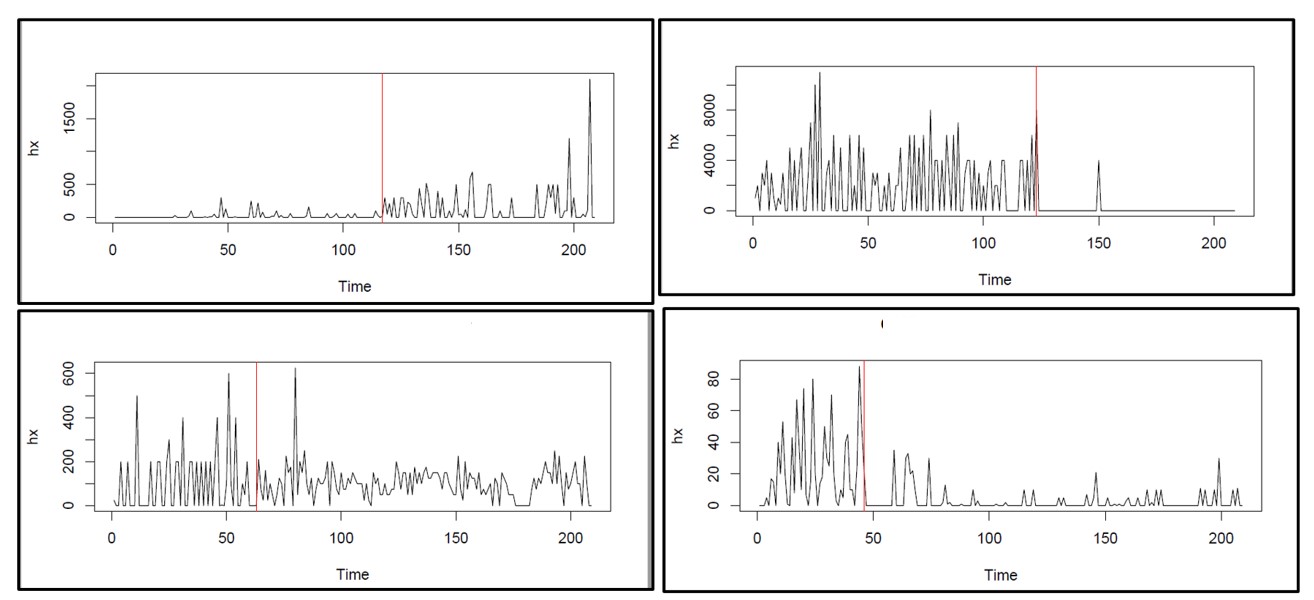
    Basing stocking decisions on average daily usage isn’t the right answer. Nor is reliance on traditional forecasting methods like exponential smoothing models. Neither approach works when demand is intermittent because they don’t take proper account of demand volatility. Probabilistic methods that simulate thousands of possible demand scenarios work best. They provide a realistic estimate of the demand distribution and can handle all the zeros and random non-zeros. This will ensure the inventory level is right-sized to hit whatever service level target you choose.
     
  2. Do use service levels instead of rule-of-thumb methods to determine stocking levels
    Many parts planning organizations rely on multiples of daily demand and other rules of thumb to determine stocking policies. For example, reorder points are often based on doubling average demand over the lead time or applying some other multiple depending on the importance of the item. However, averages don’t account for how volatile (or noisy) a part is and will lead to overstocking less noisy parts and understocking more noisy parts.
     
  3. Do frequently recompute stocking policies
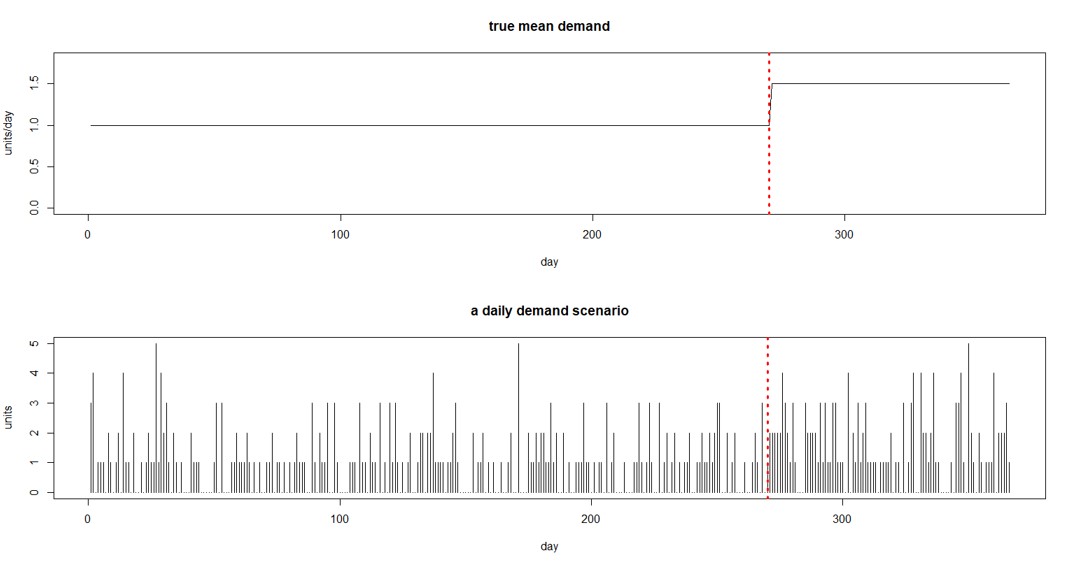
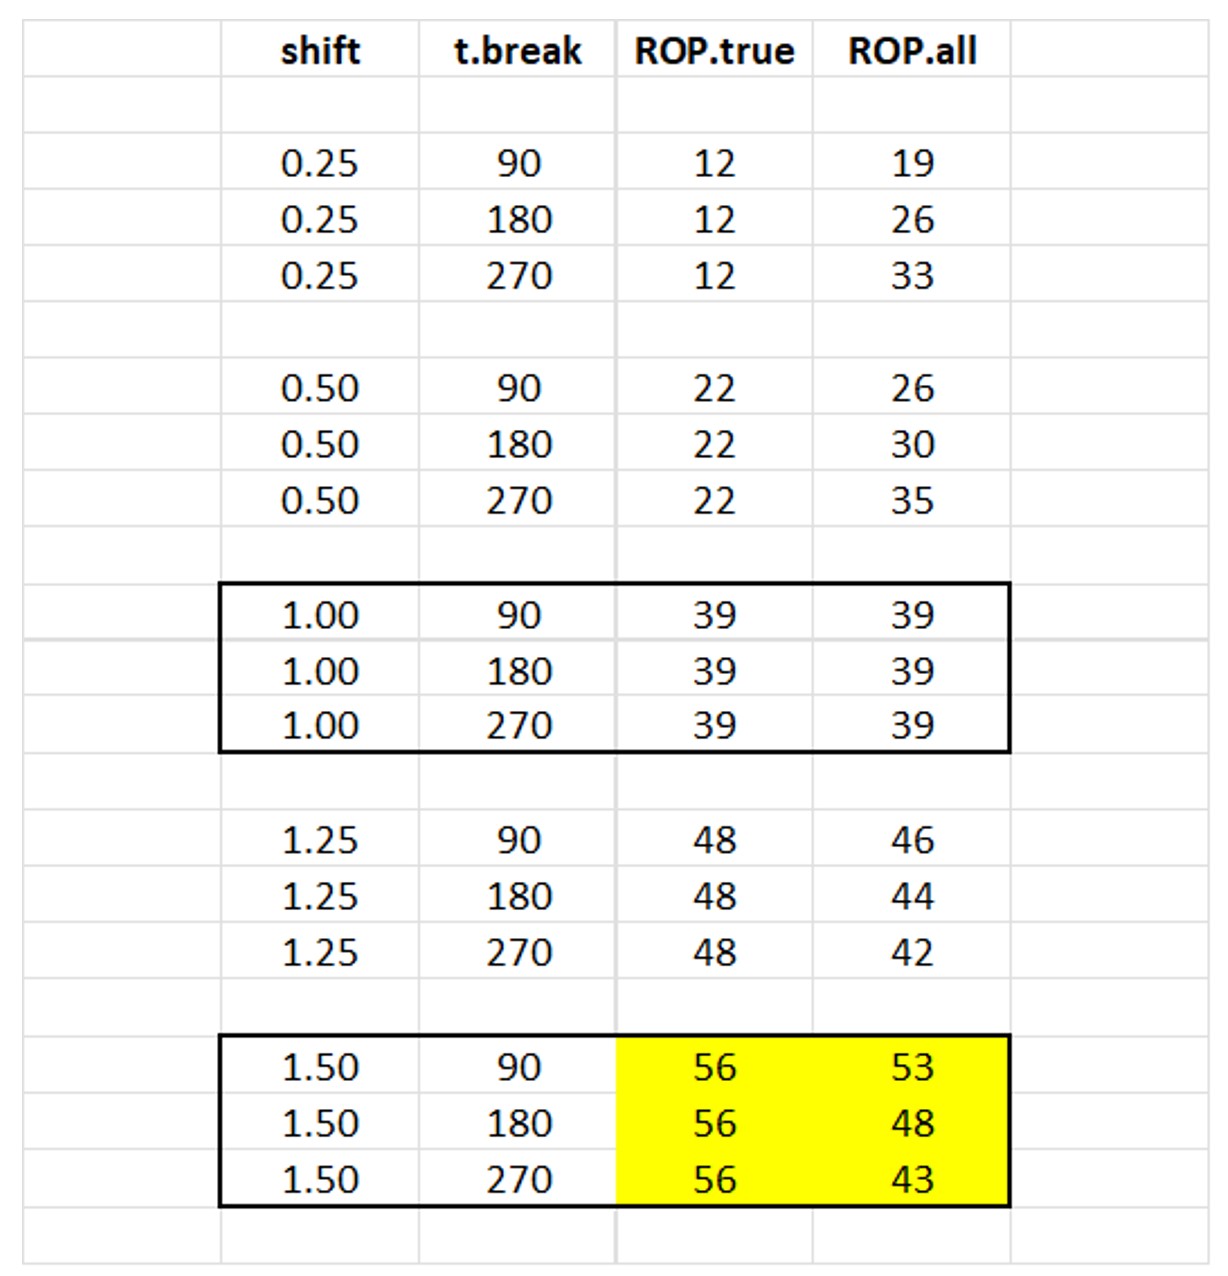
    Just because demand is intermittent doesn’t mean nothing changes over time. Yet after interviewing hundreds of companies managing spare parts inventory, we find that fewer than 10% recompute stocking policies monthly. Many never recompute stocking policies until there is a “problem.” Across thousands of parts, usage is guaranteed to drift up or down on at least some of the parts. Supplier lead times can also change. Using an outdated reorder point will cause orders to trigger too soon or too late, creating lots of problems. Recomputing policies every planning cycle ensures inventory will be right-sized. Don’t be reactive and wait for a problem to occur before considering whether the Min or Max should be modified. By then it’s too late – it’s like waiting for your brakes to fail before making a repair. Don’t worry about the effort of recomputing Min/Max values for large numbers of SKU’s: modern software does it automatically. Remember: Recalibration of your stocking policies is preventive maintenance against stockout!
     
  4. Do get buy-in on targeted service levels
    Inventory is expensive and should be right-sized based on striking a balance between the organization’s willingness to stock out and its willingness to budget for spares. Too often, planners make decisions in isolation based on pain avoidance or maintenance technicians’ requests without consideration of how spending on one part impacts the organization’s ability to spend on another part. Excess inventory on one part hurts service levels on other parts by disproportionally consuming the inventory budget. Make sure that service level goals and associated inventory costs of achieving the service levels are understood and agreed to.
     
  5. Do run a separate planning process for repairable parts
    Some parts are very expensive to replace, so it is preferable to send them to repair facilities or back to the OEM for repair. Accounting for the supply side randomness of when repairable parts will be returned, and knowing whether to wait for a repair or to purchase an additional spare, are critical to ensuring item availability without inventory bloat. This requires specialized reporting and the use of probabilistic models.  Don’t treat repairable parts like consumable parts when planning.
     
  6. Do count what is purchased against the budget – not just what is consumed
    Many organizations will allocate total part purchases to a separate corporate budget and ding the mechanical or maintenance team’s budget for parts that are used. In most MRO organizations, especially in public transit and utilities, the repair teams dictate what is purchased. If what is purchased doesn’t count against their budget, they will over-buy to ensure there is never any chance of stockout. They have literally zero incentive to get it right, so tens of millions in excess inventory will be purchased. If what is purchased is reflected in the budget, far more attention will be paid to purchasing only what is truly needed. Recognizing that excess inventory hurts service by robbing the organization of cash that could otherwise be used on understocked parts is an important step to ensuring responsible inventory purchasing.

Spare Parts Planning Software solutions

Smart IP&O’s service parts forecasting software uses a unique empirical probabilistic forecasting approach that is engineered for intermittent demand. For consumable spare parts, our patented and APICS award winning method rapidly generates tens of thousands of demand scenarios without relying on the assumptions about the nature of demand distributions implicit in traditional forecasting methods. The result is highly accurate estimates of safety stock, reorder points, and service levels, which leads to higher service levels and lower inventory costs. For repairable spare parts, Smart’s Repair and Return Module accurately simulates the processes of part breakdown and repair. It predicts downtime, service levels, and inventory costs associated with the current rotating spare parts pool. Planners will know how many spares to stock to achieve short- and long-term service level requirements and, in operational settings, whether to wait for repairs to be completed and returned to service or to purchase additional service spares from suppliers, avoiding unnecessary buying and equipment downtime.

Contact us to learn more how this functionality has helped our customers in the MRO, Field Service, Utility, Mining, and Public Transportation sectors to optimize their inventory. You can also download the Whitepaper here.


White Paper: What you Need to know about Forecasting and Planning Service Parts


This paper describes Smart Software’s patented methodology for forecasting demand, safety stocks, and reorder points on items such as service parts and components with intermittent demand, and provides several examples of customer success.


    Service Parts Planning: Planning for consumable parts vs. Repairable Parts

    When deciding on the right stocking parameters for spare parts and service parts, it is important to distinguish between consumable and repairable service parts.  These differences are often overlooked by service parts planning software and can result in incorrect estimates of what to stock.  Different approaches are required when planning for consumables vs. repairable spare parts.

    First, let’s define these two types of spare parts.

    • Consumable parts are spares contained within the equipment which are replaced rather than repaired when they fail. Examples of consumable parts include batteries, oil filters, screws, and brake pads.  Consumable spare parts tend to be lower-cost parts for which replacement is cheaper than repair or repair may not be possible.
    • Repairable parts are parts that are capable of being repaired and returned to service after failing due to causes like wear and tear, damage, or corrosion. Repairable service parts tend to be more expensive than consumable parts, so repair is usually preferable to replacement. Examples of repairable parts include traction motors in rail cars, jet engines, and copy machines.

    Traditional spare parts planning software fail to do the job

    Traditional parts planning software is not well-adapted to deal with the randomness in both the demand side and the supply side of MRO operations.

    Demand-Side Randomness
    Planning for consumable spare parts requires calculation of inventory control parameters (such as reorder points and order quantities, min and max levels, and safety stocks). Planning to manage repairable service parts requires calculation of the right number of spares. In both cases, the analysis must be based on probability models of the random usage of consumables or the random breakdown of repairable parts.  For over 90% of these parts, this random demand is “intermittent” (sometimes called “lumpy” or “anything but normally distributed”). Traditional spare parts forecasting methods were not developed to deal with intermittent demand. Relying on traditional methods leads to costly planning mistakes. For consumables, this means avoidable stockouts, excess carrying costs, and increased inventory obsolescence. For repairable parts, this means excessive equipment downtime and the attendant costs from unreliable performance and disruption of operations.

    Supply-Side Randomness
    Planning for consumable spare parts must take account of randomness in replenishment lead times from suppliers. Planning for repairable parts must account for randomness in repair and return processes, whether provided internally or contracted out. Planners managing these items often ignore exploitable company data. Instead, they may cross their fingers and hope everything works out, or they may call on gut instinct to “call audibles” and then hope everything works out.  Hoping and guessing cannot beat proper probability modeling. It wastes millions annually in unneeded capital investments and avoidable equipment downtime.

    Spare Parts Planning Software solutions

    Smart IP&O’s service parts forecasting software uses a unique empirical probabilistic forecasting approach that is engineered for intermittent demand. For consumable spare parts, our patented and APICS award winning method rapidly generates tens of thousands of demand scenarios without relying on the assumptions about the nature of demand distributions implicit in traditional forecasting methods. The result is highly accurate estimates of safety stock, reorder points, and service levels, which leads to higher service levels and lower inventory costs. For repairable spare parts, Smart’s Repair and Return Module accurately simulates the processes of part breakdown and repair. It predicts downtime, service levels, and inventory costs associated with the current rotating spare parts pool. Planners will know how many spares to stock to achieve short- and long-term service level requirements and, in operational settings, whether to wait for repairs to be completed and returned to service or to purchase additional service spares from suppliers, avoiding unnecessary buying and equipment downtime.

    Contact us to learn more how this functionality has helped our customers in the MRO, Field Service, Utility, Mining, and Public Transportation sectors to optimize their inventory. You can also download the Whitepaper here.


    White Paper: What you Need to know about Forecasting and Planning Service Parts


    This paper describes Smart Software’s patented methodology for forecasting demand, safety stocks, and reorder points on items such as service parts and components with intermittent demand, and provides several examples of customer success.


      Four Common Mistakes when Planning Replenishment Targets

      Whether you are using ‘Min/Max’ or ‘reorder point’ and ‘order quantity’ to determine when and how much to restock, your approach might deliver or deny huge efficiencies. Key mistakes to avoid:


      1. Not recalibrating regularly
      2. Only reviewing Min/Max when there is a problem
      3. Using Forecasting methods not up to the task
      4. Assuming data is too slow moving or unpredictable for it to matter


      We have over 150,000 SKU x Location combinations. Our demand is intermittent. Since it’s slow moving, we don’t need to recalculate our reorder points often. We do so maybe once annually but review the reorder points whenever there is a problem.” – Materials Manager.


      This reactive approach will lead to millions in excess stock, stock outs, and lots of wasted time reviewing data when “something goes wrong.” Yet, I’ve heard this same refrain from so many inventory professionals over the years. Clearly, we need to do more to share why this thinking is so problematic.

      It is true that for many parts, a recalculation of the reorder points with up-to-date historical data and lead times might not change much, especially if patterns such as trend or seasonality aren’t present. However, many parts will benefit from a recalculation, especially if lead times or recent demand has changed. Plus, the likelihood of significant change that necessitates a recalculation increases the longer you wait. Finally, those months with zero demands also influence the probabilities and shouldn’t be ignored outright. The key point though is that it is impossible to know what will change or won’t change in your forecast, so it’s better to recalibrate regularly.


        Planning Replenishment Targets Software calculate

      This standout case from real world data illustrates a scenario where regular and automated recalibration shines—the benefits from quick responses to changing demand patterns like these add up quickly. In the above example, the X axis represents days, and the Y axis represents demand. If you were to wait several months between recalibrating your reorder points, you’d undoubtedly order far too soon. By recalibrating your reorder point far more often, you’ll catch the change in demand enabling much more accurate orders.


      Rather than wait until you have a problem, recalibrate all parts every planning cycle at least once monthly. Doing so takes advantage of the latest data and proactively adjusts the stocking policy, thus avoiding problems that would cause manual reviews and inventory shortages or excess.

      The nature of your (potentially varied) data also needs to be matched with the right forecasting tools. If records for some parts show trend or seasonal patterns, using targeting forecasting methods to accommodate these patterns can make a big difference. Similarly, if the data show frequent zero values (intermittent demand), forecasting methods not built around this special case can easily deliver unreliable results.

      Automate, recalibrate and review exceptions. Purpose built software will do this automatically. Think of it another way: is it better to dump a bunch of money into your 401K once per year or “dollar cost average” by depositing smaller, equally sized amounts throughout the year. Recalibrating policies regularly will yield maximized returns over time, just as dollar cost averaging will do for your investment portfolio.

      How often do you recalibrate your stocking policies? Why?


      Managing Inventory amid Regime Change

      ​If you hear the phrase “regime change” on the news, you immediately think of some fraught geopolitical event. Statisticians use the phrase differently, in a way that has high relevance for demand planning and inventory optimization. This blog is about “regime change” in the statistical sense, meaning a major change in the character of the demand for an inventory item.

      An item’s demand history is the fuel that powers demand planners’ forecasting machines. In general, the more fuel the better, giving us a better fix on the average level, the volatility, the size and frequency of any spikes, the shape of any seasonality pattern, and the size and direction of any trend.

      But there is one big exception to the rule that “more data is better data.” If there is a major shift in your world and new demand doesn’t look like old demand, then old data become dangerous.

      Modern software can make accurate forecasts of item demand and suggest wise choices for inventory parameters like reorder points and order quantities. But the validity of these calculations depends on the relevance of the data used in their calculation. Old data from an old regime no longer reflect current reality, so including them in calculations creates forecast error for demand planners and either excess stock or unacceptable stockout rates for inventory planners.

      That said, if you were to endure a recent regime change and throw out the obsolete data, you would have a lot less data to work with. This has its own costs, because all the estimates computed from the data would have greater statistical uncertainty even though they would be less biased. In this case, your calculations would have to rely more heavily on a blend of statistical analysis and your own expert judgement.

      At this point, you may ask “How can I know if and when there has been a regime change?” If you’ve been on the job for a while and are comfortable looking at timeplots of item demand, you will generally recognize regime change when you see it, at least if it’s not too subtle. Figure 1 shows some real-world examples that are obvious.

      Figure 1 Four examples of regime change in real-world item demand

      Figure 1: Four examples of regime change in real-world item demand


      Unfortunately, less obvious changes can still have significant effects. Moreover, most of our customers are too busy to manually review all the items they manage even once per quarter. When you get beyond, say, 100 items, the task of eyeballing all those time series becomes onerous. Fortunately, software can do a good job of continuously monitoring demand for tens of thousands of items and alerting you to any items that may need your attention. Then too, you can arrange for the software to not only detect regime change but also automatically exclude from its calculations all data collected before the most recent regime change, if any. In other words, you can get both automatic warning of regime change and automatic protection from regime change.

      For more on the basics of regime change, see our previous blog on the topic: https://smartcorp.com/blog/demandplanningregimechange/  


      An Example with Numbers in It

      If you would like to learn more, read on to see a numerical example of how much regime change can alter the calculation of a reorder point for a critical spare part. Here is a scenario to illustrate the point.

      Scenario

      • Goal: calculate the reorder point needed to control the risk of stockout while waiting for replenishment. Assume the target stockout risk is 5%.
      • Assume the item has intermittent daily demand, with many days of zero demand.
      • Assume daily demand has a Poisson distribution with an average of 1.0 units per day.
      • Assume the replenishment lead time is always 30 days.
      • The lead time demand will be random, so it will have a probability distribution and the reorder point will be the 95th percentile of the distribution.
      • Assume the effect of regime change is to either raise or lower the mean daily demand.
      • Assume there is one year of daily data available for estimating the mean daily unit demand.


      Figure 2 Example of change in mean demand and sample of random daily demand

      Figure 2 Example of change in mean demand and sample of random daily demand


      Figure 2 shows one form of this scenario. The top panel shows that the average daily demand increases from 1.0 to 1.5 after 270 days. The bottom panel shows one way that a year’s worth of daily demand might appear. (At this point, you may be feeling that calculating all this stuff is complicated, even for what turns out to be a simplified scenario. That is why we have software!)

      Analysis

      Successful calculation of the proper reorder point will depend on when regime change happens and how big a change occurs. We simulated regime changes of various sizes at various times within a 365 day period. Around a base demand of 1.0 units per day, we studied shifts in demand (“shift”) of ±25% and ±50% as well as a no change reference case. We located the time of the change (“t.break”) at 90, 180, and 270 days. In each case, we computed two estimates of the reorder point: The “ideal” value given perfect knowledge of the average demand in the new regime (“ROP.true”), and the estimated value of mean demand computed by ignoring the regime change and using all the demand data for the past year (“ROP.all”).

      Table 1 shows the estimates of the reorder point computed over 100 simulations. The center block is the reference case, in which there is no change in the daily demand, which remains fixed at 1 unit per day. The colored block at the bottom is the most extreme increasing scenario, with demand increasing to 1.5 units/day either one-third, one-half, or two-thirds of the way through the year.

      We can draw several conclusions from these simulations.

      ROP.true: The correct choice for reorder point increases or decreases according to the change in mean demand after the regime change. The relationship is not a simple linear one: the table spans a 600% range of demand levels (0.25 to 1.50) but a 467% range of reorder points (from 12 to 56).

      ROP.all: Ignoring the regime change can lead to gross overestimates of the reorder point when demand drops and gross underestimates when demand increases.  As we would expect, the later the regime change, the worse the error. For example, if demand increases from 1.0 to 1.5 units per day two-thirds of the way through the year without being noticed, the calculated reorder point of 43 units would fall 13 units short of where it should be.

      A word of caution: Table 1 shows that basing the calculations of reorder points using only data from after a regime change will usually get the right answer. What it doesn’t show is that the estimates can be unstable if there is very little demand history after the change. Therefore, in practice, you should wait to react to the regime change until a decent number of observations have accumulated in the new regime. This might mean using all the demand history, both pre- and post-change, until, say, 60 or 90 days of history have accumulated before ignoring pre-change data.


      Table 1 Correct and Estimated Reorder Points for different regime change scenarios

      Table 1 Correct and Estimated Reorder Points for different regime change scenarios

      The Supply Chain Blame Game: Top 3 Excuses for Inventory Shortage and Excess

      1. Blaming Shortages on Lead Time Variability
      Suppliers will often be late, sometimes by a lot. Lead time delays and supply variability are supply chain facts of life, yet inventory carrying organizations are often caught by surprise when a supplier is late.  An effective inventory planning process embraces these facts of life and develops policies that effectively account for this uncertainty.  Sure, there will be times when lead time delays come out of nowhere.  But most often the stocking policies like reorder points, safety stocks, and Min/Max levels aren’t recalibrated often enough to catch changes in the lead time over time.  Many companies only review the reorder point after it has been breached, instead of recalibrating after each new lead time receipt.  We’ve observed situations where the Min/Max settings are only recalibrated annually or are even entirely manual.  If you have a mountain of parts using old Min/Max levels and associated lead times that were relevant a year ago, it should be no surprise that you don’t have enough inventory to hold you until the next order arrives.


      2. Blaming Excess on Bad Sales/Customer Forecasts
      Forecasts from your customers or your sales team are often intentionally over-estimated to ensure supply, in response to past inventory shortages where they were left out to dry. Or, the demand forecasts are inaccurate simply because the sales team doesn’t really know what their customer demand is going to be but are forced to give a number. Demand Variability is another supply chain fact of life, so planning processes need to do a better job account for it.  Why should rely on sales teams to forecast when they best serve the company by selling? Why bother playing the game of feigning acceptance of customer forecasts when both sides know it is often nothing more than a WAG?  A better way is to accept the uncertainty and agree on a degree of stockout risk that is acceptable across groups of items.  Once the stockout risk is agreed to, you can generate an accurate estimate of the safety stock needed to counter the demand variability.  The catch is getting buy-in, since you may not be able to afford super high service levels across all items.  Customers must be willing to pay a higher price per unit for you to deliver extremely high service levels.  Sales people must accept that certain items are more likely to have backorders if they prioritize inventory investment on other items.  Using a consensus safety stock process ensures you are properly buffering and setting the right expectations.  When you do this, you free all parties from having to play the prediction game they were not equipped to play in the first place.


      3. Blaming Problems on Bad Data
      “Garbage In/Garbage Out” is a common excuse for why now is not the right time to invest in planning software. Of course, it is true that if you feed bad data into a model, you won’t get good results, but here’s the thing:  someone, somewhere in the organization is planning inventory, building a forecast, and making decisions on what to purchase. Are they doing this blindly, or are they using data they have curated in a spreadsheet to help them make inventory planning decisions? Hopefully, the latter.  Combine that internal knowledge with software, automating data import from the ERP, and data cleansing.  Once harmonized, your planning software will provide continually updated, well-structured demand and lead time signals that now make effective demand forecasting and inventory optimization possible.  Smart Software cofounder Tom Willemain wrote in an IBF newsletter that “many data problems derive from data having been neglected until a forecasting project made them important.” So, start that forecasting project, because step one is making sure that “what goes in” is a pristine, documented, and accurate demand signal.