Smart Software to Present at Epicor Insights 2024
Smart Software will present Epicor Insights 2024 sessions on combining AI with planner knowledge to make inventory data-driven decisions.
Belmont, MA, May 2024 – Smart Software, Inc., provider of industry-leading demand forecasting, planning, and inventory optimization solutions, today announced that it will present at Epicor Insights 2024 in Nashville, Tennessee.
Smart Software will be leading two sessions focused on combining demand forecasting and inventory planning AI with planner knowledge. These sessions are designed to empower Epicor Kinetic and Epicor Prophet 21 users to generate accurate forecasts and shape stocking policies that align with their business objectives.
Smart will also conduct two in-depth training lab sessions showcasing Smart Demand Planner and Smart Inventory Optimization, both integral parts of the Epicor Smart IP&O platform. Participants will gain expertise in precision forecasting and inventory management, learning to identify hidden risks in stocking policies, simulate various service strategy outcomes, and enhance forecast accuracy through comprehensive, multi-tiered analysis and scenario testing
Epicor Insight’s attendees may participate in any of the following sessions or Labs and are welcome to visit us at the Smart Software booth for a one-on-one consultation.
The Prophet 21 presentation is scheduled for Tuesday, May 21st, at 3:00 pm (CDT)

The Demand Planning Lab is scheduled for Wednesday, May 22nd, at 3:20 pm (CDT).

The Kinetic presentation is scheduled for Wednesday, May 22nd, at 4:20 pm (CDT)

The Inventory Optimization Lab is scheduled for Thursday, May 23rd, at 3:15 pm (CDT)

To learn more about Epicor Insights, visit here: https://www.epicor.com/en-us/customers/insights
About Smart Software, Inc.
Founded in 1981, Smart Software, Inc. is a leader in providing businesses with enterprise-wide demand forecasting, planning, and inventory optimization solutions. Smart Software’s demand forecasting and inventory optimization solutions have helped thousands of users worldwide, including customers such as Disney, Arizona Public Service, and Ameren. Smart’s Inventory Planning & Optimization Platform, Smart IP&O, provides demand planners the tools to handle sales seasonality, promotions, new and aging products, multi-dimensional hierarchies, and intermittently demanded service parts and capital goods items. It also provides inventory managers with accurate estimates of the optimal inventory and safety stock required to meet
For more information, please contact Smart Software, Inc., Four Hill Road, Belmont, MA 02478.
Phone: 1-800-SMART-99 (800-762-7899); FAX: 1-617-489-2748; E-mail: info@smartcorp.com
The Cost of Spreadsheet Planning
Companies that depend on spreadsheets for demand planning, forecasting, and inventory management are often constrained by the spreadsheet’s inherent limitations. This post examines the drawbacks of traditional inventory management approaches caused by spreadsheets and their associated costs, contrasting these with the significant benefits gained from embracing state-of-the-art planning technologies.
Spreadsheets, while flexible for their infinite customizability, are fundamentally manual in nature requiring significant data management, human input, and oversight. This increases the risk of errors, from simple data entry mistakes to complex formula errors, that cause cascading effects that adversely impact forecasts. Additionally, despite advances in collaborative features that enable multiple users to interact with a common sheet, spreadsheet-based processes are often siloed. The holder of the spreadsheet holds the data. When this happens, many sources of data truth begin to emerge. Without the trust of an agreed-upon, pristine, and automatically updated source of data, organizations don’t have the necessary foundation from which predictive modeling, forecasting, and analytics can be built.
In contrast, advanced planning systems like Smart IP&O are designed to overcome these limitations. Such systems are built to automatically ingest data via API or files from ERP and EAM systems, transform that data using built in ETL tools, and can process large volumes of data efficiently. This enables businesses to manage complex inventory and forecasting tasks with greater accuracy and less manual effort because the data collection, aggregation, and transformation is already done. Transitioning to advanced planning systems is key for optimizing resources for several reasons.
Spreadsheets also have a scaling problem. The bigger the business grows, the greater the number of spreadsheets, workbooks, and formulas becomes. The result is a tightly wound and rigid set of interdependencies that become unwieldy and inefficient. Users will struggle to handle the increased load and complexity with slow processing times and an inability to manage large datasets and face challenges collaborating across teams and departments.
On the other hand, advanced planning systems for inventory optimization, demand planning, and inventory management are scalable, designed to grow with the business and adapt to its changing needs. This scalability ensures that companies can continue to manage their inventory and forecasting effectively, regardless of the size or complexity of their operations. By transitioning to systems like Smart IP&O, companies can not only improve the accuracy of their inventory management and forecasting but also gain a competitive edge in the market by being more responsive to changes in demand and more efficient in their operations.
Benefits of Jumping in: An electric utility company struggled to maintain service parts availability without overstocking for over 250,000-part numbers across a diverse network of power generation and distribution facilities. It replaced their twenty-year-old legacy planning process that made heavy use of spreadsheets with Smart IP&O and a real-time integration to their EAM system. Before Smart, they were only able to modify Min/Max and Safety Stock levels infrequently. When they did, it was nearly always because a problem occurred that triggered the review. The methods used to change the stocking parameters relied heavily on gut feel and averages of the historical usage. The Utility leveraged Smart’s what-if scenarios to create digital twins of alternate stocking policies and simulated how each scenario would perform across key performance indicators such as inventory value, service levels, fill rates, and shortage costs. The software pinpointed targeted Min/Max increases and decreases that were deployed to their EAM system, driving optimal replenishments of their spare parts. The result: A significant inventory reduction of $9 million that freed up cash and valuable warehouse space while sustaining 99%+ target service levels.
Managing Forecast Accuracy: Forecast error is an inevitable part of inventory management, but most businesses don’t track it. As Peter Drucker said, “You can’t improve what you don’t measure.” A global high-tech manufacturing company utilizing a spreadsheet-based forecast process had to manually create its baseline forecasts and forecast accuracy reporting. Given the planners’ workload and siloed processes, they just didn’t update their reports very often, and when they did, the results had to be manually distributed. The business didn’t have a way of knowing just how accurate a given forecast was and couldn’t cite their actual errors by group of part with any confidence. They also didn’t know whether their forecasts were outperforming a control method. After Smart IP&O went live, the Demand Planning module automated this for them. Smart Demand Planner now automatically reforecasts their demand each planning cycle utilizing ML methods and saves accuracy reports for every part x location. Any overrides that are applied to the forecasts can now be auto-compared to the baseline to measure forecast value add – i.e., whether the additional effort to make those changes improved the accuracy. Now that the ability to automate the baseline statistical forecasting and produce accuracy reports is in place, this business has solid footing from which to improve their forecast process and resulting forecast accuracy.
Get it Right and Keep it Right: Another customer in the aftermarket parts business has used Smart’s forecasting solutions since 2005 – nearly 20 years! They were faced with challenges forecasting intermittently demanded parts sold to support their auto aftermarket business. By replacing their spreadsheet-based approach and manual uploads to SAP with statistical forecasts of demand and safety stock from SmartForecasts, they were able to significantly reduce backorders and lost sales, with fill rates improving from 93% to 96% within just three months. The key to their success was leveraging Smart’s patented method for forecasting intermittent demand – The “Smart-Willemain” bootstrap method generated accurate estimates of the cumulative demand over the lead time that helped ensure better visibility of the possible demands.
Connecting Forecasts to the Inventory Plan: Advanced planning systems support forecast-based inventory management, which is a proactive approach that relies on demand forecasts and simulations to predict possible outcomes and their associated probabilities. This data is used to determine optimal inventory levels. Scenario-based or probabilistic forecasting contrasts with the more reactive nature of spreadsheet-based methods. A longtime customer in the fabric business, previously dealt with overstocks and stockouts due to intermittent demand for thousands of SKUs. They had no way of knowing what their stock-out risks were and so couldn’t proactively modify policies to mitigate risk other than making very rough-cut assumptions that tended to overstock grossly. They adopted Smart Software’s demand and inventory planning software to generate simulations of demand that identified optimal Minimum On-Hand values and order quantities, maintaining product availability for immediate shipping, highlighting the advantages of a forecast-based inventory management approach.
Better Collaboration: Sharing forecasts with key suppliers helps to ensure supply. Kratos Space, part of Kratos Defense & Security Solutions, Inc., leveraged Smart forecasts to provide their Contract Manufacturers with better insights on future demand. They used the forecasts to make commitments on future buys that enabled the CM to reduce material costs and lead times for engineered-to-order systems. This collaboration demonstrates how advanced forecasting techniques can lead to significant supply chain collaboration that yields efficiencies and cost savings for both parties.
Smart Software Announces Strategic Partnership with Sage for Inventory Optimization and Demand Forecasting
Belmont, MA, February 2024 –Smart Software, a global provider of next-generation cloud-based inventory optimization, demand planning, and forecasting solutions, announces today their strategic partnership with Sage.
This collaboration brings Smart IP&O (Inventory Planning and Optimization) into the latest cloud and on-premises versions of Sage X3, Sage 300, and Sage 100. By seamlessly integrating strategic planning with operational execution, users can eliminate reactive inventory planning and forecast guesswork by accurately calibrating risks, tradeoffs, and consequences at scale with Smart IP&O.
Sage is the leader in accounting, financial, HR and payroll technology for small and mid-sized businesses (SMBs). Customers trust Sage’s comprehensive suite of finance, HR, and Supply Chain software to streamline processes and simplify operational tasks. This integrated approach to solving business challenges ensures seamless interactions and delivers valuable insights to SMBs, reinforcing Sage’s position as a leader in the industry.
“Smart Software helps our customers by delivering insightful business analytics for inventory modeling and forecasting that drive ordering and replenishment in the latest version of Sage. With Smart IP&O, our customers gain a means to shape inventory strategy to align with the business objectives while empowering their planning teams to reduce inventory and improve service,” says Regina Crowshaw, Director of ISV Strategy, Sales, and Programs at Sage.
“Sage drives innovation and fosters business growth by delivering insightful solutions designed to enable organizations to scale and succeed. By leveraging the capabilities of Smart’s field-proven demand forecasting and inventory planning solutions, Sage is poised to supply the necessary expertise to assess needs, establish objectives, and craft the underlying business strategies key for ensuring widespread adoption and deriving maximum benefit. We look ahead to what we can accomplish together, and we look forward to our joint success”, says Greg Hartunian, President and CEO at Smart Software.
About Smart Software, Inc.
Founded in 1981, Smart Software, Inc. is a leader in providing businesses with enterprise-wide demand forecasting, planning, and inventory optimization solutions. Smart Software’s demand forecasting and inventory optimization solutions have helped thousands of users worldwide, including customers such as Disney, Arizona Public Service, and Ameren. Smart’s Inventory Planning & Optimization Platform, Smart IP&O, provides demand planners the tools to handle sales seasonality, promotions, new and aging products, multi-dimensional hierarchies, and intermittently demanded service parts and capital goods items. It also provides inventory managers with accurate estimates of the optimal inventory and safety stock required to meet future orders and achieve desired service levels. Smart Software is headquartered in Belmont, Massachusetts, and our website is www.smartcorp.com.
About Sage Corporation
Sage exists to knock down barriers so everyone can thrive, starting with the millions of Small and Mid-Sized Businesses served by us, our partners, and accountants. Customers trust our finance, HR, and payroll software to make work and money flow. By digitizing business processes and relationships with customers, suppliers, employees, banks, and governments, our digital network connects SMBs, removing friction and delivering insights. Knocking down barriers also means we use our time, technology, and experience to tackle digital inequality, economic inequality and the climate crisis.
For more information, please contact Smart Software, Inc., Four Hill Road, Belmont, MA 02478.
Phone: 1-800-SMART-99 (800-762-7899); FAX: 1-617-489-2748; E-mail: info@smartcorp.com
Why Inventory Planning Shouldn’t Rely Exclusively on Simple Rules of Thumb
For too many companies, a critical piece of data fact-finding ― the measurement of demand uncertainty ― is handled by simple but inaccurate rules of thumb. For example, demand planners will often compute safety stock by a user-defined multiple of the forecast or historical average. Or they may configure their ERP to order more when on hand inventory gets to 2 x the average demand over the lead time for important items and 1.5 x for less important ones. This is a huge mistake with costly consequences.
The choice of multiple ends up being a guessing game. This is because no human being can compute exactly how much inventory to stock considering all the uncertainties. Multiples of the average lead time demand are simple to use but you can never know whether the multiple used is too large or too small until it is too late. And once you know, all the information has changed, so you must guess again and then wait and see how the latest guess turns out. With each new day, you have new demand, new details on lead times, and the costs may have changed. Yesterday’s guess, no more matter how educated is no longer relevant today. Proper inventory planning should be void of inventory and forecast guesswork. Decisions must be made with incomplete information but guessing is not the way to go.
Knowing how much to buffer requires a fact-based statistical analysis that can accurately answer questions such as:
- How much extra stock is needed to improve service levels by 5%
- What the hit to on-time delivery will be if inventory is reduced by 5%
- What service level target is most profitable.
- How will the stockout risk be impacted by the random lead times we face.
Intuition can’t answer these questions, doesn’t scale across thousands of parts, and is often wrong. Data, probability math and modern software are much more effective. Winging it is not the path to sustained excellence.
Using Key Performance Predictions to Plan Stocking Policies
I can’t imagine being an inventory planner in spare parts, distribution, or manufacturing and having to create safety stock levels, reorder points, and order suggestions without using key performance predictions of service levels, fill rates, and inventory costs:
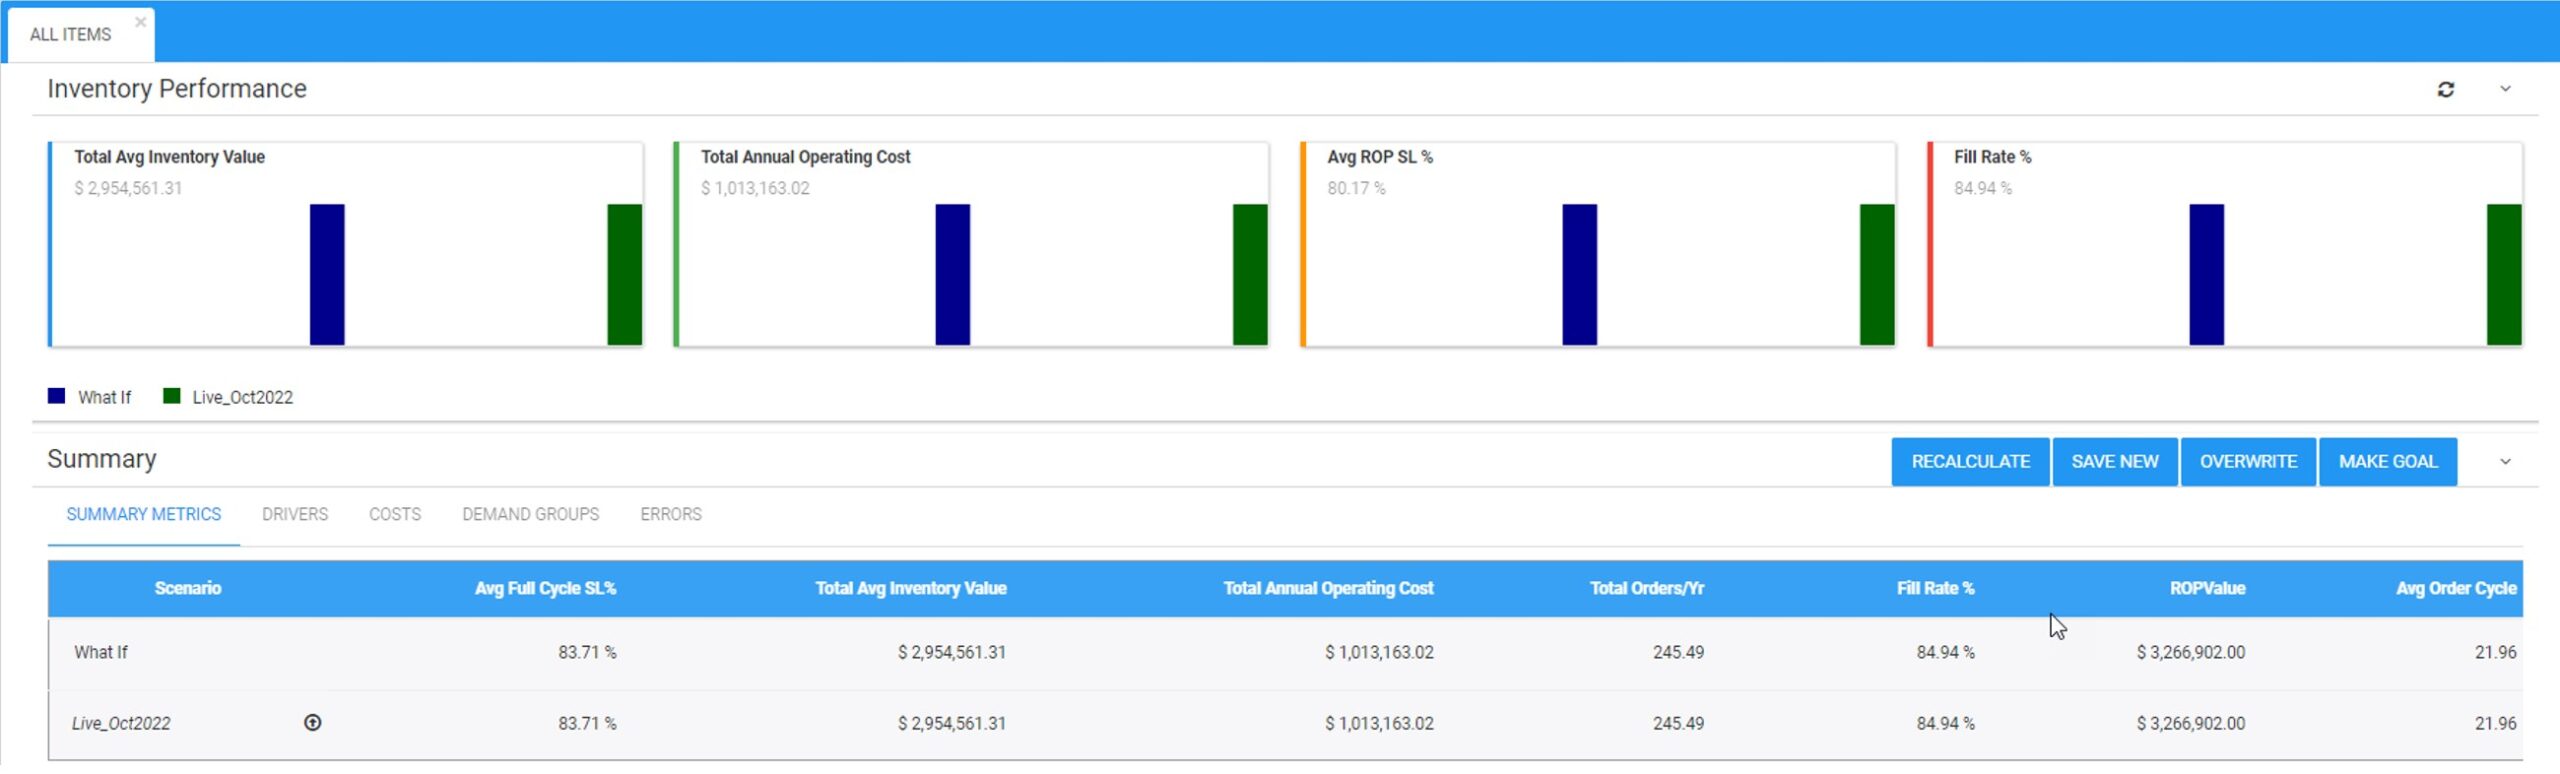
Smart’s Inventory Optimization solution generates out-of-the-box key performance predictions that dynamically simulate how your current stocking policies will perform against possible future demands. It reports on how often you’ll stock out, the size of the stockouts, the value of your inventory, holding costs, and more. It lets you proactively identify problems before they occur so you can take corrective action in the short term. You can create what-if scenarios by setting targeted service levels and modifying lead times so you an see the predicted impact of these changes before committing to it.
For example,
- You can see if a proposed move from the current service level of 90% to a targeted service level of 97% is financially advantageous
- You can automatically identify if a different service level target is even more profitable to your business that the proposed target.
- You can see exactly how much you’ll need to increase your reorder points to accommodate a longer lead time.
If you aren’t equipping planners with the right tools, they’ll be forced to set stocking policies, safety stock levels, and create demand forecasts in Excel or with outdated ERP functionality. Not knowing how policies are predicted to perform will leave your company ill equipped to properly allocate inventory. Contact us today to learn how we can help!
