What We’re Up Against
As a third-generation Boston Red Sox fan, I’m disinclined to take advice from any New York Yankee ballplayer, even a great one but have to agree that sometimes, you just need to make a decision. However, wouldn’t it be better if we knew the tradeoffs associated with each decision. Perhaps one road is more scenic but takes longer while the other is more direct but boring. Then you wouldn’t have to simply “take it” but could make an informed decision based on the advantages/disadvantages of each approach.
In the supply chain planning world, the most fundamental decision is how to balance item availability against the cost of maintaining that availability (service levels and fill rates). At one extreme, you can grossly overstock and never run out until you go broke and have to close up shop from sinking all your cash into inventory that doesn’t sell. At the other extreme, you can grossly understock and save a bundle on inventory holding costs but go broke and have to close up shop because all your customers took their business elsewhere.
There is no escaping this fundamental tension. They way to survive and thrive is to find a productive and sustainable balance. To do that requires fact-based tradeoffs based on the numbers. To get the numbers requires software.
The general drift of things is obvious. If you decide to keep more inventory, you will have more Holding Costs, lower Shortage Costs, and possibly lower Ordering Costs. Whether this costs or saves money is impossible to know without some sophisticated analysis, but usually the result is that the Total Cost goes up. But if you do invest in more inventory, something will be gained, because you will offer your customers higher Service Levels and Fill Rates. How much higher requires, as you might guess, some sophisticated analysis.
Show Me the Numbers
This blog lays out what such an analysis looks like. There is no universal solution pointing you to the “right” decision. You might think that the right decision is the one that does best by your bottom line. But to get those numbers, you would need something rarely seen: an accurate model of customer behavior with regard to service level (check out our article “How to choose a target service level”) For example, at what point will a customer walk away and take their business elsewhere? Will it be after you stock out 1% of the time, 5% of time, 10% of the time? Will you still keep their business as long as you fill back orders quickly? Will it be after a back order of 1 day, 2 days? 3 weeks? Will it be after this happens one time on one an important part or many times across many parts? While modeling the precise service level that will allow you to keep your customer while minimizing costs seems like an unapproachable ideal, another type of sophisticated analysis is more pragmatic.
Inventory optimization and forecasting software can factor all associated costs such as the cost of stocking out, cost of holding inventory, and cost of ordering inventory in order to prescribe an optimal service level target that yields the lowest total cost. However, even that “optimal” service level is sensitive to changes in the costs making the results potentially questionable. For example, if you don’t accurately estimate the precise costs (shortage costs are the most difficult) it will be tough to definitely state something like “If I increase my on-hand inventory by an average of one unit for all items in an important product family, my company will see a net gain of $170,500. That gain increases until I get to 4 units. At 4 units and higher, the return declines due to excessive holding costs. So, the best decision factoring projected holding, ordering, and stockout is to increase inventory by 3 units to see a net gain of over $500,000.
Short of that ideal, you can do something that is simpler yet still extremely valuable: Quantify the tradeoff curve between inventory cost and item availability. While you won’t necessarily know the service level you should target, you will know the costs of varying service levels. Then you can earn your big bucks by finding a good place to be on that tradeoff curve and communicating where you at risk, where you aren’t, and setting expectations with customers and internal stakeholders. Without the tradeoff curve to guide you, you are flying blind with no way to rationally modify stocking policy.
A Scenario to Learn From
Let’s sketch out a realistic tradeoff curve. We start with a scenario requiring a management decision. The scenario we will use and associated assumptions about demand, lead times, and costs are detailed below:
Inventory Policy
- Periodic review – Reorder decisions made every 30 days
- Order-Up-To-Level (“S”) – Varied from 30 to 60 units
- Shortage Policy – Allow backorders, no lost orders
Demand
- Demand is intermittent
- Average = 0.8 units per day
- Standard deviation = 1.2 units per day
- Largest demand in a year ≈ 9
- % of days with no demand = 53%
Lead Time
- Random at either 7, 14 or 21 days with probabilities 70%, 20% and 10%, respectively
Cost Parameters
- Holding cost = $1 per day
- Ordering Cost = $10 per order without regard to size of order
- Shortage Cost = $100 per unit not immediately shipped from stock
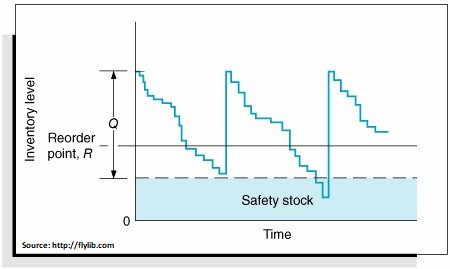
We imagine an inventory control policy that is known in the trade as a “periodic review” or (T,S) policy. In this instance, the Review Period (“T”) is 30 days, meaning that every 30 days the inventory position is checked and an ordering decision is made. The order quantity is the difference between the observed number of units on hand and the Order-Up-To Quantity (“S”). So, if the end-of-month inventory is 12 units and S = 20, the order quantity would be S – 12 = 20 -1 2 = 8. The next month, the order quantity is likely to be different. If the inventory ever goes negative (backorders) during a review period, the next order tries to restore equilibrium by ordering more in order to fill those backorders. For example, if the inventory is -5 (meaning 5 units ordered by not available for shipping, the next order would be S – (-5) = S + 5. Details of the hypothetical demand stream, supplier lead times, and cost elements are shown in Figure 1 below. Figure 2 show a sample of daily demand and daily inventory over five review periods. Demand is intermittent, as is often true for spare parts, and therefore difficult to plan for.
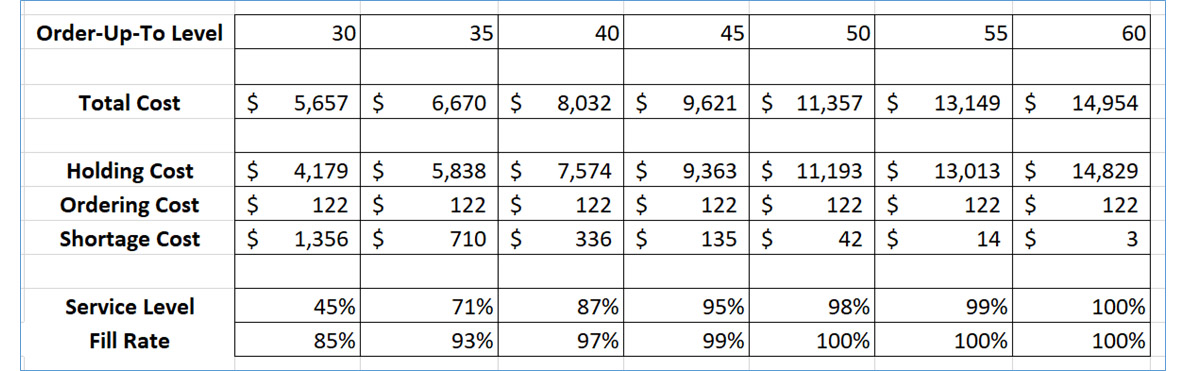
Figure 1: Different choices of inventory policy (order up to), associated costs, and service levels
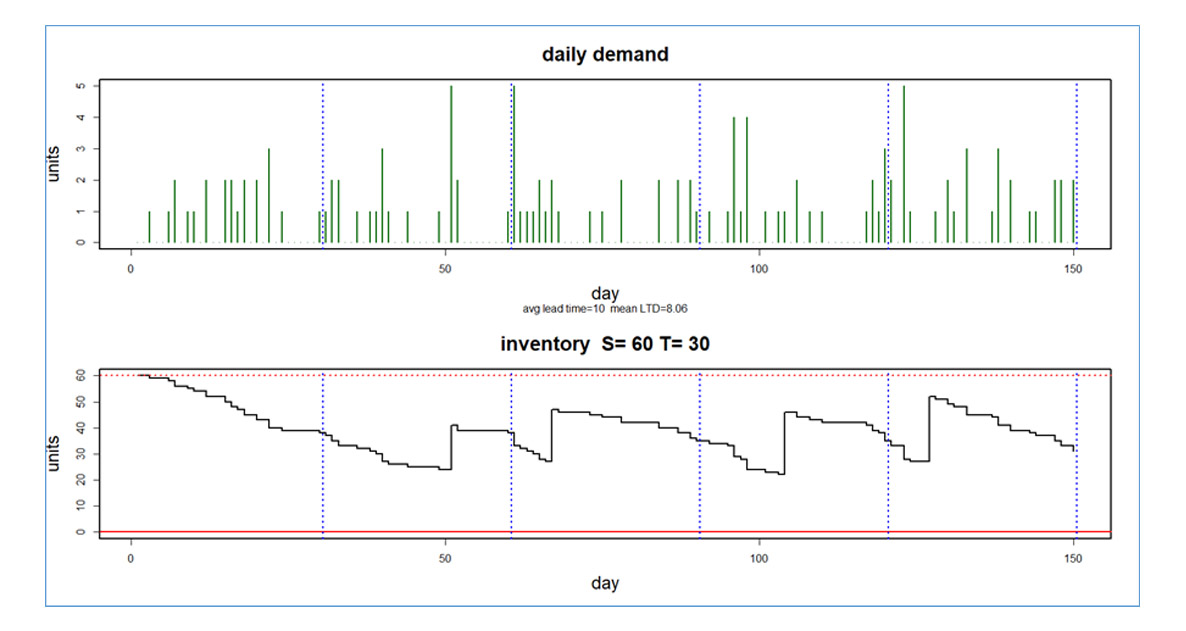
Figure 2: Details of five months of system operation given one of the polices
Inventory Planning Software Is Our Friend
Software encodes the logic of the operation of the (T,S) system, generates many hypothetical but realistic demand scenarios, calculates how each of those scenarios plays out, then looks back on the simulated operation (here, 10 years or 3,650 consecutive days) to calculate cost and performance metrics.
To reveal the tradeoff curve, we ran several computational experiments in which we varied the Order-Up-To Level, S. The plots Figure 2 show the behavior of the on-hand inventory in “richest” alternative with S = 60. In the snippet shown in Figure 2, the on-hand inventory never comes close to stocking out. You can read that too ways. One, a bit naïve, is to say “Good, we’re well protected.” The other, more aggressive, is to say, “Oh no, we’re bloated. I wonder what would happen if we reduced S.”
The Tradeoff Curve Revealed
Figure 3 shows the results of reducing S from 60 down to 30 in steps of 5 units. The table shows that Total Cost is the sum of Holding Cost, Ordering Cost, and Shortage Cost. For the (T,S) policy, the ordering cost is always the same, since an order is placed like clockwork every 30 days. But the other components of cost respond to the changes in S.
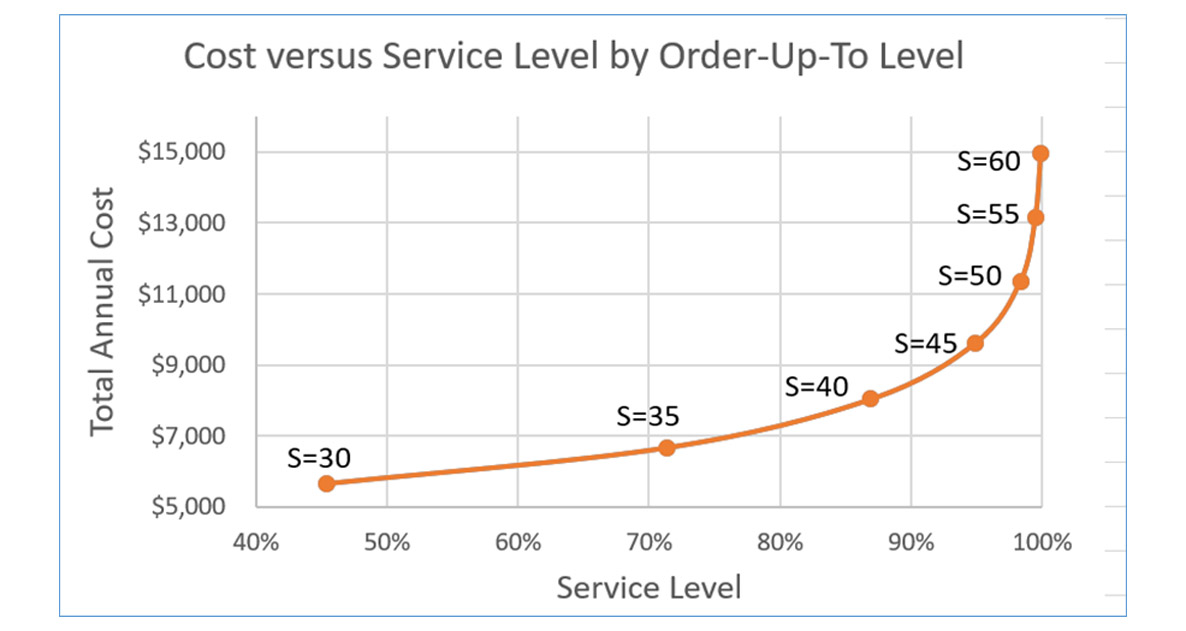
Figure 3: The experimental results and corresponding tradeoff curve showing how changing the Order-Up-To Level (“S”) impacts both Service Level and Total Annual Cost
Note that the Service Level is always lower than the Fill Rate in these scenarios. As a professor, I always think of this difference in terms of exam grading. Each replenishment cycle is like a test. Service Level is about the probability of a stockout, so it’s a like the grade on pass/fail exam with one question that must be answered perfectly. If there is no stockout in a cycle, that’s an A. If there is a stockout, that’s an F. It doesn’t matter if it’s one unit that’s not supplied or 50 – it’s still an F. But Fill Rate is like a question that is graded with partial credit. So being short one of ten units gets you 90% Fill Rate for that cycle, not 0%. It’s important to understand the difference between these two important metrics for inventory planning – check out this vlog describing service level vs. fill rate via an interactive exercise in Excel.
The plot in Figure 3 is the real news. It pairs Total Cost and Service Level for various levels of S. If you read the graph right to left, it tells us that there are dramatic cost savings to be had by reducing S with very little penalty in terms of reduced item availability. For instance, reducing S from 60 to 55 saves close to $800 per year on this one item while reducing service level just a bit from (essentially) 100% to a still-impressive 99%. Cutting S some more does the same, though not as dramatically. If you read the graph left to right, you see that moving up from S = 30 to S = 35 costs about $1,000 per year but improves Service Level from an F grade (45%) to at least a C grade (71%). After that, pushing S higher costs progressively more while gaining progressive less.
The tradeoff curve doesn’t give you an answer to how to set the Order-Up-To Level, but it does let you evaluate the costs and benefits of each possible answer. Take a minute and pretend that this is your problem: Where would you want to be along the tradeoff curve?
You may object and say you hate your choices and want to change the game. Is there escape from the curve? Not from the general curve, but you might be able to shape a less painful curve. How?
You may have other cards to play. One avenue is to try to “shape” the demand so that it is less variable. The demand plot in Figure 2 shows a lot of variability. If you could smooth out the demand, the whole tradeoff curve would shift down, making every choice less expensive. A second avenue is to try to reduce the mean and variability of supplier lead times. Achieving either would also shift the curve down to make the choice less painful. Check out our article on how suppliers influence your inventory costs
Summary
The tradeoff curve is always with us. Sometimes we may be able to make it more friendly, but we always to pick our spot along it. It is better to know what you’re getting for any choice of inventory policy than to try to guess, and the curve gives you that. When you have an accurate estimate of that curve, you are no longer flying blind when it comes to inventory planning.

Related Posts

Managing Spare Parts Inventory: Best Practices
In this blog, we’ll explore several effective strategies for managing spare parts inventory, emphasizing the importance of optimizing stock levels, maintaining service levels, and using smart tools to aid in decision-making. Managing spare parts inventory is a critical component for businesses that depend on equipment uptime and service reliability. Unlike regular inventory items, spare parts often have unpredictable demand patterns, making them more challenging to manage effectively. An efficient spare parts inventory management system helps prevent stockouts that can lead to operational downtime and costly delays while also avoiding overstocking that unnecessarily ties up capital and increases holding costs.

12 Causes of Overstocking and Practical Solutions
Managing inventory effectively is critical for maintaining a healthy balance sheet and ensuring that resources are optimally allocated. Here is an in-depth exploration of the main causes of overstocking, their implications, and possible solutions.

FAQ: Mastering Smart IP&O for Better Inventory Management.
Effective supply chain and inventory management are essential for achieving operational efficiency and customer satisfaction. This blog provides clear and concise answers to some basic and other common questions from our Smart IP&O customers, offering practical insights to overcome typical challenges and enhance your inventory management practices. Focusing on these key areas, we help you transform complex inventory issues into strategic, manageable actions that reduce costs and improve overall performance with Smart IP&O.
Recent Posts
 Managing Spare Parts Inventory: Best PracticesIn this blog, we’ll explore several effective strategies for managing spare parts inventory, emphasizing the importance of optimizing stock levels, maintaining service levels, and using smart tools to aid in decision-making. Managing spare parts inventory is a critical component for businesses that depend on equipment uptime and service reliability. Unlike regular inventory items, spare parts often have unpredictable demand patterns, making them more challenging to manage effectively. An efficient spare parts inventory management system helps prevent stockouts that can lead to operational downtime and costly delays while also avoiding overstocking that unnecessarily ties up capital and increases holding costs. […]
 5 Ways to Improve Supply Chain Decision SpeedThe promise of a digital supply chain has transformed how businesses operate. At its core, it can make rapid, data-driven decisions while ensuring quality and efficiency throughout operations. However, it's not just about having access to more data. Organizations need the right tools and platforms to turn that data into actionable insights. This is where decision-making becomes critical, especially in a landscape where new digital supply chain solutions and AI-driven platforms can support you in streamlining many processes within the decision matrix. […]
 12 Causes of Overstocking and Practical SolutionsManaging inventory effectively is critical for maintaining a healthy balance sheet and ensuring that resources are optimally allocated. Here is an in-depth exploration of the main causes of overstocking, their implications, and possible solutions. […]
 FAQ: Mastering Smart IP&O for Better Inventory Management.Effective supply chain and inventory management are essential for achieving operational efficiency and customer satisfaction. This blog provides clear and concise answers to some basic and other common questions from our Smart IP&O customers, offering practical insights to overcome typical challenges and enhance your inventory management practices. Focusing on these key areas, we help you transform complex inventory issues into strategic, manageable actions that reduce costs and improve overall performance with Smart IP&O. […]
 7 Key Demand Planning Trends Shaping the FutureDemand planning goes beyond simply forecasting product needs; it's about ensuring your business meets customer demands with precision, efficiency, and cost-effectiveness. Latest demand planning technology addresses key challenges like forecast accuracy, inventory management, and market responsiveness. In this blog, we will introduce critical demand planning trends, including data-driven insights, probabilistic forecasting, consensus planning, predictive analytics, scenario modeling, real-time visibility, and multilevel forecasting. These trends will help you stay ahead of the curve, optimize your supply chain, reduce costs, and enhance customer satisfaction, positioning your business for long-term success. […]

Inventory Optimization for Manufacturers, Distributors, and MRO
- Managing Spare Parts Inventory: Best PracticesIn this blog, we’ll explore several effective strategies for managing spare parts inventory, emphasizing the importance of optimizing stock levels, maintaining service levels, and using smart tools to aid in decision-making. Managing spare parts inventory is a critical component for businesses that depend on equipment uptime and service reliability. Unlike regular inventory items, spare parts often have unpredictable demand patterns, making them more challenging to manage effectively. An efficient spare parts inventory management system helps prevent stockouts that can lead to operational downtime and costly delays while also avoiding overstocking that unnecessarily ties up capital and increases holding costs. […]
 Innovating the OEM Aftermarket with AI-Driven Inventory OptimizationThe aftermarket sector provides OEMs with a decisive advantage by offering a steady revenue stream and fostering customer loyalty through the reliable and timely delivery of service parts. However, managing inventory and forecasting demand in the aftermarket is fraught with challenges, including unpredictable demand patterns, vast product ranges, and the necessity for quick turnarounds. Traditional methods often fall short due to the complexity and variability of demand in the aftermarket. The latest technologies can analyze large datasets to predict future demand more accurately and optimize inventory levels, leading to better service and lower costs. […]
 Future-Proofing Utilities: Advanced Analytics for Supply Chain OptimizationUtilities in the electrical, natural gas, urban water, and telecommunications fields are all asset-intensive and reliant on physical infrastructure that must be properly maintained, updated, and upgraded over time. Maximizing asset uptime and the reliability of physical infrastructure demands effective inventory management, spare parts forecasting, and supplier management. A utility that executes these processes effectively will outperform its peers, provide better returns for its investors and higher service levels for its customers, while reducing its environmental impact. […]
 Centering Act: Spare Parts Timing, Pricing, and ReliabilityIn this article, we'll walk you through the process of crafting a spare parts inventory plan that prioritizes availability metrics such as service levels and fill rates while ensuring cost efficiency. We'll focus on an approach to inventory planning called Service Level-Driven Inventory Optimization. Next, we'll discuss how to determine what parts you should include in your inventory and those that might not be necessary. Lastly, we'll explore ways to enhance your service-level-driven inventory plan consistently. […]
 In more technical detail: the forecasts errors that are estimated by this sliding simulation process indicate the level of uncertainty. We use these errors to estimate the standard deviation of the forecasts. Now, with regular demand, we can assume the forecasts (which are estimates of future behavior) are best represented by a bell-shaped probability distribution—what statisticians call the “normal distribution”. The center of that distribution is our point forecast. The width of that distribution is the standard deviation of the “sliding simulation” forecast from the known actual values—we obtain this directly from our forecast error estimates.