Smart Software to Present at NESCON 2020
Smart Software President and CEO to present NESCON New England Supply Chain Conference 2020 Breakout Session on Inventory Planning Processes
 
Belmont, Mass., October, 2020

Smart Software, Inc., provider of industry-leading demand forecasting, planning, and inventory optimization solutions, today announced that it will present at the  NESCON 2020, New England Supply Chain Conference & Exhibition. The presentation is scheduled for Oct. 5, 1:00 PM-1:30 PM.

Greg Hartunian, CEO of Smart Software, under the tittle “Traditional inventory Planning Processes: Problems and Solutions”, will present the Session. Greg will explain how to empower planning teams to reduce inventory, improve service levels, and increase operational efficiency.

Optimizing inventory can be made easy. Most inventory planning teams rely upon traditional forecasting approaches, rule of thumb methods, and sales feedback on demand. Our Breakout Session at NESCON discusses these approaches, why they often fail, and how new probabilistic forecasting and optimization methods can make a big difference to your bottom line.


About Smart Software, Inc.

Founded in 1981, Smart Software, Inc. is a leader in providing businesses with enterprise-wide demand forecasting, planning and inventory optimization solutions.  Smart Software’s demand forecasting and inventory optimization solutions have helped thousands of users worldwide, including customers at mid-market enterprises and Fortune 500 companies, such as Mitsubishi, Siemens, Disney, FedEx, MARS, and The Home Depot.  Smart Inventory Planning & Optimization gives demand planners the tools to handle sales seasonality, promotions, new and aging products, multi-dimensional hierarchies, and intermittently demanded service parts and capital goods items.  It also provides inventory managers with accurate estimates of the optimal inventory and safety stock required to meet future orders and achieve desired service levels.  Smart Software is headquartered in Belmont, Massachusetts and can be found on the World Wide Web at www.smartcorp.com.

SmartForecasts and Smart IP&O are registered trademarks of Smart Software, Inc.  All other trademarks are the property of their respective owners.


For more information, please contact Smart Software, Inc., Four Hill Road, Belmont, MA 02478.
Phone: 1-800-SMART-99 (800-762-7899); FAX: 1-617-489-2748; E-mail: info@smartcorp.com


What you Need to know about Inventory Forecasting and Planning

Q&A with Smart Software: Forecasting solutions and the business benefits of inventory optimization

Belmont, Mass., October, 2020 – Smart Software, Inc., provider of industry-leading demand forecasting, inventory planning, and inventory optimization solutions, announced today that SourceForge Online Magazine will feature an interview with Smart Software CEO, Greg Hartunian.  In the interview, Mr. Hartunian shares background on Smart Software’s 35 years in the planning software business, the business benefits of improving inventory planning and forecasting processes, and offers practical advice to help enterprises reduce standing inventory and increase service levels.
To read the article please visit https://sourceforge.net/articles/


Summit Group America Smart Software


About Smart Software, Inc.

Founded in 1981, Smart Software, Inc. is a leader in providing businesses with enterprise-wide demand forecasting, planning and inventory optimization solutions. Smart Software’s demand forecasting and inventory optimization solutions have helped thousands of users worldwide, including customers at mid-market enterprises and Fortune 500 companies, such as Mitsubishi, FedEx, MARS,  The Home Depot, Siemens and Disney, . Smart Inventory Planning & Optimization gives demand planners the tools to handle sales seasonality, promotions, new and aging products, multi-dimensional hierarchies, and intermittently demanded service parts and capital goods items. It also provides inventory managers with accurate estimates of the optimal inventory and safety stock required to meet future orders and achieve desired service levels. Smart Software is headquartered in Belmont, Massachusetts and can be found on the World Wide Web at www.smartcorp.com.

SmartForecasts and Smart IP&O are registered trademarks of Smart Software, Inc.  All other trademarks are the property of their respective owners.


For more information, please contact Smart Software, Inc., Four Hill Road, Belmont, MA 02478.
Phone: 1-800-SMART-99 (800-762-7899); FAX: 1-617-489-2748; E-mail: info@smartcorp.com


Otis

Smart Software to Present at P21WWUG CONNECT 2020

Smart Software to lead P21WWUG CONNECT 2020 Educational Video Sessions on Inventory Policies.

Belmont, Mass., August, 2020 – Smart Software, Inc., provider of industry-leading demand forecasting, inventory planning, and inventory optimization solutions, today announced that Dr. Thomas Willemain, co–Founder and SVP Research, will present the Video Session “Top Inventory Policies Explained” at P21WWUG CONNECT 2020 from August 14 through September 11 , 2020.

In this video Dr. Thomas Willemain, co–Founder and SVP Research, defines and compares commonly used inventory control policies. After a short introduction about Smart Software, Dr. Willemain reviews demand driven policies such as Min/Max and Reorder Point. This is followed by a description of Forecast Driven policies.  A better understanding of these policies and their pros and cons will enable you to configure P21 to better support your planning requirements.  The session concludes with a short demo of Smart Inventory Optimization. The demo shows how you can generate optimal planning parameters that will achieve your targeted service levels at the lowest cost and return the optimized policies to P21 in just a few mouse-clicks.

The Video Session will be accessible from August 14 through September 11. Smart Software will be also exhibiting at the Virtual Conference showcasing Smart Inventory Planning & Optimization.


Summit Group America Smart Software


About Smart Software, Inc.

Founded in 1981, Smart Software, Inc. is a leader in providing businesses with enterprise-wide demand forecasting, planning and inventory optimization solutions. Smart Software’s demand forecasting and inventory optimization solutions have helped thousands of users worldwide, including customers at mid-market enterprises and Fortune 500 companies, such as Mitsubishi, Siemens, Disney, FedEx, MARS, and The Home Depot. Smart Inventory Planning & Optimization gives demand planners the tools to handle sales seasonality, promotions, new and aging products, multi-dimensional hierarchies, and intermittently demanded service parts and capital goods items. It also provides inventory managers with accurate estimates of the optimal inventory and safety stock required to meet future orders and achieve desired service levels. Smart Software is headquartered in Belmont, Massachusetts and can be found on the World Wide Web at www.smartcorp.com.

SmartForecasts and Smart IP&O are registered trademarks of Smart Software, Inc.  All other trademarks are the property of their respective owners.


For more information, please contact Smart Software, Inc., Four Hill Road, Belmont, MA 02478.
Phone: 1-800-SMART-99 (800-762-7899); FAX: 1-617-489-2748; E-mail: info@smartcorp.com


Otis


5 Demand Planning Tips for Calculating Forecast Uncertainty

The Smart Forecaster

 Pursuing best practices in demand planning,

forecasting and inventory optimization

Those who produce forecasts owe it to those who consume forecasts, and to themselves, to be aware of the uncertainty in their forecasts. This note is about how to estimate forecast uncertainty and use the estimates in your demand planning process. We focus on forecasts made in support of demand planning as well as forecasts inherent in optimizing inventory policies involving reorder points, safety stocks, and min/max levels.

Reading this, you will learn about:

-Criteria for assessing forecasts
-Sources of forecast error
-Calculating forecast error
-Converting forecast error into prediction intervals
-The relationship between demand forecasting and inventory optimization.
-Actions you can take to use these concepts to improve your company’s processes.

Criteria for Assessing Forecasts

Forecast error alone is not reason enough to reject forecasting as a management tool. To twist a famous aphorism by George Box, “All forecasts are wrong, but some are useful.” Of course, business professionals will always search for ways to make forecasts more useful. This usually involves work to reduce forecast error. But while forecast accuracy is the most obvious criterion by which to judge forecasts, but it is not the only one. Here’s a list of criteria for evaluating forecasts:

Accuracy: Forecasts of future values should, in retrospect, be very close to the actual values that eventually reveal themselves. But there may be diminishing returns to squeezing another half percent of accuracy out of forecasts otherwise good enough to use in decision making.

Timeliness: Fighter pilots refer to the OODA Loop (Observe, Orient, Decide, and Act) and the “need to get inside the enemy’s OODA loop” so they can shoot first. Businesses too have decision cycles. Delivering a perfectly accurate forecast the day after it was needed is not helpful. Better is a good forecast that arrives in time to be useful.

Cost: Forecasting data, models, processes and people all cost money.  A less expensive forecast might be fueled by data that are readily available; more expensive would be a forecast that runs on data that have to be collected in a special process outside the scope of a firm’s information infrastructure.  A classic, off-the-shelf forecasting technique will be less costly to acquire, feed and exploit than a complex, custom, consultant-supplied method. Forecasts could be mass-produced by software overseen by a single analyst, or they might emerge from a collaborative process requiring time and effort from large groups of people, such as district sales managers, production teams, and others. Technically advanced forecasting techniques often require hiring staff with specialized technical expertise, such as a master’s degree in statistics, who tend to cost more than staff with less advanced training.

Credibility: Ultimately, some executive has to accept and act on each forecast. Executives have a tendency to distrust or ignore recommendations that they can neither understand nor explain to the next person above them in the hierarchy. For many, believing in a “black box” is too severe a test of faith, and they reject the black box’s forecasts in favor of something more transparent.

All that said, we will focus now on forecast accuracy and its evil twin, forecast error.

Sources of Forecast Error

Those seeking to reduce error can look in three places to find trouble:
1. The data that goes into a forecasting model
2. The model itself
3. The context of the forecasting exercise

There are several ways in which data problems can lead to forecast error.

Gross errors: Wrong data produce wrong forecasts. We have seen an instance in which computer records of product demand were wrong by a factor of two! Those involved spotted that problem immediately, but a less egregious situation can easily slip through to poison the forecasting process. In fact, just organizing, acquiring and checking data is often the largest source of delay in the implementation of forecasting software. Many data problems seem to derive from the data having been unimportant until a forecasting project made them important.

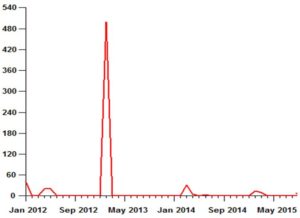
Anomalies: Even with perfectly curated forecasting databases, there are often “needle in a haystack” type data problems. In these cases, it is not data errors but demand anomalies that contribute to forecast error. In a set of, say, 50,000 products, some number of items are likely to have odd details that can distort forecasts.

Holdout analysis is a simple but powerful method of analysis. To see how well a method forecasts, use it with older known data to forecast newer data, then see how it would have turned out! For instance, suppose you have 36 months of demand data and need to forecast 3 months ahead. You can simulate the forecasting process by holding out (i.e., hiding) the most recent 3 months of data, forecasting using only data from months 1 to 33, then comparing the forecasts for months 34-36 against the actual values in months 34-36. Sliding simulation merely repeats the holdout analysis, sliding along the demand history. The example above used the first 33 months of data to get 3 estimates of forecast error. Suppose we start the process by using the first 12 months to forecast the next 3. Then we slide forward and use the first 13 months to forecast the next 3. We continue until finally we use the first 35 months to forecast the last month, giving us one more estimate of the error we make when forecasting one month ahead. Summarizing all the 1-step ahead, 2-step ahead and 3-step ahead forecast errors provides a way to calculate prediction intervals.

Calculating Prediction Intervals

The final step in calculating prediction intervals is to convert the estimates of average absolute error into the upper and lower limits of the prediction interval. The prediction interval at any future time is computed as

Prediction interval = Forecast ± Multiplier x Average absolute error.

The final step is the choice of the multiplier. The typical approach is to imagine some probability distribution of error around the forecast, then estimate the ends of the prediction interval using appropriate percentiles of that distribution. Usually, the assumed distribution of error is the Normal distribution, also called the Gaussian distribution or the “bell-shaped curve”.

Use of Prediction Intervals
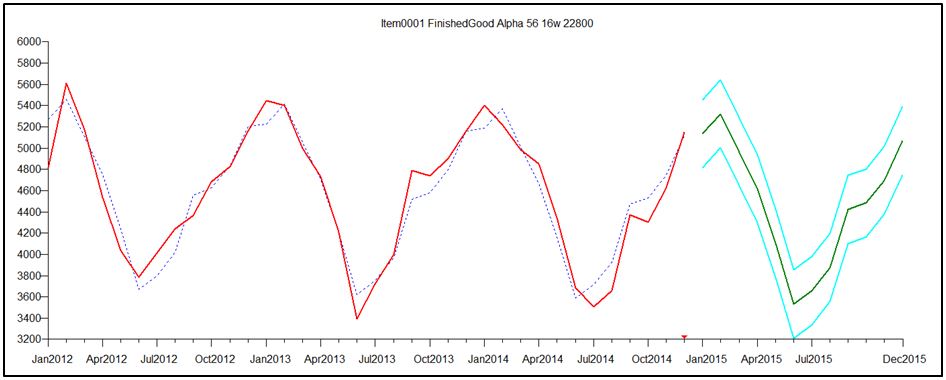
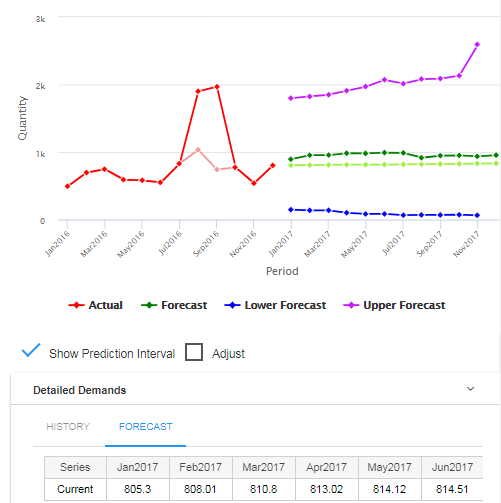
The most immediate, informal use of prediction intervals is to convey a sense of how “squishy” a forecast is. Prediction intervals that are wide compared to the size of the forecasts indicate high uncertainty.

There are two more formal uses in demand forecasting: Hedging your bets about future demand and guiding forecast adjustment.

Hedging your bets: The forecast values themselves approximate the most likely values of future demand. A more ominous way to say the same thing is that there is about a 50% chance that the actual value will be above (or below) the forecast. If the forecast is being used to plan future production (or raw materials purchase or hiring), you might want to build in a cushion to keep from being caught short if demand spikes (assuming that under-building is worse than over-building). If the forecast is converted from units to dollars for revenue projections, you might want to use a value below the forecast to be conservative in projecting cash flow. In either case, you first have to choose the coverage of the prediction interval. A 90% prediction interval is a range of values that covers 90% of the possibilities. This implies that there is a 5% chance of a value falling above the upper limit of the 90% prediction interval. In other words, the upper limit of a 90% prediction interval marks the 95th percentile of the distribution of predicted demand at that time period. Similarly, there is a 5% chance of falling below the lower limit, which marks the 5th percentile of the demand distribution.

Guiding forecast adjustment: It is quite common for statistical forecasts to be revised by some sort of collaborative process. These adjustments are based on information not recorded in an item’s demand history, such as intelligence about competitor actions. Sometimes they are based on a more vaporous source, such as sales force optimism. When the adjustments are made on-screen for all to see, the prediction intervals provide a useful reference: If someone wants to move the forecasts outside the prediction intervals, they are crossing a fact-based line and should have a good story to justify their argument that things will be really different in the future.

Prediction Intervals and Inventory Optimization

Finally, the concept behind prediction intervals play an essential role in a problem related to demand forecasting: Inventory Optimization.
The core analytic task in setting reorder points (also called Mins) is to forecast total demand over a replenishment lead time. This total is called the lead time demand. When on-hand inventory falls down to or below the reorder point, a replenishment order is triggered. If the reorder point is high enough, there will be an acceptably small risk of a stockout, i.e., of lead time demand driving inventory below zero and creating either lost sales or backorders.

SDP_Screenshot new statistical methods planning

New statistical methods, and we can start planning more effectively.

The forecasting task is to determine all the possible values of cumulative demand over the lead time and their associated probabilities of occurring. In other words, the basic task is to determine a prediction interval for some future random variable. Suppose you have computed a 90% prediction interval for lead time demand. Then the upper end of the interval represents the 95th percentile of the distribution. Setting the reorder point at this level will accommodate 95% of the possible lead time demand values, meaning there will be only a 5% chance of stocking out before replenishment arrives to re-stock the shelves. Thus there is an intimate relationship between prediction intervals in demand forecasting and calculation of reorder points in inventory optimization.


5 Recommendations for Practice

1. Set expectations about error: Sometimes  managers have unreasonable expectations about reducing forecast error to zero. You can point out that error is only one of the dimensions on which a forecasting process must be judged; you may be doing fine on both timeliness and cost. Also point out that zero error is no more realistic a goal than 100% conversion of prospects into customers, perfect supplier performance, or zero stock price volatility.

2. Track down sources of error: Double check the accuracy of demand histories. Use statistical methods to identify outliers in demand histories and react appropriately, replacing verified anomalies with more typical values and omitting data from before major changes in the character of the demand. If you use a collaborative forecasting process, compare its accuracy against a purely statistical approach to identify items for which collaboration does not reduce error.

3. Evaluate the error of alternative statistical methods: There may be off-the-shelf techniques that do better than your current methods, or do better for some subsets of your items. The key is to be empirical, using the idea of holdout analysis. Gather your data and do a “bake off” between different methods to see which work better for you. If you are not already using statistical forecasting methods, compare them against whoever’s “golden gut” is your current standard. Use the naïve forecast as a benchmark in the comparisons.

4. Investigate the use of new data sources: Especially if you have items that are heavily promoted, test out statistical methods that incorporate promotional data into the forecasting process. Also check whether information from outside your company can be exploited; for instance, see whether macroeconomic indicators for your sector can be combined with company data to improve forecast accuracy (this is usually done using a method called multiple regression analysis).

5. Use prediction intervals: Plots of prediction intervals can improve your feel for the uncertainty in your forecasts, helping you select items for additional scrutiny. While it’s true that what you don’t know can hurt you, it’s also true that knowing what you don’t know can help you.

Leave a Comment

Related Posts

Key Considerations When Evaluating your ERP system’s Forecasting Capabilities

Key Considerations When Evaluating your ERP system’s Forecasting Capabilities

Consider what is meant by “demand management”, “demand planning”, and “forecasting”. These terms imply certain standard functionality for collaboration, statistical analysis, and reporting to support a professional demand planning process.  However, in most ERP systems, “demand management” running MRP and reconciling demand and supply for the purpose of placing orders

The 3 Types of Supply Chain Analytics

The 3 Types of Supply Chain Analytics

The three types of supply chain analytics are “descriptive”, “predictive”, and “prescriptive.” Each plays a different role in helping you manage your inventory. Modern supply chain software lets you exploit all three helping you to reduce inventory costs, improve on time delivery and service levels, while running a more efficient supply chain.

The Right Forecast Accuracy Metric for Inventory Planning

The Right Forecast Accuracy Metric for Inventory Planning

Testing software solutions via a series of empirical competition can be an attractive option. In the case of forecasting and demand planning, a traditional “hold out” test is a good way to assess monthly or weekly forecast accuracy, but it is minimally useful if you have a different objective: Optimizing inventory.

Recent Posts

  • Managing Spare Parts Inventory: Best PracticesManaging Spare Parts Inventory: Best Practices
    In this blog, we’ll explore several effective strategies for managing spare parts inventory, emphasizing the importance of optimizing stock levels, maintaining service levels, and using smart tools to aid in decision-making. Managing spare parts inventory is a critical component for businesses that depend on equipment uptime and service reliability. Unlike regular inventory items, spare parts often have unpredictable demand patterns, making them more challenging to manage effectively. An efficient spare parts inventory management system helps prevent stockouts that can lead to operational downtime and costly delays while also avoiding overstocking that unnecessarily ties up capital and increases holding costs. […]
  • 5 Ways to Improve Supply Chain Decision Speed5 Ways to Improve Supply Chain Decision Speed
    The promise of a digital supply chain has transformed how businesses operate. At its core, it can make rapid, data-driven decisions while ensuring quality and efficiency throughout operations. However, it's not just about having access to more data. Organizations need the right tools and platforms to turn that data into actionable insights. This is where decision-making becomes critical, especially in a landscape where new digital supply chain solutions and AI-driven platforms can support you in streamlining many processes within the decision matrix. […]
  • Two employees checking inventory in temporary storage in a distribution warehouse.12 Causes of Overstocking and Practical Solutions
    Managing inventory effectively is critical for maintaining a healthy balance sheet and ensuring that resources are optimally allocated. Here is an in-depth exploration of the main causes of overstocking, their implications, and possible solutions. […]
  • FAQ Mastering Smart IP&O for Better Inventory ManagementFAQ: Mastering Smart IP&O for Better Inventory Management.
    Effective supply chain and inventory management are essential for achieving operational efficiency and customer satisfaction. This blog provides clear and concise answers to some basic and other common questions from our Smart IP&O customers, offering practical insights to overcome typical challenges and enhance your inventory management practices. Focusing on these key areas, we help you transform complex inventory issues into strategic, manageable actions that reduce costs and improve overall performance with Smart IP&O. […]
  • 7 Key Demand Planning Trends Shaping the Future7 Key Demand Planning Trends Shaping the Future
    Demand planning goes beyond simply forecasting product needs; it's about ensuring your business meets customer demands with precision, efficiency, and cost-effectiveness. Latest demand planning technology addresses key challenges like forecast accuracy, inventory management, and market responsiveness. In this blog, we will introduce critical demand planning trends, including data-driven insights, probabilistic forecasting, consensus planning, predictive analytics, scenario modeling, real-time visibility, and multilevel forecasting. These trends will help you stay ahead of the curve, optimize your supply chain, reduce costs, and enhance customer satisfaction, positioning your business for long-term success. […]

    Inventory Optimization for Manufacturers, Distributors, and MRO

    • Managing Spare Parts Inventory: Best PracticesManaging Spare Parts Inventory: Best Practices
      In this blog, we’ll explore several effective strategies for managing spare parts inventory, emphasizing the importance of optimizing stock levels, maintaining service levels, and using smart tools to aid in decision-making. Managing spare parts inventory is a critical component for businesses that depend on equipment uptime and service reliability. Unlike regular inventory items, spare parts often have unpredictable demand patterns, making them more challenging to manage effectively. An efficient spare parts inventory management system helps prevent stockouts that can lead to operational downtime and costly delays while also avoiding overstocking that unnecessarily ties up capital and increases holding costs. […]
    • Innovating the OEM Aftermarket with AI-Driven Inventory Optimization XLInnovating the OEM Aftermarket with AI-Driven Inventory Optimization
      The aftermarket sector provides OEMs with a decisive advantage by offering a steady revenue stream and fostering customer loyalty through the reliable and timely delivery of service parts. However, managing inventory and forecasting demand in the aftermarket is fraught with challenges, including unpredictable demand patterns, vast product ranges, and the necessity for quick turnarounds. Traditional methods often fall short due to the complexity and variability of demand in the aftermarket. The latest technologies can analyze large datasets to predict future demand more accurately and optimize inventory levels, leading to better service and lower costs. […]
    • Future-Proofing Utilities. Advanced Analytics for Supply Chain OptimizationFuture-Proofing Utilities: Advanced Analytics for Supply Chain Optimization
      Utilities in the electrical, natural gas, urban water, and telecommunications fields are all asset-intensive and reliant on physical infrastructure that must be properly maintained, updated, and upgraded over time. Maximizing asset uptime and the reliability of physical infrastructure demands effective inventory management, spare parts forecasting, and supplier management. A utility that executes these processes effectively will outperform its peers, provide better returns for its investors and higher service levels for its customers, while reducing its environmental impact. […]
    • Centering Act Spare Parts Timing Pricing and ReliabilityCentering Act: Spare Parts Timing, Pricing, and Reliability
      In this article, we'll walk you through the process of crafting a spare parts inventory plan that prioritizes availability metrics such as service levels and fill rates while ensuring cost efficiency. We'll focus on an approach to inventory planning called Service Level-Driven Inventory Optimization. Next, we'll discuss how to determine what parts you should include in your inventory and those that might not be necessary. Lastly, we'll explore ways to enhance your service-level-driven inventory plan consistently. […]

      Cloud computing companies with unique server and hardware parts, e-commerce, online retailers, home and office supply companies, onsite furniture, power utilities, intensive assets maintenance or warehousing for water supply companies have increased their activity during the pandemic. Garages selling car parts and truck parts, pharmaceuticals, healthcare or medical supply manufacturers and safety product suppliers are dealing with increasing demand. Delivery service companies, cleaning services, liquor stores and canned or jarred goods warehouses, home improvement stores, gardening suppliers, yard care companies, hardware, kitchen and baking supplies stores, home furniture suppliers with high demand are facing stockouts, long lead times, inventory shortage costs, higher operating costs and ordering costs.

      Managing the Inventory of Promoted Items

      The Smart Forecaster

       Pursuing best practices in demand planning,

      forecasting and inventory optimization

      In a previous post, I discussed one of the thornier problems demand planners sometimes face: working with product demand data characterized by what statisticians call skewness — a situation that can necessitate costly inventory investments. This sort of problematic data is found in several different scenarios. In at least one, the combination of intermittent demand and very effective sales promotions, the problem lends itself to an effective solution.

      Reviewing terms, recall that “service level” is the probability of not stocking out while waiting for a replenishment order to arrive, while “fill rate” is the percentage of demand that is satisfied immediately from stock. In my previous post, “The Scourge of Skewness”, I pointed out that a certain type of demand distribution, having a “long right tail”, will lead to fill rates that can be much lower than service levels. I also pointed out that sometimes the only way to improve the fill rate is to increase the target service level to an unusually high level, which can be expensive.

      In this post, I’ll look at solving the problem in one special case: skewness resulting from effective sales promotions mixed with “intermittent demand”. Intermittent demand has a large proportion of zero values, with nonzero values mixed in at random. Successful sales promotions, obviously positive, have a downside: they can confuse the “demand signal” with spikes in your demand history, and can undermine forecasts and bias safety stock calculations. When intermittent demand and effective sales promotions are the source of your data’s skewness, methods exist to work around the problem to achieve both higher fill rates and more accurate demand forecasts.

      How Promotions Increase Skewness

      Successful promotions abruptly increase item demand. This creates anomalies, or “outliers”, which contribute to forming a skewed distribution. Knowing when promotions occurred in the past, we can adjust an item’s record of past demand. We produce an alternate demand history as if there had been no promotions, by replacing the outliers with values more representative of the “natural” level of demand. These adjustments reduce demand skewness. Reduced skewness can lead to significant reductions in both expected forecasts and safety stocks, which add together to form reorder points.

      Successful promotions are likely to be repeated. When that happens, the promotion effects can be added in to demand forecasts to increase their accuracy. The effect of future promotions on inventory management will be to increase the risk of stockouts, so a sensible response is to work at the operational level to build up temporary supply, in a quantity keyed to the estimated impact of prior promotions on the effected items.


      Using Event Modeling to Improve Demand Forecasting

      It’s possible to model the impact of like events, and apply this to planned events in the future. Doing so can improve your forecast in two big ways: by projecting the demand jolt you expect from a planned event; and rationalizing the spikes in the past that were caused by events, making your baseline activity more visible and more accurately forecastable. We do a lot of this in SmartForecasts, so allow me to use our experience there to show you what I mean.

      Event Modeling entails the following steps:
      • Automatically estimating the impact of previous promotions (which is a useful result in itself).
      • Adjusting historical demand to statistically remove the effect of promotions.
      • Creating promotion-free forecasts.
      • Revising the forecasts for any future time periods in which promotions are planned.

      We call this this type of analysis “Promo forecasting”. We use the word “promotions” to describe what you do yourself to improve your results. We use “events” to describe what the world does to you, usually to your detriment; examples include strikes, power outages, warehouse fires and other unlucky happenings.

      To understand how Event Modeling can help you cope with skewness when doing demand forecasting for high-volume items, consider Figures 1-3.

      Figure 1 shows that this item’s demand pattern is clearly seasonal, and the forecast is both seasonal and “tight”, meaning that the forecast uncertainty interval (“margin of error”, shown in cyan lines) is very narrow.

      Figure 2 shows an alternative history in which a promotion in June 2014 reversed the usual seasonal low associated with June sales. This demand pattern was forecasted using the Automatic forecasting tournament in SmartForecasts, as in Figure 1. This time, the promotion scrambled the seasonal pattern enough to create an inappropriate non-seasonal forecast, and one that has a much larger margin of error.

      Finally, Figure 3 shows how Promo forecasting handles the same promoted scenario, retaining a seasonal forecast and building into the forecast an estimate of the effect of a planned repeat promotion in 2015.

      The Case of Intermittent Demand

      In Figure 1, the item was a high-volume finished good and the task was demand forecasting. Promo modeling is also useful when dealing with the task of setting safety stocks and reorder points for items with intermittent demand, whether the items are finished goods, components or spare parts. Intermittent demand very often has a skewed distribution that makes it difficult to achieve high item availability with a small investment in inventory.

      Figure 4 illustrates the problem that a successful promotion can accidentally create for inventory management. If such a spike arises from the natural, un-promoted demand, then the only way to maintain high fill rates is to provide safety stocks large enough to cope with these random surges. In this case, the big spike in demand of 500 units in February 2013 was the result of a one-time promotion.

      Taking Account of Promotions to Improve Inventory Management

      Unwittingly treating the spike in the example above as part of the natural demand variability results in a poor fill rate. To achieve a target service level of, say, 95% with a lead time of one month would require a reorder point of 38 units, computed as the sum of an expected forecast over the one month replenishment lead time of 21 units supplemented by a safety stock of 17 units. This investment would result in a disappointing fill rate of only 36%.

      However, recognizing that the spike is a one-time promotion and replacing the 500 units with 0 obviously would make a big difference. The reorder point would drop from 38 units to 31 (the sum of an expected demand of 7 units and a safety stock of 24 units) and the fill rate would increase to 94%.

      Of course, it is not ok to just throw out inconvenient demand spikes whenever they make life uncomfortable; there has to be a valid “business story” behind the adjustment of historical demand. If the spike is the result of a data processing error, then by all means, fix it. If the spike coincides with a promotion, then replacing the spike with, say, the median demand (often zero, as in this example) will result in a much more sustainable inventory investment that still meets aggressive performance targets. Future promotions of the same type on the same item will require some extra effort to prepare for the temporary surge in demand, but the recommended reorder point will be correct in the long run.

      Thomas Willemain, PhD, co-founded Smart Software and currently serves as Senior Vice President for Research. Dr. Willemain also serves as Professor Emeritus of Industrial and Systems Engineering at Rensselear Polytechnic Institute and as a member of the research staff at the Center for Computing Sciences, Institute for Defense Analyses.

      Leave a Comment

      Related Posts

      Thoughts on Spare Parts Planning for Public Transit

      Thoughts on Spare Parts Planning for Public Transit

      The Covid19 pandemic has placed unusual stress on public transit agencies. This stress forces agencies to look again at their processes and equipment. This blog focuses on bus systems and their practices for spare parts planning and management. However, there are lessons here for other types of public transit, including rail and light rail

      A Primer on Probabilistic Forecasting

      A Primer on Probabilistic Forecasting

      If you keep up with the news about supply chain analytics, you are more frequently encountering the phrase “probabilistic forecasting.” Probabilistic forecasts have the ability to simulate future values that aren’t anchored to the past. If this phrase is puzzling, read on.

      Goldilocks Inventory Levels

      Goldilocks Inventory Levels

      You may remember the story of Goldilocks from your long-ago youth. Sometimes the porridge was too hot, sometimes it was too cold, but just once it was just right. Now that we are adults, we can translate that fairy tale into a professional principle for inventory planning: There can be too little or too much inventory, and there is some Goldilocks level that is “just right.” This blog is about finding that sweet spot.

      Recent Posts

      • Managing Spare Parts Inventory: Best PracticesManaging Spare Parts Inventory: Best Practices
        In this blog, we’ll explore several effective strategies for managing spare parts inventory, emphasizing the importance of optimizing stock levels, maintaining service levels, and using smart tools to aid in decision-making. Managing spare parts inventory is a critical component for businesses that depend on equipment uptime and service reliability. Unlike regular inventory items, spare parts often have unpredictable demand patterns, making them more challenging to manage effectively. An efficient spare parts inventory management system helps prevent stockouts that can lead to operational downtime and costly delays while also avoiding overstocking that unnecessarily ties up capital and increases holding costs. […]
      • 5 Ways to Improve Supply Chain Decision Speed5 Ways to Improve Supply Chain Decision Speed
        The promise of a digital supply chain has transformed how businesses operate. At its core, it can make rapid, data-driven decisions while ensuring quality and efficiency throughout operations. However, it's not just about having access to more data. Organizations need the right tools and platforms to turn that data into actionable insights. This is where decision-making becomes critical, especially in a landscape where new digital supply chain solutions and AI-driven platforms can support you in streamlining many processes within the decision matrix. […]
      • Two employees checking inventory in temporary storage in a distribution warehouse.12 Causes of Overstocking and Practical Solutions
        Managing inventory effectively is critical for maintaining a healthy balance sheet and ensuring that resources are optimally allocated. Here is an in-depth exploration of the main causes of overstocking, their implications, and possible solutions. […]
      • FAQ Mastering Smart IP&O for Better Inventory ManagementFAQ: Mastering Smart IP&O for Better Inventory Management.
        Effective supply chain and inventory management are essential for achieving operational efficiency and customer satisfaction. This blog provides clear and concise answers to some basic and other common questions from our Smart IP&O customers, offering practical insights to overcome typical challenges and enhance your inventory management practices. Focusing on these key areas, we help you transform complex inventory issues into strategic, manageable actions that reduce costs and improve overall performance with Smart IP&O. […]
      • 7 Key Demand Planning Trends Shaping the Future7 Key Demand Planning Trends Shaping the Future
        Demand planning goes beyond simply forecasting product needs; it's about ensuring your business meets customer demands with precision, efficiency, and cost-effectiveness. Latest demand planning technology addresses key challenges like forecast accuracy, inventory management, and market responsiveness. In this blog, we will introduce critical demand planning trends, including data-driven insights, probabilistic forecasting, consensus planning, predictive analytics, scenario modeling, real-time visibility, and multilevel forecasting. These trends will help you stay ahead of the curve, optimize your supply chain, reduce costs, and enhance customer satisfaction, positioning your business for long-term success. […]

        Inventory Optimization for Manufacturers, Distributors, and MRO

        • Managing Spare Parts Inventory: Best PracticesManaging Spare Parts Inventory: Best Practices
          In this blog, we’ll explore several effective strategies for managing spare parts inventory, emphasizing the importance of optimizing stock levels, maintaining service levels, and using smart tools to aid in decision-making. Managing spare parts inventory is a critical component for businesses that depend on equipment uptime and service reliability. Unlike regular inventory items, spare parts often have unpredictable demand patterns, making them more challenging to manage effectively. An efficient spare parts inventory management system helps prevent stockouts that can lead to operational downtime and costly delays while also avoiding overstocking that unnecessarily ties up capital and increases holding costs. […]
        • Innovating the OEM Aftermarket with AI-Driven Inventory Optimization XLInnovating the OEM Aftermarket with AI-Driven Inventory Optimization
          The aftermarket sector provides OEMs with a decisive advantage by offering a steady revenue stream and fostering customer loyalty through the reliable and timely delivery of service parts. However, managing inventory and forecasting demand in the aftermarket is fraught with challenges, including unpredictable demand patterns, vast product ranges, and the necessity for quick turnarounds. Traditional methods often fall short due to the complexity and variability of demand in the aftermarket. The latest technologies can analyze large datasets to predict future demand more accurately and optimize inventory levels, leading to better service and lower costs. […]
        • Future-Proofing Utilities. Advanced Analytics for Supply Chain OptimizationFuture-Proofing Utilities: Advanced Analytics for Supply Chain Optimization
          Utilities in the electrical, natural gas, urban water, and telecommunications fields are all asset-intensive and reliant on physical infrastructure that must be properly maintained, updated, and upgraded over time. Maximizing asset uptime and the reliability of physical infrastructure demands effective inventory management, spare parts forecasting, and supplier management. A utility that executes these processes effectively will outperform its peers, provide better returns for its investors and higher service levels for its customers, while reducing its environmental impact. […]
        • Centering Act Spare Parts Timing Pricing and ReliabilityCentering Act: Spare Parts Timing, Pricing, and Reliability
          In this article, we'll walk you through the process of crafting a spare parts inventory plan that prioritizes availability metrics such as service levels and fill rates while ensuring cost efficiency. We'll focus on an approach to inventory planning called Service Level-Driven Inventory Optimization. Next, we'll discuss how to determine what parts you should include in your inventory and those that might not be necessary. Lastly, we'll explore ways to enhance your service-level-driven inventory plan consistently. […]