
There’s a stale old joke: “There are two types of people – those who believe there are two types of people, and those who don’t.” We can modify that joke: “There are two types of people – those who know there are three types of supply chain analytics, and those who haven’t yet read this blog.”
The three types of supply chain analytics are “descriptive”, “predictive”, and “prescriptive.” Each plays a different role in helping you manage your inventory. Modern supply chain software lets you exploit all three.
Descriptive Analytics
Descriptive Analytics are the stuff of dashboards. They tell you “what’s happenin’ now.” Included in this category are such summary numbers as dollars currently invested in inventory, current customer service level and fill rate, and average supplier lead times. These statistics are useful for keeping track of your operations, especially when you track changes in them from month to month. You will rely on them every day. They require accurate corporate databases, processed statistically.
Predictive Analytics
Predictive Analytics most commonly manifest as forecasts of demand, often broken down by product and location and sometimes also by customer. These statistics provide early warning so you can gear up production, staffing and raw material procurement to satisfy demand. They also provide predictions of the effect of changes in operating policies, e.g., what happens if we increase our order quantity for Product X from 20 to 25 units? You might rely on Predictive Analytics periodically, perhaps weekly or monthly, when you look up from what’s happening now to see what will happen next. Predictive Analytics uses Descriptive Analytics as a foundation but adds more capability. Predictive Analytics for demand forecasting requires advanced statistical processing to detect and estimate such features of product demand as trend, seasonality and regime change. Predictive Analytics for inventory management uses forecasts of demand as inputs into models of the operation of inventory policies, which in turn provide estimates of key performance metrics such as service levels, fill rates, and operating costs.
Prescriptive Analytics
Prescriptive Analytics are not about what is happening now, or what will happen next, but about what you should do next, i.e., they recommend decisions aimed at maximizing inventory system performance. You might rely on Prescriptive Analytics to best posture your entire inventory policy. Prescriptive Analytics uses Predictive Analytics as a foundation then adds optimization capability. For instance, Prescriptive Analytics software can automatically work out the best choices for future values of Min’s and Max’s for thousands of inventory items. Here, “best” might mean the values of Min and Max for each item that minimize operating cost (the sum of holding, ordering, and shortage costs) while maintaining a 90% floor on item fill rate.
Example
The figure below shows how supply chain analytics can help the inventory manager. The columns show three predicted Key Performance Indicators (KPI’s): service level, inventory investment, and operating costs (holding costs + ordering costs + shortage costs).
Figure 1: The three types of analytics used to evaluate planning scenarios
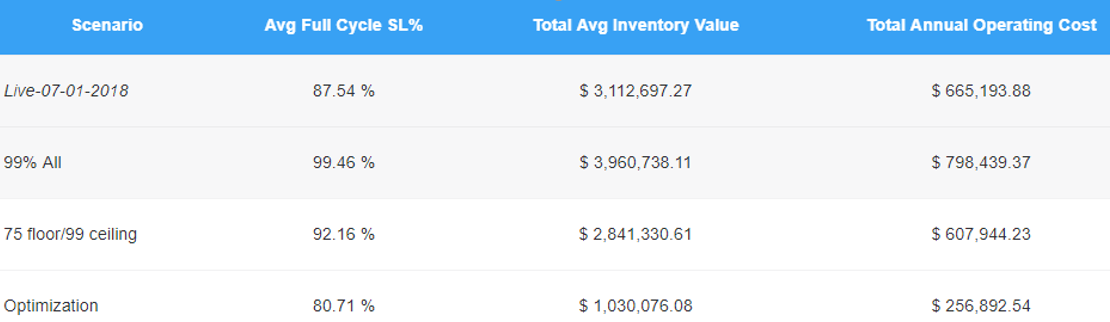
The rows show four alternative inventory policies, expressed as scenarios. The “Live” scenario reports on the values of the KPI’s on July 1, 2018. The “99% All” scenario changes the current policy by raising the service level of all items to 99%. The “75 floor/99 ceiling” scenario raises service levels that are too low up to 75% and lowers very high (i.e., expensive) service levels down to 95%. The “Optimization” scenario prescribes item specific service levels that minimizes total operating costs.
The “Live 07-01-2018” scenario is an example of Descriptive Analytics. It shows the current baseline performance. The software then allows the user to try out changes in inventory policy by creating new “What If” scenarios that might then be converted to named scenarios for further consideration. The next two scenarios are examples of Predictive Analytics. They both assess the consequences of their recommended inventory control policies, i.e., recommended values of Min and Max for all items. The “Optimization” scenario is an example of Prescriptive Analytics because it recommends a best compromise policy.
Consider how the three alternative scenarios compare to the baseline “Live” scenario. The “99% All” scenario raises the item availability metrics, increasing service level from 88% to 99%. However, doing so increases the total inventory investment from $3 million to about $4 million. In contrast, the “75 floor/99 ceiling” scenario increases both service level and reduces the cash tied up in inventory by about $300,000. Finally, the “Optimization” scenario achieves an 80% service level, a reduction from the current 88%, but it cuts more than $2 million from the inventory value and reduces operating costs by more than $400,000 annually. From here, managers could try further options, such as giving back some of the $2 million savings to achieve a higher average service level.
Summary
Modern software packages for inventory planning and inventory optimization should offer three kinds of supply chain analytics: Descriptive, Predictive, and Prescriptive. Their combination lets inventory managers track their operations (Descriptive), forecast where their operations will be in the future (Predictive), and optimize their inventory policies in response in anticipation of future conditions (Prescriptive).

Related Posts

Forecast-Based Inventory Management for Better Planning
Forecast-based inventory management, or MRP (Material Requirements Planning) logic, is a forward-planning method that helps businesses meet demand without overstocking or understocking. By anticipating demand and adjusting inventory levels, it maintains a balance between meeting customer needs and minimizing excess inventory costs. This approach optimizes operations, reduces waste, and enhances customer satisfaction.

Make AI-Driven Inventory Optimization an Ally for Your Organization
In this blog, we will explore how organizations can achieve exceptional efficiency and accuracy with AI-driven inventory optimization. Traditional inventory management methods often fall short due to their reactive nature and reliance on manual processes. Maintaining optimal inventory levels is fundamental for meeting customer demand while minimizing costs. The introduction of AI-driven inventory optimization can significantly reduce the burden of manual processes, providing relief to supply chain managers from tedious tasks.

The Importance of Clear Service Level Definitions in Inventory Management
Inventory optimization software that supports what-if analysis will expose the tradeoff of stockouts vs. excess costs of varying service level targets. But first it is important to identify how “service levels” is interpreted, measured, and reported. This will avoid miscommunication and the false sense of security that can develop when less stringent definitions are used. Clearly defining how service level is calculated puts all stakeholders on the same page. This facilitates better decision-making.
Recent Posts
 Forecast-Based Inventory Management for Better PlanningForecast-based inventory management, or MRP (Material Requirements Planning) logic, is a forward-planning method that helps businesses meet demand without overstocking or understocking. By anticipating demand and adjusting inventory levels, it maintains a balance between meeting customer needs and minimizing excess inventory costs. This approach optimizes operations, reduces waste, and enhances customer satisfaction. […]
 Make AI-Driven Inventory Optimization an Ally for Your OrganizationIn this blog, we will explore how organizations can achieve exceptional efficiency and accuracy with AI-driven inventory optimization. Traditional inventory management methods often fall short due to their reactive nature and reliance on manual processes. Maintaining optimal inventory levels is fundamental for meeting customer demand while minimizing costs. The introduction of AI-driven inventory optimization can significantly reduce the burden of manual processes, providing relief to supply chain managers from tedious tasks. […]
 The Importance of Clear Service Level Definitions in Inventory ManagementInventory optimization software that supports what-if analysis will expose the tradeoff of stockouts vs. excess costs of varying service level targets. But first it is important to identify how “service levels” is interpreted, measured, and reported. This will avoid miscommunication and the false sense of security that can develop when less stringent definitions are used. Clearly defining how service level is calculated puts all stakeholders on the same page. This facilitates better decision-making. […]
 Future-Proofing Utilities: Advanced Analytics for Supply Chain OptimizationUtilities in the electrical, natural gas, urban water, and telecommunications fields are all asset-intensive and reliant on physical infrastructure that must be properly maintained, updated, and upgraded over time. Maximizing asset uptime and the reliability of physical infrastructure demands effective inventory management, spare parts forecasting, and supplier management. A utility that executes these processes effectively will outperform its peers, provide better returns for its investors and higher service levels for its customers, while reducing its environmental impact. […]
 The Cost of Spreadsheet PlanningCompanies that depend on spreadsheets for demand planning, forecasting, and inventory management are often constrained by the spreadsheet’s inherent limitations. This post examines the drawbacks of traditional inventory management approaches caused by spreadsheets and their associated costs, contrasting these with the significant benefits gained from embracing state-of-the-art planning technologies. […]

Inventory Optimization for Manufacturers, Distributors, and MRO
- Future-Proofing Utilities: Advanced Analytics for Supply Chain OptimizationUtilities in the electrical, natural gas, urban water, and telecommunications fields are all asset-intensive and reliant on physical infrastructure that must be properly maintained, updated, and upgraded over time. Maximizing asset uptime and the reliability of physical infrastructure demands effective inventory management, spare parts forecasting, and supplier management. A utility that executes these processes effectively will outperform its peers, provide better returns for its investors and higher service levels for its customers, while reducing its environmental impact. […]
 Centering Act: Spare Parts Timing, Pricing, and ReliabilityIn this article, we'll walk you through the process of crafting a spare parts inventory plan that prioritizes availability metrics such as service levels and fill rates while ensuring cost efficiency. We'll focus on an approach to inventory planning called Service Level-Driven Inventory Optimization. Next, we'll discuss how to determine what parts you should include in your inventory and those that might not be necessary. Lastly, we'll explore ways to enhance your service-level-driven inventory plan consistently. […]
 Why MRO Businesses Need Add-on Service Parts Planning & Inventory SoftwareMRO organizations exist in a wide range of industries, including public transit, electrical utilities, wastewater, hydro power, aviation, and mining. To get their work done, MRO professionals use Enterprise Asset Management (EAM) and Enterprise Resource Planning (ERP) systems. These systems are designed to do a lot of jobs. Given their features, cost, and extensive implementation requirements, there is an assumption that EAM and ERP systems can do it all. In this post, we summarize the need for add-on software that addresses specialized analytics for inventory optimization, forecasting, and service parts planning. […]
 5 Steps to Improve the Financial Impact of Spare Parts PlanningIn today’s competitive business landscape, companies are constantly seeking ways to improve their operational efficiency and drive increased revenue. Optimizing service parts management is an often-overlooked aspect that can have a significant financial impact. Companies can improve overall efficiency and generate significant financial returns by effectively managing spare parts inventory. This article will explore the economic implications of optimized service parts management and how investing in Inventory Optimization and Demand Planning Software can provide a competitive advantage. […]