Utilities have unique supply chain optimization requirements, primarily ensuring high uptime by keeping all critical machines running continuously. Achieving this involves maintaining a high availability of spare parts to guarantee a consistent, reliable, and safe supply. Additionally, as regulated entities, utilities must also carefully manage and control costs.
Managing supply chains efficiently
To maintain a reliable electricity supply at 99.99%+ service levels, for example, utilities must be able to respond quickly to changes in demand in the near term and accurately anticipate future demand. To do so, they must have a well-organized supply chain that allows them to purchase the necessary equipment, materials, and services from the right suppliers at the right time, in the right quantities, and at the right price.
Doing so has become increasingly more challenging in the last 3 years.
- Requirements for safety, reliability, and service delivery are more stringent.
- Supply chain disruptions, unpredictable supplier lead times, intermittent spikes in parts usage have always been problematic, but now they are more the rule than the exception.
- Deregulation in the early 2000’s removed spare parts from the list of directly reimbursed items, forcing utilities to pay for spares directly from revenues[1]
- The constant need for capital combined with aggressively climbing interest rates mean costs are scrutinized more than ever.
As a result, Supply Chain Optimization (SCO) has become an increasingly mission-critical business practice for utilities. To contend with these challenges, utilities can no longer simply manage their supply chain — they must optimize it. And to do that, investments in new processes and systems will be required.
[1] Scala et al. “Risk and Spare Parts Inventory in Electric Utilities”. Proceedings of the Industrial Engineering Research Conference.

Inventory Planning and Optimization
Targeted investments in inventory optimization technology offer a path forward for every utility. Inventory Optimization solutions should be prioritized because they:
- Can be implemented in a fraction of the time required for initiatives in other areas, such as warehouse management, supply chain design, and procurement consolidations. It is not uncommon to start generating benefit after 90 days and to have a full software deployment in less than 180 days.
- Can generate massive ROI, yielding 20x returns and seven figure financial benefits annually. By better forecasting parts usage, utilities will reduce costs by purchasing only the necessary inventory while controlling the risk of stockouts that lead to downtime and poor service levels.
- Provide foundational support for other initiatives. A strong supply chain rests on the foundation of solid usage forecasts and inventory purchasing plans.
Using predictive analytics and advanced algorithms, inventory optimization helps utilities maximize service levels and reduce operational costs by optimizing inventory levels for spare parts. For example, an electric utility might use statistical forecasting to predict future parts usage, conduct inventory audits to identify excess inventory, and leverage analytical results to identify where inventory optimization efforts should focus first. By doing this, the utility can ensure that machines are running at optimal levels and reduce the risk of costly delays due to a lack of spares.
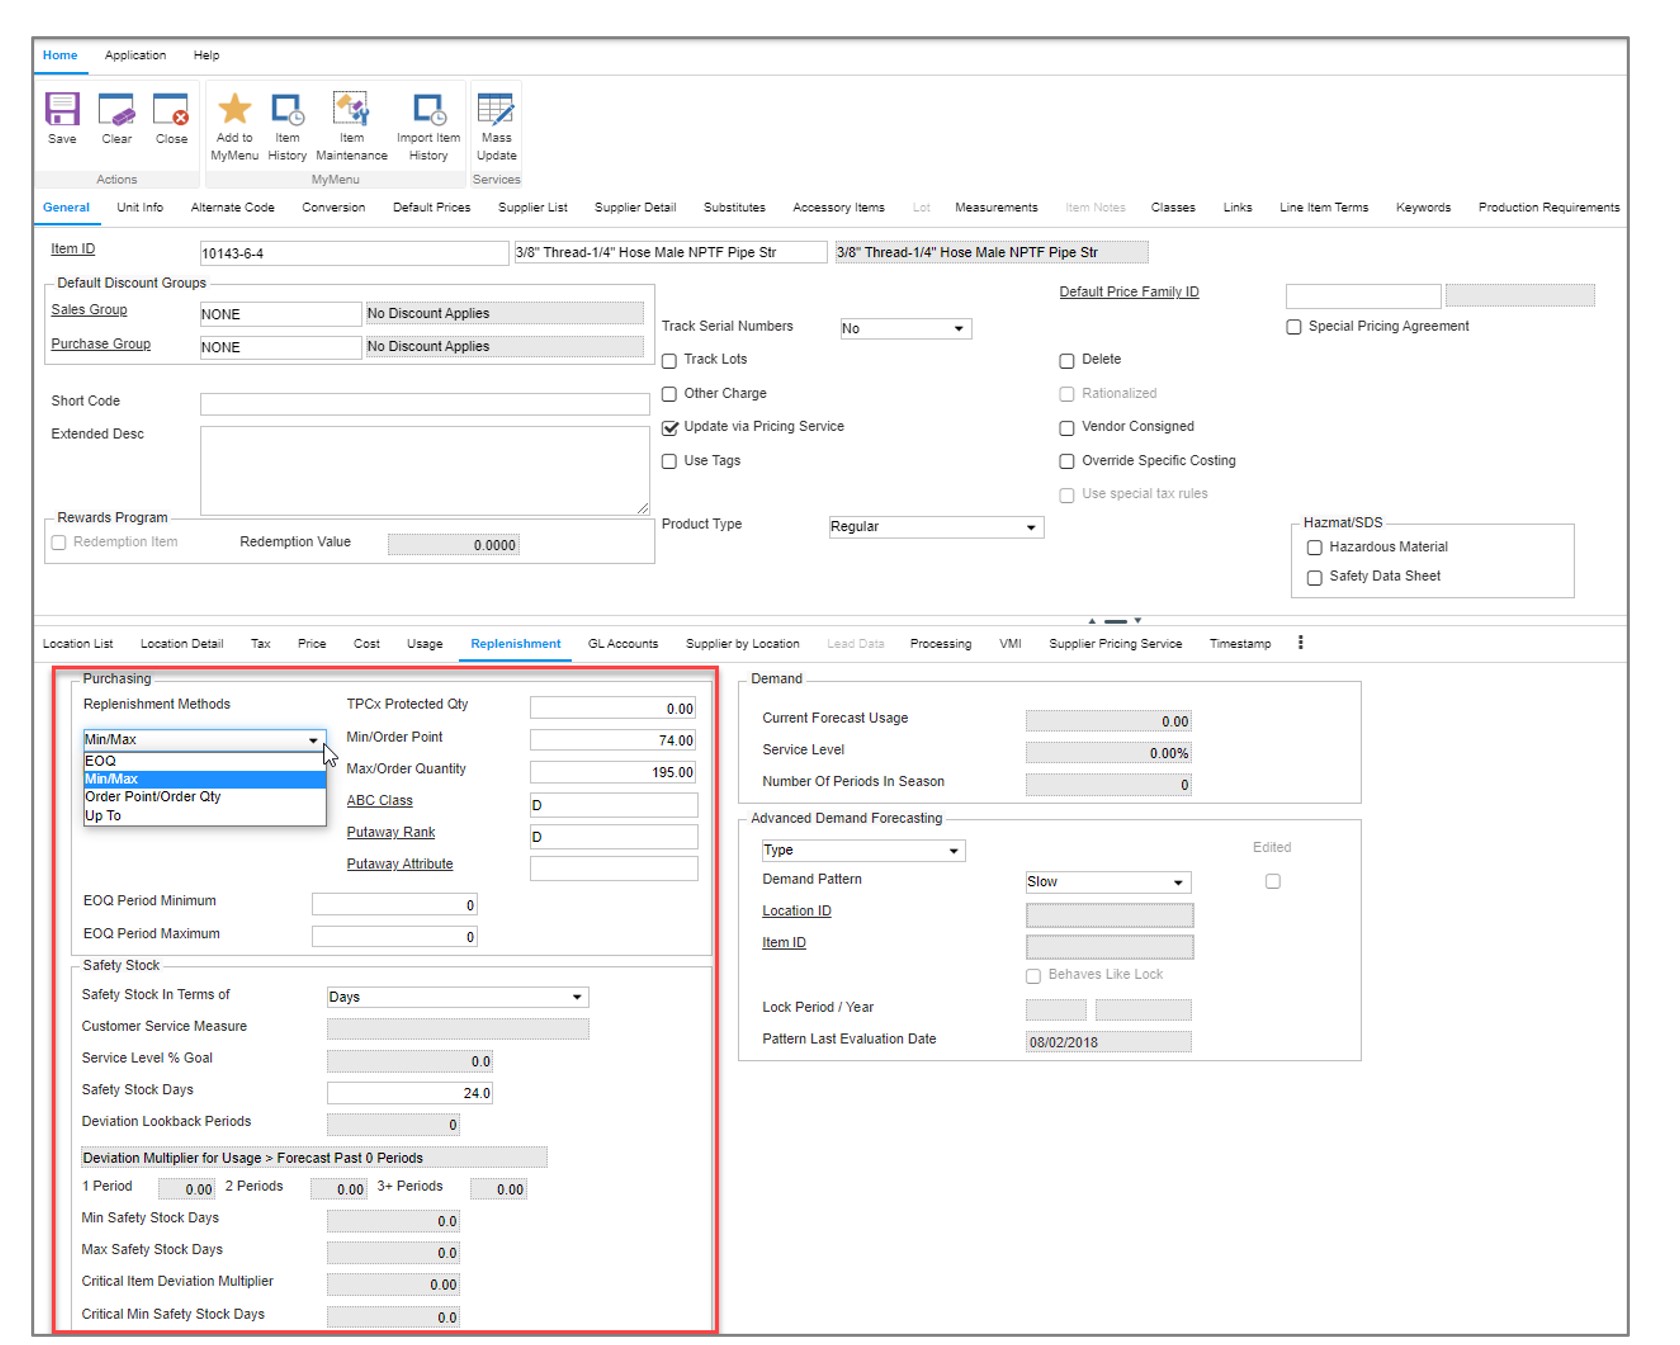
By using analytics and data, you can identify which spare parts and equipment are most likely to be needed and order only the necessary items. This helps to ensure that equipment has high up-time. It rewards regular monitoring and adjusting of inventory levels so that when operating conditions change, you can detect the change and adjust accordingly. This implies that planning cycles must operate at a tempo high enough to keep up with changing conditions. Leveraging probabilistic forecasting to recalibrate spares stocking policies for each planning cycle ensures that stocking policies (such as min/max levels) are always up-to-date and reflect the latest parts usage and supplier lead times.
Service Levels and the Tradeoff Curve
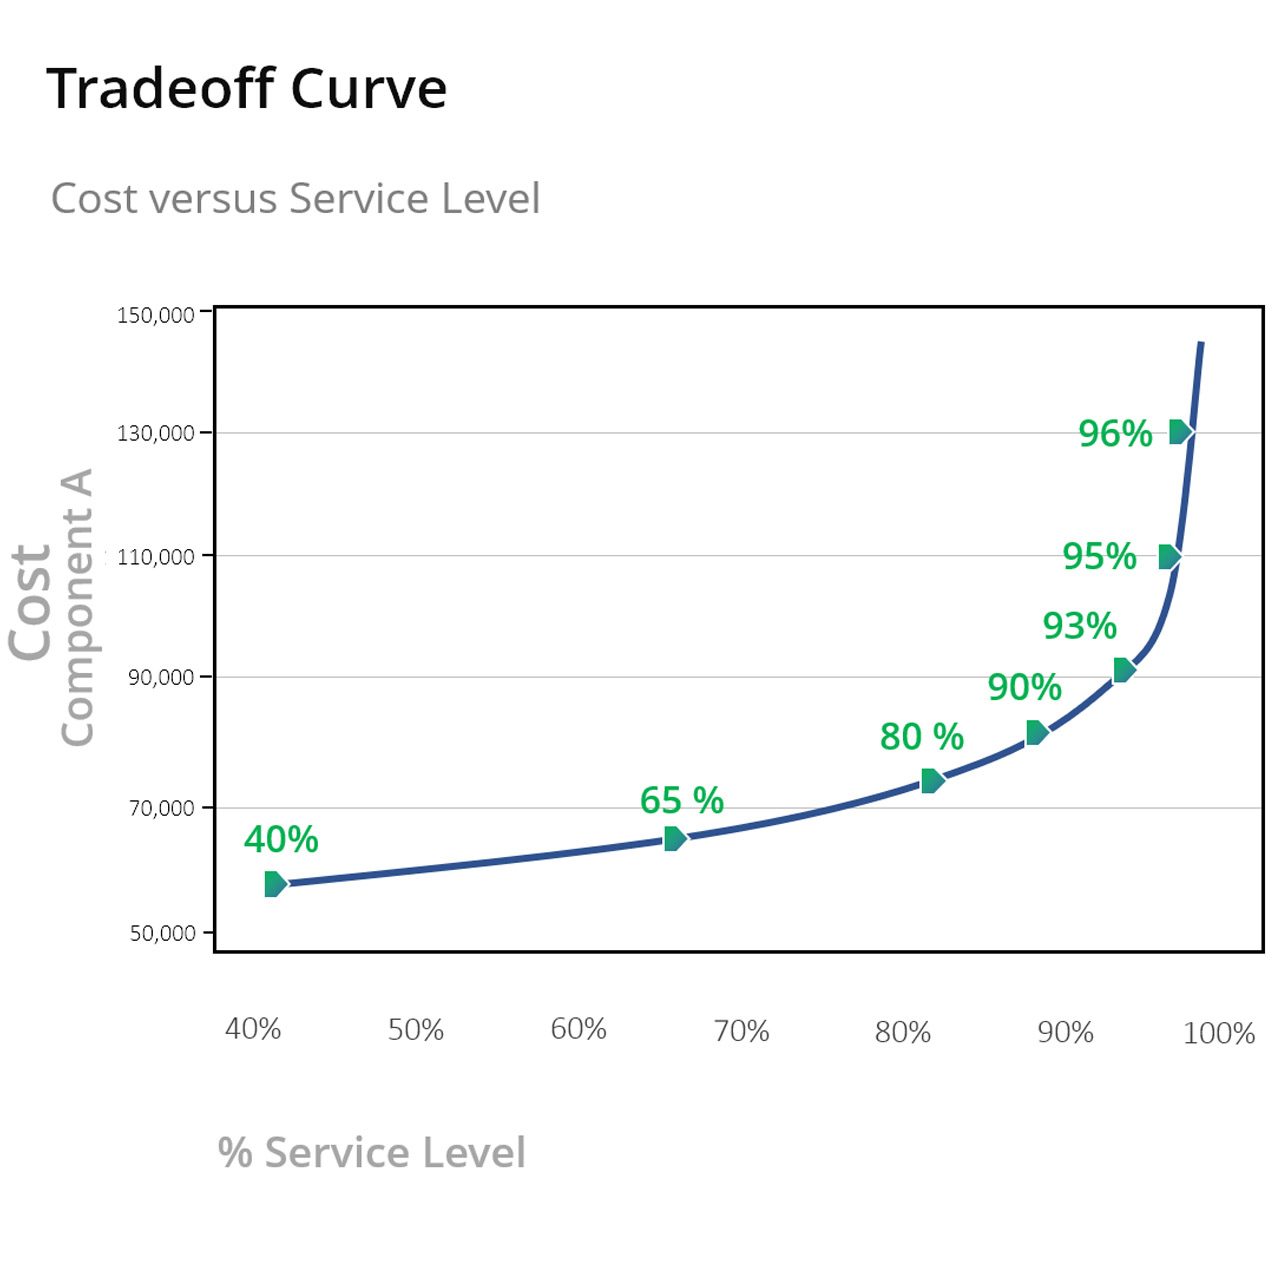
The Service Level Tradeoff Curve relates inventory investment to item availability as measured by service level. Service level is the probability that no shortages occur between when you order more stock and when it arrives on the shelf. Surprisingly few companies have data on this important metric across their whole fleet of spare parts.
The Service Level Tradeoff Curve exposes the link between the costs associated with different levels of service and the inventory requirements needed to achieve them. Knowing which components are important to maintaining high service levels is key to the optimization process and is determined by several factors, including inventory item standardization, criticality, historical usage, and known future repair orders. By understanding this relationship, utilities can better allocate resources, as when using the curves to identify areas where costs can be reduced without hurting system reliability.
With inventory optimization software, setting stocking policies is pure guesswork: It is possible to know how any given increase or decrease will impact service levels other than rough cut estimates. How the changes will play out in terms of inventory investment, operating costs, and shortage costs, is something no one really knows. Most utilities rely on rule of thumb methods and arbitrarily adjust stocking policies in a reactive manner after something has gone wrong such as a large stockout or inventory write off. When adjustments are made this way, there is no fact-based analysis detailing how this change is expected to impact the metrics that matter: service levels and inventory values.
Inventory Optimization software can compute the detailed, quantitative tradeoff curves required to make informed inventory policy choices or even recommend the target service level that results in the lowest overall operating cost (the sum of holding, ordering, and stock-out costs). Using this analysis, large increases in stock levels may be mathematically justified when the predicted reduction in shortage costs exceeds the increase in inventory investment and associated holding costs. By setting appropriate service levels and recalibrating policies across all active parts once every planning cycle (at least once monthly), utilities can minimize the risk of outages while controlling expenditures.
Perhaps the most critical aspects of the response to equipment breakdown are those relating to achieving a first-time fix as rapidly as possible. Having the proper spares available can be the difference between completing a single trip and increasing the mean time to repair, bearing the costs associated with several visits, and causing customer relationships to degrade.
Using modern software, you can benchmark past performance and leverage probabilistic forecasting methods to simulate future performance. By stress-testing your current inventory stocking policies against all plausible scenarios of future parts usage, you will know ahead of time how current and proposed stocking policies are likely to perform. Check out our blog post on how to measure the accuracy of your service level forecast to help you assess the accuracy of inventory recommendations that software providers will purport to provide benefit.

Leveraging Advanced Analytics and AI
When introducing automation, each utility company has its own goals to pursue, but you should begin with assessing present operations to identify areas that may be made more effective. Some companies may prioritize financial issues, but others may prioritize regulatory demands such as clean energy spending or industry-wide changes such as smart grids. Each company’s difficulties are unique, but modern software can point the way to a more effective inventory management system that minimizes excess inventory and places the correct components in the right places at the right times.
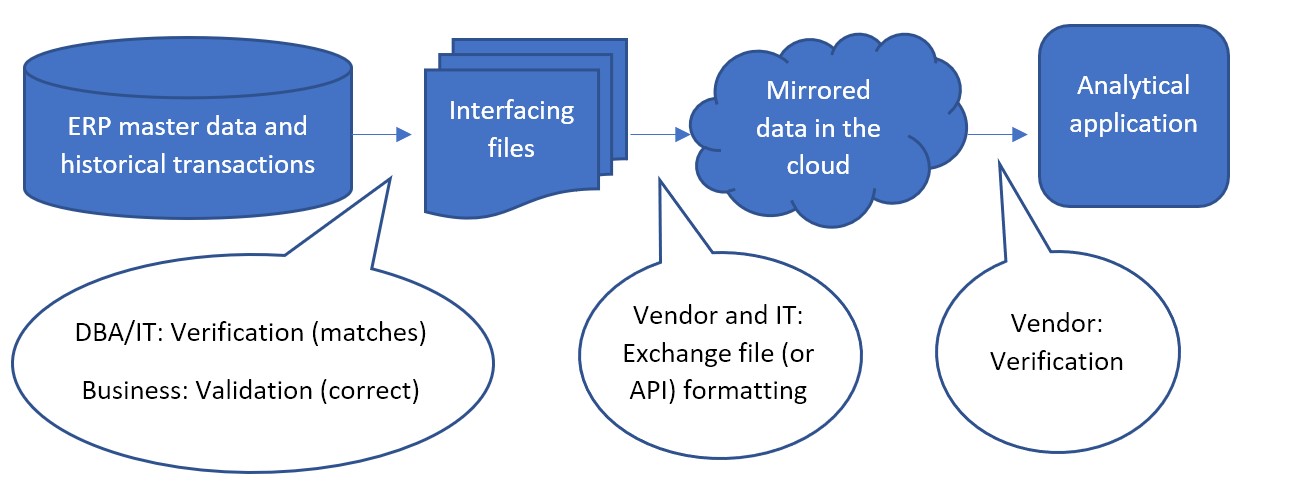
Overall, Supply Chain Optimization initiatives are essential for utilities looking to maximize their efficiency and reduce their costs. Technology allows us to make the integration process seamless, and you don’t need to replace your current ERP or EAM system by doing it. You just need to make better use of the data you already have.
For example, one large utility launched a strategic Supply Chain Optimization (SCO) initiative and added best-in-class capabilities through the selection and integration of commercial off-the-shelf applications. Chief among these was the Smart Inventory Planning and Optimization system (Smart IP&O), comprising Parts Forecasting / Demand Planning and Inventory Optimization functionality. Within just 90 days the software system was up and running, soon reducing inventory by $9,000,000 while maintaining spares availability at a high level. You can read the case study here Electric Utility Goes with Smart IP&O.
Utilities can ensure that they are able to manage their spare parts supplies in an efficient and cost-effective manner better preparing them for the future. Over time, this balance between supply and demand translates to a significant edge. Understanding the Service Level Tradeoff Curve helps to understand the costs associated with different levels of service and the inventory requirements needed to achieve them. This leads to reduced operational costs, optimized inventory, and assurance that you can meet your customers’ needs.
Spare Parts Planning Software solutions
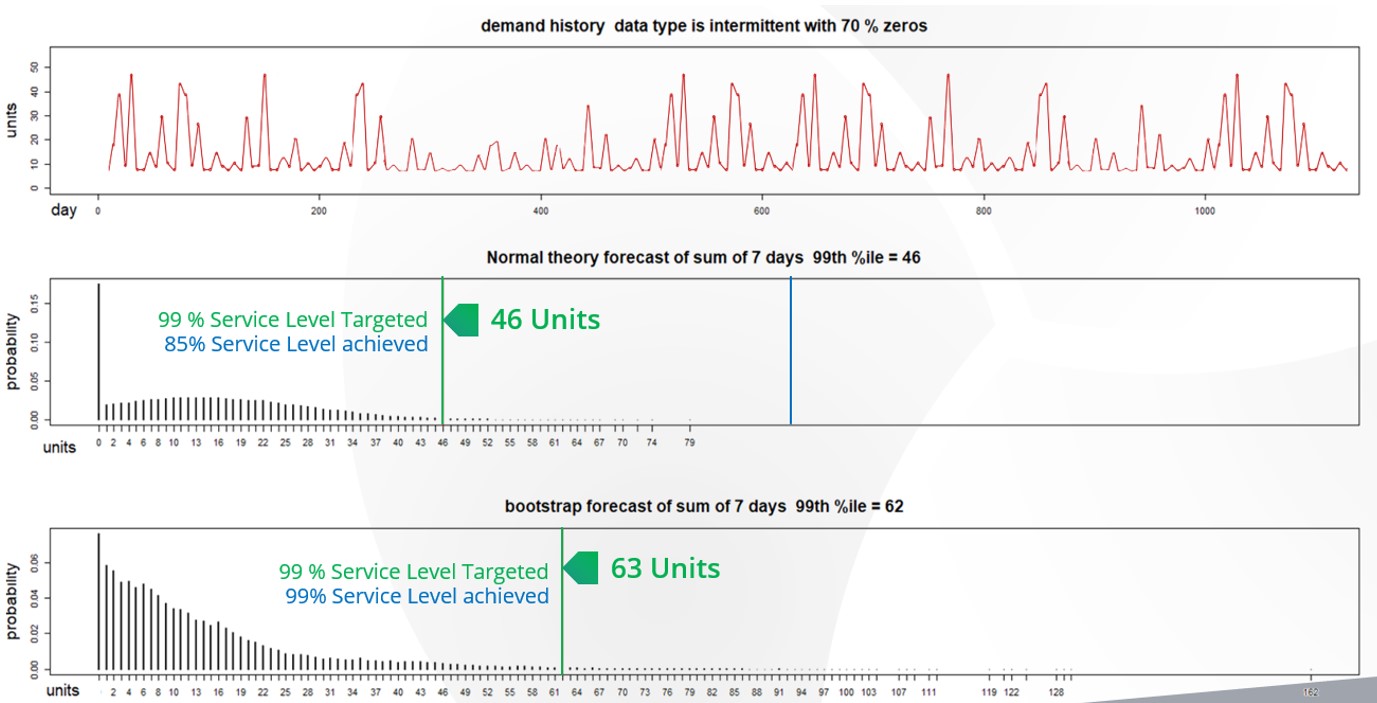
Smart IP&O’s service parts forecasting software uses a unique empirical probabilistic forecasting approach that is engineered for intermittent demand. For consumable spare parts, our patented and APICS award winning method rapidly generates tens of thousands of demand scenarios without relying on the assumptions about the nature of demand distributions implicit in traditional forecasting methods. The result is highly accurate estimates of safety stock, reorder points, and service levels, which leads to higher service levels and lower inventory costs. For repairable spare parts, Smart’s Repair and Return Module accurately simulates the processes of part breakdown and repair. It predicts downtime, service levels, and inventory costs associated with the current rotating spare parts pool. Planners will know how many spares to stock to achieve short- and long-term service level requirements and, in operational settings, whether to wait for repairs to be completed and returned to service or to purchase additional service spares from suppliers, avoiding unnecessary buying and equipment downtime.
Contact us to learn more how this functionality has helped our customers in the MRO, Field Service, Utility, Mining, and Public Transportation sectors to optimize their inventory. You can also download the Whitepaper here.
White Paper: What you Need to know about Forecasting and Planning Service Parts
This paper describes Smart Software’s patented methodology for forecasting demand, safety stocks, and reorder points on items such as service parts and components with intermittent demand, and provides several examples of customer success.