Demand Planning with Blanket Orders

Customer as Teacher

Our customers are great teachers who have always helped us bridge the gap between textbook theory and practical application of forecasting and demand planning. Our latest bit of schooling concerns “blanket orders” and how to account for them as part of the demand planning process. 

Expanding the Inventory Theory Textbook

Textbook inventory theory focuses on the three most used replenishment policies: (1) Periodic review order-up-to policy, designated (T, S) in the books (2) Continuous review policy with fixed order quantity, designated (R, Q) and (3) Continuous review order-up-to policy, designated (s, S) but usually called “Min/Max.” Our customers have pointed out that their actual ordering process often includes frequent use of “blanket orders.” This blog focuses on how to incorporate blanket orders into the demand planning process and details how to adjust stocking targets accordingly.

Demand Planning with Blanket Orders is Different

Blanket orders are contracts with suppliers for fixed replenishment quantities arriving at fixed intervals. For example, you might agree with your supplier to receive 20 units every 7 days via a blanket order rather than 60 to 90 units every 28 days under the Periodic Review policy. Blanket orders contrast even more with the Continuous Review policies, under which both order schedules and order quantities are random.  In general, it is efficient to build flexibility into the restocking process so that you order only what you need and only order when you need it. By that standard, Min/Max should make the most sense and blanket policies should make the least sense.

The Case for Blanket Policies

However, while efficiency is important, it is never the only consideration. One of our customers, let’s call them Company X, explained the appeal of blanket policies in their circumstances. Company X makes high-performance parts for motorcycles and ATV’s. They turn raw steel into cool things.  But they must deal with the steel. Steel is expensive. Steel is bulky and heavy. Steel is not something conjured overnight on a special-order basis. The inventory manager at Company X does not want to place large but random-sized orders at random times. He does not want to baby-sit a mountain of steel. His suppliers do not want to receive orders for random quantities at random times. And Company X prefers to spread out its payments. The result: Blanket orders.

The Fatal Flaw in Blanket Policies

For Company X, blanket orders are intended to even out replenishment buys and avoid unwieldy buildups of piles of steel before they are ready for use. But the logic behind continuous review inventory policies still applies. Surges in demand, otherwise welcome, will occur and can create stockouts. Likewise, pauses in demand can create excess demand. As time goes on, it becomes clear that a blanket policy has a fatal flaw: only if the blanket orders exactly match the average demand can they avoid runaway inventory in either direction, up or down. In practice, it will be impossible to exactly match average demand. Furthermore, average demand is a moving target and can drift up or down.

How to Incorporate Blanket Orders when Demand Planning 

A blanket policy does have advantages, but rigidity is its Achilles heel.  Demand planners will often improvise by adjusting future orders to handle changes in demand but this doesn’t scale across thousands of items.  To make the inventory replenishment policy robust against randomness in demand, we suggest a hybrid policy that begins with blanket orders but retains flexibility to automatically (not manually) order additional supply on an as-need basis. Supplementing the blanket policy with a Min/Max backup provides for adjustments without manual intervention. This combination will capture some of the advantages of blanket orders while protecting customer service and avoiding runaway inventory.

Designing a demand planning process that accounts for blanket orders properly requires choice of four control parameters. Two parameters are the fixed size and fixed timing of the blanket policy. Two more are the values of Min and Max. This leaves the inventory manager facing a four-dimensional optimization problem.  Advanced inventory optimization software will make it possible to evaluate choices for the values of the four parameters and to support negotiations with suppliers when crafting blanket orders.


A Beginner’s Guide to Downtime and What to Do about It

This blog provides an overview of this topic written for non-experts. It

  • explains why you might want to read this blog.
  • lists the various types of “machine maintenance.”
  • explains what “probabilistic modeling” is.
  • describes models for predicting downtime.
  • explains what these models can do for you.

Importance of Downtime

If you manufacture things for sale, you need machines to make those things. If your machines are up and running, you have a fighting chance to make money. If your machines are down, you lose opportunities to make money. Since downtime is so fundamental, it is worth some investment of money and thought to minimize downtime. By thought I mean probability math, since machine downtime is inherently a random phenomenon. Probability models can guide maintenance policies.

Machine Maintenance Policies

Maintenance is your defense against downtime. There are multiple types of maintenance policies, ranging from “Do nothing and wait for failure” to sophisticated analytic approaches involving sensors and probability models of failure.

A useful list of maintenance policies is:

  • Sitting back and wait for trouble, then sitting around some more wondering what to do when trouble inevitably happens. This is as foolish as it sounds.
  • Same as above except you prepare for the failure to minimize downtime, e.g., stockpiling spare parts.
  • Periodically checking for impending trouble coupled with interventions such as lubricating moving parts or replacing worn parts.
  • Basing the timing of maintenance on data about machine condition rather than relying on a fixed schedule; requires ongoing data collection and analysis. This is called condition-based maintenance.
  • Using data on machine condition more aggressively by converting it into predictions of failure time and suggestions for steps to take to delay failure. This is called predictive maintenance.

The last three types of maintenance rely on probability math to establish a maintenance schedule, or determine when data on machine condition call for intervention, or calculate when failure might occur and how best to postpone it.


Probability Models of Machine Failure

How long a machine will run before it fails is a random variable. So is the time it will spend down. Probability theory is the part of math that deals with random variables. Random variables are described by their probability distributions, e.g., what is the chance that the machine will run for 100 hours before it goes down? 200 hours? Or, equivalently, what is the chance that the machine is still working after 100 hours or 200 hours?

A sub-field called “reliability theory” answers this type of question and addresses related concepts like Mean Time Before Failure (MTBF), which is a shorthand summary of the information encoded in the probability distribution of time before failure.

Figures 1 shows data on the time before failure of air conditioning units. This type of plot depicts the cumulative probability distribution and shows the chance that a unit will have failed after some amount of time has elapsed. Figure 2 shows a reliability function, plotting the same type of information in an inverse format, i.e., depicting the chance that a unit is still functioning after some amount of time has elapsed.

In Figure 1, the blue tick marks next to the x-axis show the times at which individual air conditioners were observed to fail; this is the basic data. The black curve shows the cumulative proportion of units failed over time. The red curve is a mathematical approximation to the black curve – in this case an exponential distribution. The plots show that about 80 percent of the units will fail before 100 hours of operation.
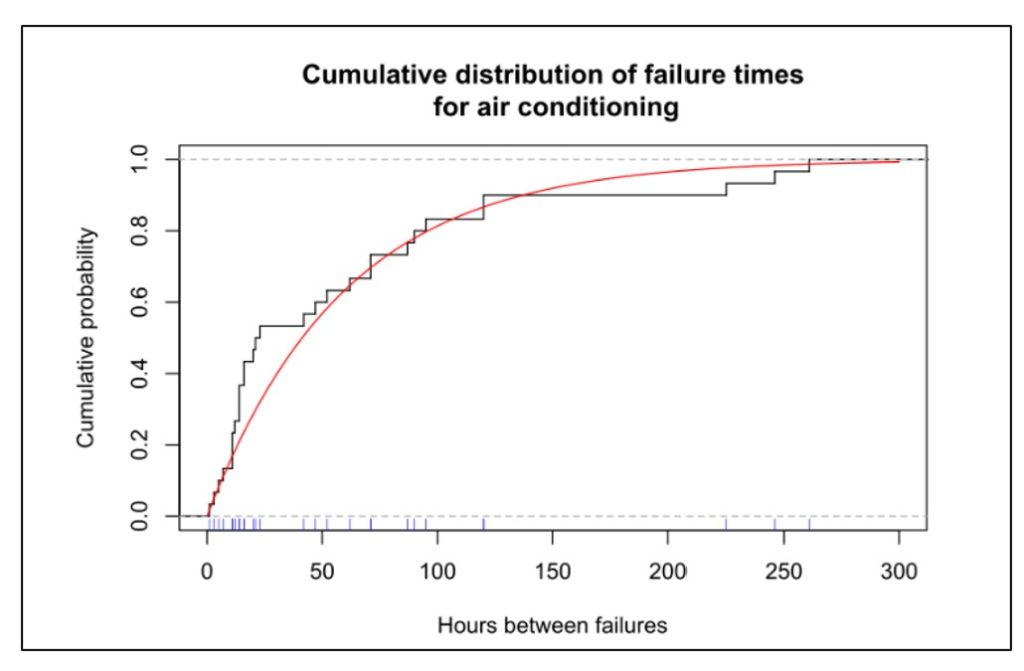
Figure 1 Cumulative distribution function of uptime for air conditioners

Figure 1 Cumulative distribution function of uptime for air conditioners


Probability models can be applied to an individual part or component or subsystem, to a collection of related parts (e.g., “the hydraulic system”), or to an entire machine. Any of these can be described by the probability distribution of the time before they fail.

Figure 2 shows the reliability function of six subsystems in a machine for digging tunnels. The plot shows that the most reliable subsystem is the cutting arms and the least reliable is the water subsystem. The reliability of the entire system could be approximated by multiplying all six curves (because for the system as a whole to work, every subsystem must be functioning), which would result in a very short interval before something goes wrong.
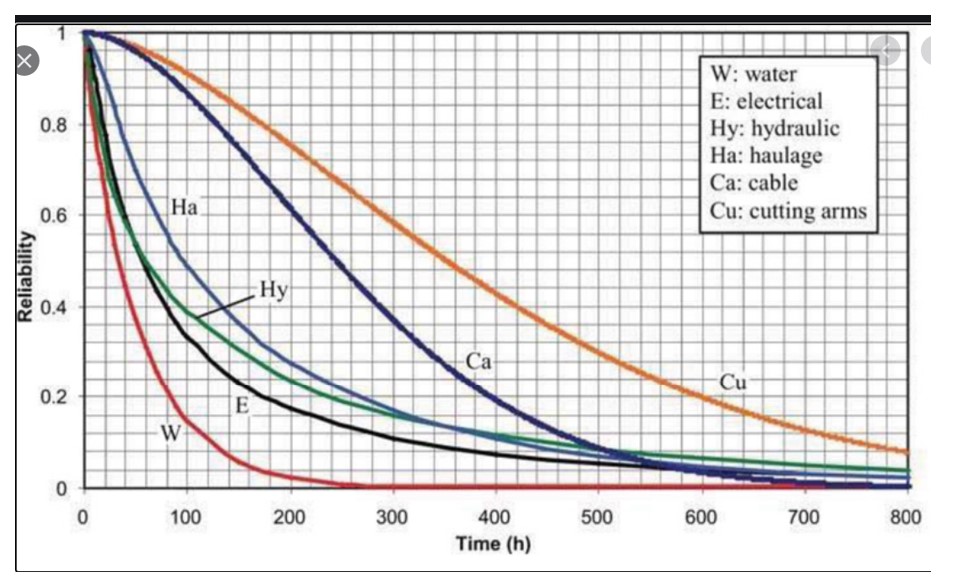
Figure 2 Examples of probability distributions of subsystems in a tunneling machine

Figure 2 Examples of probability distributions of subsystems in a tunneling machine


Various factors influence the distribution of the time before failure. Investing in better parts will prolong system life. So will investing in redundancy. So will replacing used pars with new.

Once a probability distribution is available, it can be used to answer any number of what-if questions, as illustrated below in the section on Benefits of Models.


Approaches to Modeling Machine Reliability

Probability models can describe either the most basic units, such as individual system components (Figure 2), or collections of basic units, such as entire machines (Figure 1). In fact, an entire machine can be modeled either as a single unit or as a collection of components. If treating an entire machine as a single unit, the probability distribution of lifetime represents a summary of the combined effect of the lifetime distributions of each component.

If we have a model of an entire machine, we can jump to models of collections of machines. If instead we start with models of the lifetimes of individual components, then we must somehow combine those individual models into an overall model of the entire machine.

This is where the math can get hairy. Modeling always requires a wise balance between simplification, so that some results are possible, and complication, so that whatever results emerge are realistic. The usual trick is to assume that failures of the individual pieces of the system occur independently.

If we can assume failures occur independently, it is usually possible to model collections of machines. For instance, suppose a production line has four machines churning out the same product. Having a reliability model for a single machine (as in Figure 1) lets us predict, for instance, the chance that only three of the machines will still be working one week from now. Even here there can be a complication: the chance that a machine working today will still be working tomorrow often depends on how long it has been since its last failure. If the time between failures has an exponential distribution like the one in Figure 1, then it turns out that the time of the next failure doesn’t depend on how long it has been since the last failure. Unfortunately, many or even most systems do not have exponential distributions of uptime, so the complication remains.

Even worse, if we start with models of many individual component reliabilities, working our way up to predicting failure times for the entire complex machine may be nearly impossible if we try to work with all the relevant equations directly. In such cases, the only practical way to get results is to use another style of modeling: Monte Carlo simulation.

Monte Carlo simulation is a way to substitute computation for analysis when it is possible to create random scenarios of system operation. Using simulation to extrapolate machine reliability from component reliabilities works as follows.

  1. Start with the cumulative distribution functions (Figure 1) or reliability functions (Figure 2) of each machine component.
  2. Create a random sample from each component lifetime to get a set of sample failure times consistent with its reliability function.
  3. Using the logic of how components are related to one another, compute the failure time of the entire machine.
  4. Repeat steps 1-3 many times to see the full range of possible machine lifetimes.
  5. Optionally, average the results of step 4 to summarize the machine lifetime with such metrics such as the MTBF or the chance that the machine will run more than 500 hours before failing.

Step 1 would be a bit complicated if we do not have a nice probability model for a component lifetime, e.g., something like the red line in Figure 1.

Step 2 can require some careful bookkeeping. As time moves forward in the simulation, some components will fail and be replaced while others will keep grinding on. Unless a component’s lifetime has an exponential distribution, its remaining lifetime will depend on how long the component has been in continual use. So this step must account for the phenomena of burn in or wear out.

Step 3 is different from the others in that it does require some background math, though of a simple type. If Machine A only works when both components 1 and 2 are working, then (assuming failure of one component does not influence failure of the other)

Probability [A works] = Probability [1 works] x Probability [2 works].

If instead Machine A works if either component 1 works or component 2 works or both work, then

Probability [A fails] = Probability [1 fails] x Probability [2 fails]

so Probability [A works] = 1 – Probability [A fails].

Step 4 can involve creation of thousands of scenarios to show the full range of random outcomes. Computation is fast and cheap.

Step 5 can vary depending on the user’s goals. Computing the MTBF is standard. Choose others to suit the problem. Besides the summary statistics provided by step 5, individual simulation runs can be plotted to build intuition about the random dynamics of machine uptime and downtime. Figure 3 shows an example for a single machine showing alternating cycles of uptime and downtime resulting in 85% uptime.
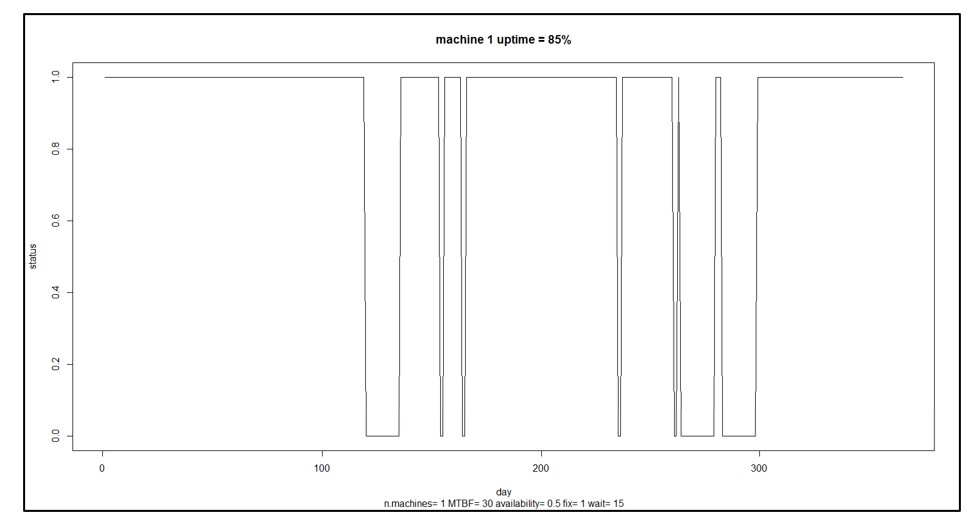
Figure 3 A sample scenario for a single machine

Figure 3 A sample scenario for a single machine


Benefits of Machine Reliability Models

In Figure 3, the machine is up and running 85% of the time. That may not be good enough. You may have some ideas about how to improve the machine’s reliability, e.g., maybe you can improve the reliability of component 3 by buying a newer, better version from a different supplier. How much would that help? That is hard to guess: component 3 may only one of several and perhaps not the weakest link, and how much the change pays off depends on how much better the new one would be. Maybe you should develop a specification for component 3 that you can then shop to potential suppliers, but how long does component 3 have to last to have a material impact on the machine’s MTBF?

This is where having a model pays off. Without a model, you’re relying on guesswork. With a model, you can turn speculation about what-if situations into accurate estimates. For instance, you could analyze how a 10% increase in MTBF for component 3 would translate into an improvement in MTBF for the entire machine.

As another example, suppose you have seven machines producing an important product. You calculate that you must dedicate six of the seven to fill a major order from your one big customer, leaving one machine to handle demand from a number of miscellaneous small customers and to serve as a spare. A reliability model for each machine could be used to estimate the probabilities of various contingencies: all seven machines work and life is good; six machines work so you can at least keep your key customer happy; only five machines work so you have to negotiate something with your key customer, etc.

In sum, probability models of machine or component failure can provide the basis for converting failure time data into smart business decisions.


Read more about  Maximize Machine Uptime with Probabilistic Modeling


Read more about   Probabilistic forecasting for intermittent demand


Leave a Comment
Related Posts
You Need to Team up with the Algorithms

You Need to Team up with the Algorithms

This article is about the real power that comes from the collaboration between you and our software that happens at your fingertips. We often write about the software itself and what goes on “under the hood”. This time, the subject is how you should best team up with the software.

Using Key Performance Predictions to Plan Stocking Policies

Using Key Performance Predictions to Plan Stocking Policies

I can’t imagine being an inventory planner in spare parts, distribution, or manufacturing and having to create safety stock levels, reorder points, and order suggestions without using key performance predictions of service levels, fill rates, and inventory costs.

Top Differences Between Inventory Planning for Finished Goods and for MRO and Spare Parts

Top Differences Between Inventory Planning for Finished Goods and for MRO and Spare Parts

In today’s competitive business landscape, companies are constantly seeking ways to improve their operational efficiency and drive increased revenue. Optimizing service parts management is an often-overlooked aspect that can have a significant financial impact. Companies can improve overall efficiency and generate significant financial returns by effectively managing spare parts inventory. This article will explore the economic implications of optimized service parts management and how investing in Inventory Optimization and Demand Planning Software can provide a competitive advantage.

Thoughts on Spare Parts Planning for Public Transit

The Covid19 pandemic has placed unusual stress on public transit agencies. This stress forces agencies to look again at their spare parts planning processes, which is a key driver up ensuring uptime and balancing service parts inventory costs.

This blog focuses on bus systems and their practices for spare parts management and planning. However, there are lessons here for other types of public transit, including rail and light rail.

Back in 1995, the Transportation Research Board (TRB) of the National Research Council published a report that still has relevance. System-Specific Spare Bus Ratios: A Synthesis of Transit Practice stated

The purpose of this study was to document and examine the critical site-specific variables that affect the number of spare vehicles that bus systems need to maintain maximum service requirements. … Although transit managers generally acknowledged that right-sizing the fleet actually improves operations and lowers cost, many reported difficulties in achieving and consistently maintaining a 20 percent spare ratio as recommended by FTA… The respondents to the survey advocated that more emphasis be placed on developing improved and innovative bus maintenance techniques, which would assist them in minimizing downtime and improving vehicle availability, ultimately leading to reduced spare vehicles and labor and material costs.

Grossly simplified guidelines like “keep 20% spare buses” are easy to understand and measure but grossly mask more detailed tactics that can provide more tailored policies that better steward taxpayer dollars spent on spare parts while ensuring the highest levels of availability. If operational reliability can be improved for each bus, then fewer spares are needed.

One way to keep each bus up and running more often is to improve the management of inventories of spare parts – specifically by forecasting service parts usage and the required replenishment policies more accurately. Here is where modern supply chain management can make a significant contribution. The TRB noted this in their report:

Many agencies have been successful in limiting reliance on excess spare vehicles. Those transit officials agree that several factors and initiatives have led to their success and are critical to the success of any program [including] … Effective use of advanced technology to manage critical maintenance functions, including the orderly and timely replacement of parts… Failure to have available service parts and other components when they are needed will adversely affect any maintenance program.

As long as managers are cognizant of the issues and vigilant about what tools are available to them, the probability of buses [being] ‘out for no stock’ will greatly diminish.”

Effective spare parts inventory management requires a balance between “having enough” and “having too much.” What modern service parts planning software can do is make visible the tradeoff between these two goals so that transit managers can make fact-based decisions about spare parts inventories.

There are enough complications in finding the right balance to require moving beyond simple rules of thumb such as “keep ten days’ worth of demand on hand” or “reorder when you are down to five units in stock.” Factors that drive these decisions include both the average demand for a part, the volatility of that demand, the average replenishment lead time (which can be a problem when the part arrives by slow boat from Germany), the variability in lead time, and several cost factors: holding costs, ordering costs, and shortage costs (e.g., lost fares, loss of public goodwill).

Innovative supply chain analytics and spare parts planning software uses advanced probabilistic forecasting and stochastic optimization methods to manage these complexities and provide greater parts availability at lower cost. For instance, Minnesota’s Metro Transit documented a 4x increase in return on investment in the first six months of implementing a new system. To read more about how public transit agencies are exploiting innovative supply chain analytics, see:


Leave a Comment
Related Posts
You Need to Team up with the Algorithms

You Need to Team up with the Algorithms

This article is about the real power that comes from the collaboration between you and our software that happens at your fingertips. We often write about the software itself and what goes on “under the hood”. This time, the subject is how you should best team up with the software.

Using Key Performance Predictions to Plan Stocking Policies

Using Key Performance Predictions to Plan Stocking Policies

I can’t imagine being an inventory planner in spare parts, distribution, or manufacturing and having to create safety stock levels, reorder points, and order suggestions without using key performance predictions of service levels, fill rates, and inventory costs.

Top Differences Between Inventory Planning for Finished Goods and for MRO and Spare Parts

Top Differences Between Inventory Planning for Finished Goods and for MRO and Spare Parts

In today’s competitive business landscape, companies are constantly seeking ways to improve their operational efficiency and drive increased revenue. Optimizing service parts management is an often-overlooked aspect that can have a significant financial impact. Companies can improve overall efficiency and generate significant financial returns by effectively managing spare parts inventory. This article will explore the economic implications of optimized service parts management and how investing in Inventory Optimization and Demand Planning Software can provide a competitive advantage.

A Primer on Probabilistic Forecasting

The Smart Forecaster

 Pursuing best practices in demand planning,

forecasting and inventory optimization

If you keep up with the news about supply chain analytics, you are more frequently encountering the phrase “probabilistic forecasting.” If this phrase is puzzling, read on.

You probably already know what “forecasting” means. And you probably also know that there seem to be lots of different ways to do it. And you’ve probably heard pungent little phrases like “every forecast is wrong.” So you know that some kind of mathemagic might calculate that “the forecast is you will sell 100 units next month”, and then you might sell 110 units, in which case you have a 10% forecast error.

You may not know that what I just described is a particular kind of forecast called a “point forecast.” A point forecast is so named because it consists of just a single number (i.e., one point on the number line, if you recall the number line from your youth).

Point forecasts have one virtue: They are simple. They also have a flaw: They give rise to snarky statements like “every forecast is wrong.” That is, in most realistic cases, it is unlikely that the actual value will exactly equal the forecast. (Which isn’t such a big deal if the forecast is close enough.)

This gets us to “probabilistic forecasting.” This approach is a step up, because instead of producing a single-number (point) forecast, it yields a probability distribution for the forecast. And unlike traditional extrapolative models that rely purely on the historical data, probabilistic forecasts have the ability to simulate future values that aren’t anchored to the past.

“Probability distribution” is a forbidding phrase, evoking some arcane math that you may have heard of but never studied. Luckily, most adults have enough life experience to have an intuitive grasp of the concept.  When broken down, it’s quite straightforward to understand.

Imagine the simple act of flipping two coins. You might call this harmless fun, but I call it a “probabilistic experiment.” The total number of heads that turn up on the two coins will be either zero, one or two. Flipping two coins is a “random experiment.” The resulting number of heads is a “random variable.” It has a “probability distribution”, which is nothing more than a table of how likely it is that the random variable will turn out to have any of its possible values. The probability of getting two heads when the coins are fair works out to be ¼, as is the probability of no heads. The chance of one head is ½.

The same approach can describe a more interesting random variable, like the daily demand for a spare part.  Figure 2 shows such a probability distribution. It was computed by compiling three years of daily demand data on a certain part used in a scientific instrument sold to hospitals.


Probabilistic demand forecast 1

Figure 1: The probability distribution of daily demand for a certain spare part


The distribution in Figure 1 can be thought of as a probabilistic forecast of demand in a single day. For this particular part, we see that the forecast is very likely to be zero (97% chance), but sometimes will be for a handful of units, and once in three years will be twenty units. Even though the most likely forecast is zero, you would want to keep a few on hand if this part were critical (“…for want of a nail…”)

Now let’s use this information to make a more complicated probabilistic forecast. Suppose you have three units on hand. How many days will it take for you to have none? There are many possible answers, ranging from a single day (if you immediately get a demand for three or more) up to a very large number (since 97% of days see no demand).  The analysis of this question is a bit complicated because of all the many ways this situation can play out, but the final answer that is most informative will be a probability distribution. It turns out that the number of days until there are no units left in stock has the distribution shown in Figure 2.

Probabilistic demand forecast 2

Figure 2: Distribution of the number of days until all three units are gone


The average number of days is 74, which would be a point forecast, but there is a lot of variation around the average. From the perspective of inventory management, it is notable that there is a 25% chance that all the units will be gone after 32 days. So if you decided to order more when you were down to only three on the shelf, it would be good to have the supplier get them to you before a month has passed. If they couldn’t, you’d have a 75% chance of stocking out – not good for a critical part.

The analysis behind Figure 2 involved making some assumptions that were convenient but not necessary if they were not true. The results came from a method called “Monte Carlo simulation”, in which we start with three units, pick a random demand from the distribution in Figure 1, subtract it from the current stock, and continue until the stock is gone, recording how many days went by before you ran out. Repeating this process 100,000 times produced Figure 2.

Applications of Monte Carlo simulation extend to problems of even larger scope than the “when do we run out” example above. Especially important are Monte Carlo forecasts of future demand. While the usual forecasting result is a set of point forecasts (e.g., expected unit demand over the next twelve months), we know that there are any number of ways that the actual demand could play out. Simulation could be used to produce, say, one thousand possible sets of 365 daily demand demands.

This set of demand scenarios would more fully expose the range of possible situations with which an inventory system would have to cope. This use of simulation is called “stress testing”, because it exposes a system to a range of varied but realistic scenarios, including some nasty ones. Those scenarios are then input to mathematical models of the system to see how well it will cope, as reflected in key performance indicators (KPI’s). For instance, in those thousand simulated years of operation, how many stockouts are there in the worst year? the average year? the best year? In fact, what is the full probability distribution of the number of stockouts in a year, and what is the distribution of their size?

Figures 3 and 4 illustrate probabilistic modeling of an inventory control system that converts stockouts to backorders. The system simulated uses a Min/Max control policy with Min = 10 units and Max = 20 units.

Figure 3 shows one simulated year of daily operations in four plots. The first plot shows a particular pattern of random daily demand in which average demand increases steadily from Monday to Friday but disappears on weekends. The second plot shows the number of units on hand each day. Note that there are a dozen times during this simulated year when inventory goes negative, indicating stockouts. The third plot shows the size and timing of replenishment orders. The fourth plot shows the size and timing of backorders.  The information in these plots can be translated into estimates of inventory investment, average units on hand, holding costs, ordering costs and shortage costs.

Probabilistic demand forecast 3

Figure 3: One simulated year of inventory system operation


Figure 3 shows one of one thousand simulated years. Each year will have different daily demands, resulting in different values of metrics like units on hand and the various components of operating cost. Figure 4 plots the distribution of 1,000 simulated values of four KPI’s. Simulating 1,000 years of imagined operation exposes the range of possible results so that planners can account not just for average results but also see best-case and worst-case values.

Probabilistic demand forecast 4

Figure 4: Distributions of four KPI’s based on 1,000 simulations


Monte Carlo simulation is a low-math/high-results approach to probabilistic forecasting: very practical and easy to explain. Advanced probabilistic forecasting methods employed by Smart Software expand upon standard Monte Carlo simulation, yielding extremely accurate estimates of required inventory levels.


Leave a Comment

Related Posts

The Trouble With Turns

The Trouble With Turns

In our travels around the industrial scene, we notice that many companies pay more attention to inventory Turns than they should. We would like to deflect some of this attention to more consequential performance metrics.

The Scourge of Skewness

The Scourge of Skewness

Demand planners have to cope with multiple problems to get their job done. One is the Irritation of Intermittency. The “now you see it, now you don’t” character of intermittent demand, with its heavy mix of zero values, forces the use of advanced statistical methods, such as Smart Software’s patented Markov Bootstrap algorithm. But even within the dark realm of intermittent demand, there are degrees of difficulty: planners must further cope with the potentially costly Scourge of Skewness.

Demand Forecasting in a “Build to Order” Company

Demand Forecasting in a “Build to Order” Company

We often come into contact with potential customers who claim that they cannot use a forecasting system since they are a “build-to-order” manufacturing operation. I find this a puzzling perspective, because whatever these organizations build requires lower level raw materials or intermediate goods. If those lower level inputs are not available when an order for the finished good is received, the order cannot be built. Consequently, the order could be canceled and the associated revenue lost.

Recent Posts

  • Managing Spare Parts Inventory: Best PracticesManaging Spare Parts Inventory: Best Practices
    In this blog, we’ll explore several effective strategies for managing spare parts inventory, emphasizing the importance of optimizing stock levels, maintaining service levels, and using smart tools to aid in decision-making. Managing spare parts inventory is a critical component for businesses that depend on equipment uptime and service reliability. Unlike regular inventory items, spare parts often have unpredictable demand patterns, making them more challenging to manage effectively. An efficient spare parts inventory management system helps prevent stockouts that can lead to operational downtime and costly delays while also avoiding overstocking that unnecessarily ties up capital and increases holding costs. […]
  • 5 Ways to Improve Supply Chain Decision Speed5 Ways to Improve Supply Chain Decision Speed
    The promise of a digital supply chain has transformed how businesses operate. At its core, it can make rapid, data-driven decisions while ensuring quality and efficiency throughout operations. However, it's not just about having access to more data. Organizations need the right tools and platforms to turn that data into actionable insights. This is where decision-making becomes critical, especially in a landscape where new digital supply chain solutions and AI-driven platforms can support you in streamlining many processes within the decision matrix. […]
  • Two employees checking inventory in temporary storage in a distribution warehouse.12 Causes of Overstocking and Practical Solutions
    Managing inventory effectively is critical for maintaining a healthy balance sheet and ensuring that resources are optimally allocated. Here is an in-depth exploration of the main causes of overstocking, their implications, and possible solutions. […]
  • FAQ Mastering Smart IP&O for Better Inventory ManagementFAQ: Mastering Smart IP&O for Better Inventory Management.
    Effective supply chain and inventory management are essential for achieving operational efficiency and customer satisfaction. This blog provides clear and concise answers to some basic and other common questions from our Smart IP&O customers, offering practical insights to overcome typical challenges and enhance your inventory management practices. Focusing on these key areas, we help you transform complex inventory issues into strategic, manageable actions that reduce costs and improve overall performance with Smart IP&O. […]
  • 7 Key Demand Planning Trends Shaping the Future7 Key Demand Planning Trends Shaping the Future
    Demand planning goes beyond simply forecasting product needs; it's about ensuring your business meets customer demands with precision, efficiency, and cost-effectiveness. Latest demand planning technology addresses key challenges like forecast accuracy, inventory management, and market responsiveness. In this blog, we will introduce critical demand planning trends, including data-driven insights, probabilistic forecasting, consensus planning, predictive analytics, scenario modeling, real-time visibility, and multilevel forecasting. These trends will help you stay ahead of the curve, optimize your supply chain, reduce costs, and enhance customer satisfaction, positioning your business for long-term success. […]

    Inventory Optimization for Manufacturers, Distributors, and MRO

    • Managing Spare Parts Inventory: Best PracticesManaging Spare Parts Inventory: Best Practices
      In this blog, we’ll explore several effective strategies for managing spare parts inventory, emphasizing the importance of optimizing stock levels, maintaining service levels, and using smart tools to aid in decision-making. Managing spare parts inventory is a critical component for businesses that depend on equipment uptime and service reliability. Unlike regular inventory items, spare parts often have unpredictable demand patterns, making them more challenging to manage effectively. An efficient spare parts inventory management system helps prevent stockouts that can lead to operational downtime and costly delays while also avoiding overstocking that unnecessarily ties up capital and increases holding costs. […]
    • Innovating the OEM Aftermarket with AI-Driven Inventory Optimization XLInnovating the OEM Aftermarket with AI-Driven Inventory Optimization
      The aftermarket sector provides OEMs with a decisive advantage by offering a steady revenue stream and fostering customer loyalty through the reliable and timely delivery of service parts. However, managing inventory and forecasting demand in the aftermarket is fraught with challenges, including unpredictable demand patterns, vast product ranges, and the necessity for quick turnarounds. Traditional methods often fall short due to the complexity and variability of demand in the aftermarket. The latest technologies can analyze large datasets to predict future demand more accurately and optimize inventory levels, leading to better service and lower costs. […]
    • Future-Proofing Utilities. Advanced Analytics for Supply Chain OptimizationFuture-Proofing Utilities: Advanced Analytics for Supply Chain Optimization
      Utilities in the electrical, natural gas, urban water, and telecommunications fields are all asset-intensive and reliant on physical infrastructure that must be properly maintained, updated, and upgraded over time. Maximizing asset uptime and the reliability of physical infrastructure demands effective inventory management, spare parts forecasting, and supplier management. A utility that executes these processes effectively will outperform its peers, provide better returns for its investors and higher service levels for its customers, while reducing its environmental impact. […]
    • Centering Act Spare Parts Timing Pricing and ReliabilityCentering Act: Spare Parts Timing, Pricing, and Reliability
      In this article, we'll walk you through the process of crafting a spare parts inventory plan that prioritizes availability metrics such as service levels and fill rates while ensuring cost efficiency. We'll focus on an approach to inventory planning called Service Level-Driven Inventory Optimization. Next, we'll discuss how to determine what parts you should include in your inventory and those that might not be necessary. Lastly, we'll explore ways to enhance your service-level-driven inventory plan consistently. […]

      Stay the course


      I’ve stood in front of thousands of students. They’ve been more or less young, more or less technical, more or less experienced – and more or less interested.  I’ve done this as a university faculty member since 1972, first at Massachusetts Institute of Technology, then at Harvard University, finally in the School of Engineering at Rensselaer Polytechnic Institute. Between Harvard and RPI I dropped out of academia temporarily to co-found Smart Software with Charlie Smart and Nelson Hartunian. So since then, I’ve also been busy training business users to exploit the power of advanced analytics for forecasting and inventory optimization.

      As I write this, I’ve just returned to my office at RPI after introducing first-year Industrial Engineering students to the basic concepts of inventory management. If they stick with the program, they will go on to take required courses in supply chain, system simulation, statistical analysis, and optimization. I told them stories about how useful they will be to their companies should they decide to make a career in the world of supply chain. If I’d had more time, I would have mentioned how capable they will be when they graduate relative to many of their corporate peers. These freshmen and ready and willing to stay the course, soaking up all the techniques and theories we can throw at them, and honing their practical skills in summer jobs or coop assignments.

      What I didn’t tell them is that many of them will have to work to keep their intensity when they are on the job. It’s a sad truth that, for whatever reason, many inventory practitioners settle into a kind of stasis that impedes their companies’ ability to exploit the latest technologies, such as cloud-based advanced demand forecasting and inventory optimization. Gather enough of such people in one place and agility and improved efficiency go out the window.

      I think one of the factors that dulls people is that the process of implementation frequently feels painfully incremental and prolonged. It often begins with a sobering inventory of relevant data, its correctness, and its currency. Then it moves to an often-awkward discovery that there really is no systematic process in place and the subsequent need to design a good one going forward. Next is the need to learn to use a new software suite. That step involves learning new vocabulary, some level of probabilistic thought, an ability to interpret new graphs and tables, not to mention a new software interface.  All this takes time and effort.


      Forecast accuracy provides a statistically sound


      We’ve found that a few things help new customers stay the course. One is having a champion among management, an executive sponsor, who can vouch for the commercial importance of a successful implementation while ensuring the users are supported with continuing education.  A second is identifying and training a super-user or two having unusual combinations of technical and communication skills.  A third is breaking the training into bite-sized chunks and testing for comprehension after each chunk and repeating this process until it is clear that the new concepts, vocabulary, and process are fully absorbed. But all those maneuvers will come to naught without management being all-in and ready to stay the course.  Inventory planning practices in place for many years are not going to be replaced entirely over a three-month implementation process.  You’ve got to want it to get it.


      Leave a Comment
      Related Posts
      You Need to Team up with the Algorithms

      You Need to Team up with the Algorithms

      This article is about the real power that comes from the collaboration between you and our software that happens at your fingertips. We often write about the software itself and what goes on “under the hood”. This time, the subject is how you should best team up with the software.

      Using Key Performance Predictions to Plan Stocking Policies

      Using Key Performance Predictions to Plan Stocking Policies

      I can’t imagine being an inventory planner in spare parts, distribution, or manufacturing and having to create safety stock levels, reorder points, and order suggestions without using key performance predictions of service levels, fill rates, and inventory costs.

      Top Differences Between Inventory Planning for Finished Goods and for MRO and Spare Parts

      Top Differences Between Inventory Planning for Finished Goods and for MRO and Spare Parts

      In today’s competitive business landscape, companies are constantly seeking ways to improve their operational efficiency and drive increased revenue. Optimizing service parts management is an often-overlooked aspect that can have a significant financial impact. Companies can improve overall efficiency and generate significant financial returns by effectively managing spare parts inventory. This article will explore the economic implications of optimized service parts management and how investing in Inventory Optimization and Demand Planning Software can provide a competitive advantage.