
Service level is a key performance indicator for companies that put a premium on satisfying customer demand. Service level is defined as the probability of surviving a replenishment lead time without stocking out.
Inventory management best practice begins with setting service level targets, then calculates reorder points (also called Mins) to achieve those targets. These calculations should account for variability in both demand and replenishment lead time. There are many software systems available for doing these calculations. If everything works out, the achieved service level ends up very close to the target service level. Unfortunately, there is often a painful gap between the two.
One reason for the gap is unrealistic models of demand. In many cases, software for calculating reorder points uses textbook formulas based on mathematical assumptions that make analysis simple at the expense of realism. Many “Inventory 101” textbooks use formulas that assume demand has a Normal distribution (a.k.a. the “bell-shaped curve”) for finished goods and the Poisson distribution for spare parts. Fortunately, there are now inventory optimization and forecasting systems that process the actual demand histories of the inventory items using probabilistic forecasting. These solutions calculate an accurate estimate of the distribution – not some idealized version. To learn more check out this past blog on probabilistic forecasting:
But there is a second source of error in textbooks that operates invisibly in many inventory software package: “undershoot”.
Calculations of reorder points almost always assume that stockouts arise when the total demand during a replenishment interval exceeds the reorder point. For example, assume that demand averages 1 unit per day. If lead time is 5 days, then on average lead time demand is 5 units. Setting the reorder point at 5 units would yield a laughable service level somewhere in the vicinity of 50%. Adding safety stock to the calculation might result in a reorder point of, say, 11 units, which might correspond to a service level of 95%. Another way to say this is, starting at a reorder point of 11 units, there should be a 95% chance of surviving the 5 day lead time without experiencing cumulative demand of more than 11 units. Theoretically!
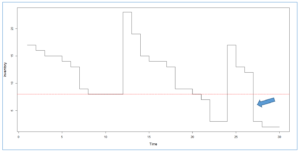
What’s missing from this analysis is the undershoot phenomenon. Undershoot means that the lead time begins not at the reorder point but below it. Undershoot happens every time the demand that breached the reorder point took the stock down below (not down to) the reorder point. The figure below shows replenishment cycles with and without undershoot. Undershoot picks your pocket before you even begin to roll the dice. It deludes the inventory professional into thinking his or her reorder points are sufficient to achieve their targets, whereas actual performance will not make the grade.
There is only one situation in which undershoot is not a worry: when demand is always either zero or one unit. In that case, undershoot is impossible. But in all other cases, undershoot is sure to happen to some extent, and it can seriously undercut the service level actually achieved by a given choice of reorder point. Our analyses show that the conditions most vulnerable to undershoot involve highly intermittent and skewed demand with very short lead times – the very conditions being made most common by market trends.
What can be done to protect yourself from the effect of undershoot on reorder point calculations? Use inventory optimization and forecasting software that isn’t tied to the old textbook assumptions and instead automatically accounts for undershoot when calculating the service level produced by any choice of reorder point.
To see Smart Software’s Inventory Optimization solution in action, register to see a recorded demo below:
Related Posts

Managing Spare Parts Inventory: Best Practices
In this blog, we’ll explore several effective strategies for managing spare parts inventory, emphasizing the importance of optimizing stock levels, maintaining service levels, and using smart tools to aid in decision-making. Managing spare parts inventory is a critical component for businesses that depend on equipment uptime and service reliability. Unlike regular inventory items, spare parts often have unpredictable demand patterns, making them more challenging to manage effectively. An efficient spare parts inventory management system helps prevent stockouts that can lead to operational downtime and costly delays while also avoiding overstocking that unnecessarily ties up capital and increases holding costs.

12 Causes of Overstocking and Practical Solutions
Managing inventory effectively is critical for maintaining a healthy balance sheet and ensuring that resources are optimally allocated. Here is an in-depth exploration of the main causes of overstocking, their implications, and possible solutions.

FAQ: Mastering Smart IP&O for Better Inventory Management.
Effective supply chain and inventory management are essential for achieving operational efficiency and customer satisfaction. This blog provides clear and concise answers to some basic and other common questions from our Smart IP&O customers, offering practical insights to overcome typical challenges and enhance your inventory management practices. Focusing on these key areas, we help you transform complex inventory issues into strategic, manageable actions that reduce costs and improve overall performance with Smart IP&O.
Recent Posts
 Managing Spare Parts Inventory: Best PracticesIn this blog, we’ll explore several effective strategies for managing spare parts inventory, emphasizing the importance of optimizing stock levels, maintaining service levels, and using smart tools to aid in decision-making. Managing spare parts inventory is a critical component for businesses that depend on equipment uptime and service reliability. Unlike regular inventory items, spare parts often have unpredictable demand patterns, making them more challenging to manage effectively. An efficient spare parts inventory management system helps prevent stockouts that can lead to operational downtime and costly delays while also avoiding overstocking that unnecessarily ties up capital and increases holding costs. […]
 5 Ways to Improve Supply Chain Decision SpeedThe promise of a digital supply chain has transformed how businesses operate. At its core, it can make rapid, data-driven decisions while ensuring quality and efficiency throughout operations. However, it's not just about having access to more data. Organizations need the right tools and platforms to turn that data into actionable insights. This is where decision-making becomes critical, especially in a landscape where new digital supply chain solutions and AI-driven platforms can support you in streamlining many processes within the decision matrix. […]
 12 Causes of Overstocking and Practical SolutionsManaging inventory effectively is critical for maintaining a healthy balance sheet and ensuring that resources are optimally allocated. Here is an in-depth exploration of the main causes of overstocking, their implications, and possible solutions. […]
 FAQ: Mastering Smart IP&O for Better Inventory Management.Effective supply chain and inventory management are essential for achieving operational efficiency and customer satisfaction. This blog provides clear and concise answers to some basic and other common questions from our Smart IP&O customers, offering practical insights to overcome typical challenges and enhance your inventory management practices. Focusing on these key areas, we help you transform complex inventory issues into strategic, manageable actions that reduce costs and improve overall performance with Smart IP&O. […]
 7 Key Demand Planning Trends Shaping the FutureDemand planning goes beyond simply forecasting product needs; it's about ensuring your business meets customer demands with precision, efficiency, and cost-effectiveness. Latest demand planning technology addresses key challenges like forecast accuracy, inventory management, and market responsiveness. In this blog, we will introduce critical demand planning trends, including data-driven insights, probabilistic forecasting, consensus planning, predictive analytics, scenario modeling, real-time visibility, and multilevel forecasting. These trends will help you stay ahead of the curve, optimize your supply chain, reduce costs, and enhance customer satisfaction, positioning your business for long-term success. […]

Inventory Optimization for Manufacturers, Distributors, and MRO
- Managing Spare Parts Inventory: Best PracticesIn this blog, we’ll explore several effective strategies for managing spare parts inventory, emphasizing the importance of optimizing stock levels, maintaining service levels, and using smart tools to aid in decision-making. Managing spare parts inventory is a critical component for businesses that depend on equipment uptime and service reliability. Unlike regular inventory items, spare parts often have unpredictable demand patterns, making them more challenging to manage effectively. An efficient spare parts inventory management system helps prevent stockouts that can lead to operational downtime and costly delays while also avoiding overstocking that unnecessarily ties up capital and increases holding costs. […]
 Innovating the OEM Aftermarket with AI-Driven Inventory OptimizationThe aftermarket sector provides OEMs with a decisive advantage by offering a steady revenue stream and fostering customer loyalty through the reliable and timely delivery of service parts. However, managing inventory and forecasting demand in the aftermarket is fraught with challenges, including unpredictable demand patterns, vast product ranges, and the necessity for quick turnarounds. Traditional methods often fall short due to the complexity and variability of demand in the aftermarket. The latest technologies can analyze large datasets to predict future demand more accurately and optimize inventory levels, leading to better service and lower costs. […]
 Future-Proofing Utilities: Advanced Analytics for Supply Chain OptimizationUtilities in the electrical, natural gas, urban water, and telecommunications fields are all asset-intensive and reliant on physical infrastructure that must be properly maintained, updated, and upgraded over time. Maximizing asset uptime and the reliability of physical infrastructure demands effective inventory management, spare parts forecasting, and supplier management. A utility that executes these processes effectively will outperform its peers, provide better returns for its investors and higher service levels for its customers, while reducing its environmental impact. […]
 Centering Act: Spare Parts Timing, Pricing, and ReliabilityIn this article, we'll walk you through the process of crafting a spare parts inventory plan that prioritizes availability metrics such as service levels and fill rates while ensuring cost efficiency. We'll focus on an approach to inventory planning called Service Level-Driven Inventory Optimization. Next, we'll discuss how to determine what parts you should include in your inventory and those that might not be necessary. Lastly, we'll explore ways to enhance your service-level-driven inventory plan consistently. […]