
What is the wiggle effect?
It’s when your statistical forecast incorrectly predicts the ups and downs observed in your demand history when there really isn’t a pattern. It’s important to make sure your forecasts don’t wiggle unless there is a real pattern.
Here is a transcript from a recent customer where this issue was discussed:
Customer: “The forecast isn’t picking up on the patterns I see in the history. Why not?”
Smart: “If you look closely, the ups and downs you see aren’t patterns. It’s really noise.”
Customer: “But if we don’t predict the highs, we’ll stock out.”
Smart: “If the forecast were to ‘wiggle’ it would be much less accurate. The system will forecast whatever pattern is evident, in this case a very slight uptrend. We’ll buffer against the noise with safety stocks. The wiggles are used to set the safety stocks.”
Customer: “Ok. Makes sense now.”
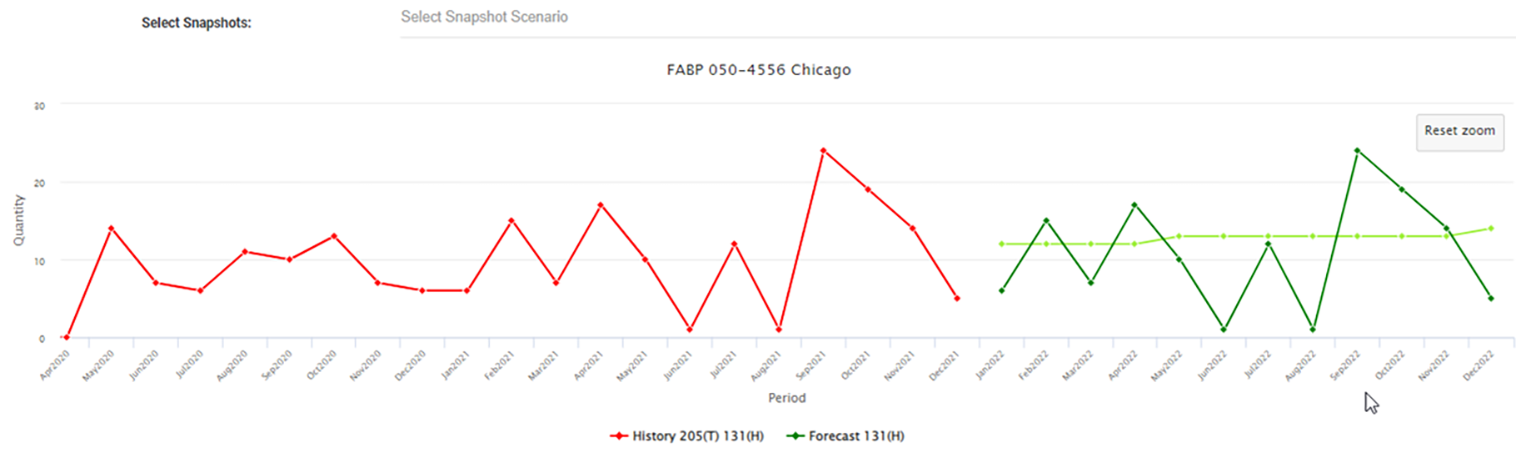
The wiggle looks reassuring but, in this case, it is resulting in an incorrect demand forecast. The ups and downs aren’t really occurring at the same times each month. A better statistical forecast is shown in light green.