Extend Microsoft 365 F&SC and AX with Smart IP&O

Microsoft Dynamics 365 F&SC and AX can manage replenishment by suggesting what to order and when via reorder point-based inventory policies.  A challenge that customers face is that efforts to maintain these levels are very detailed oriented and that the ERP system requires that the user manually specify these reorder points and/or forecasts.  As an alternative, many organizations end up generating inventory policies by hand using Excel spreadsheets or using other ad hoc approaches.

These methods are time-consuming and both likely result in some level of inaccuracy.  As a result, the organization will end up with excess inventory, unnecessary shortages, and a general mistrust of their software systems. In this article, we will review the inventory ordering functionality in AX / D365 F&SC, explain its limitations, and summarize how Smart Inventory Planning & Optimization can help improve a company’s cash position.   This is accomplished by reduced inventory, minimized and controlled stockouts.   Use of Smart Software delivers predictive functionality that is missing in Dynamics 365.

Microsoft Dynamics 365 F&SC and AX Replenishment Policies

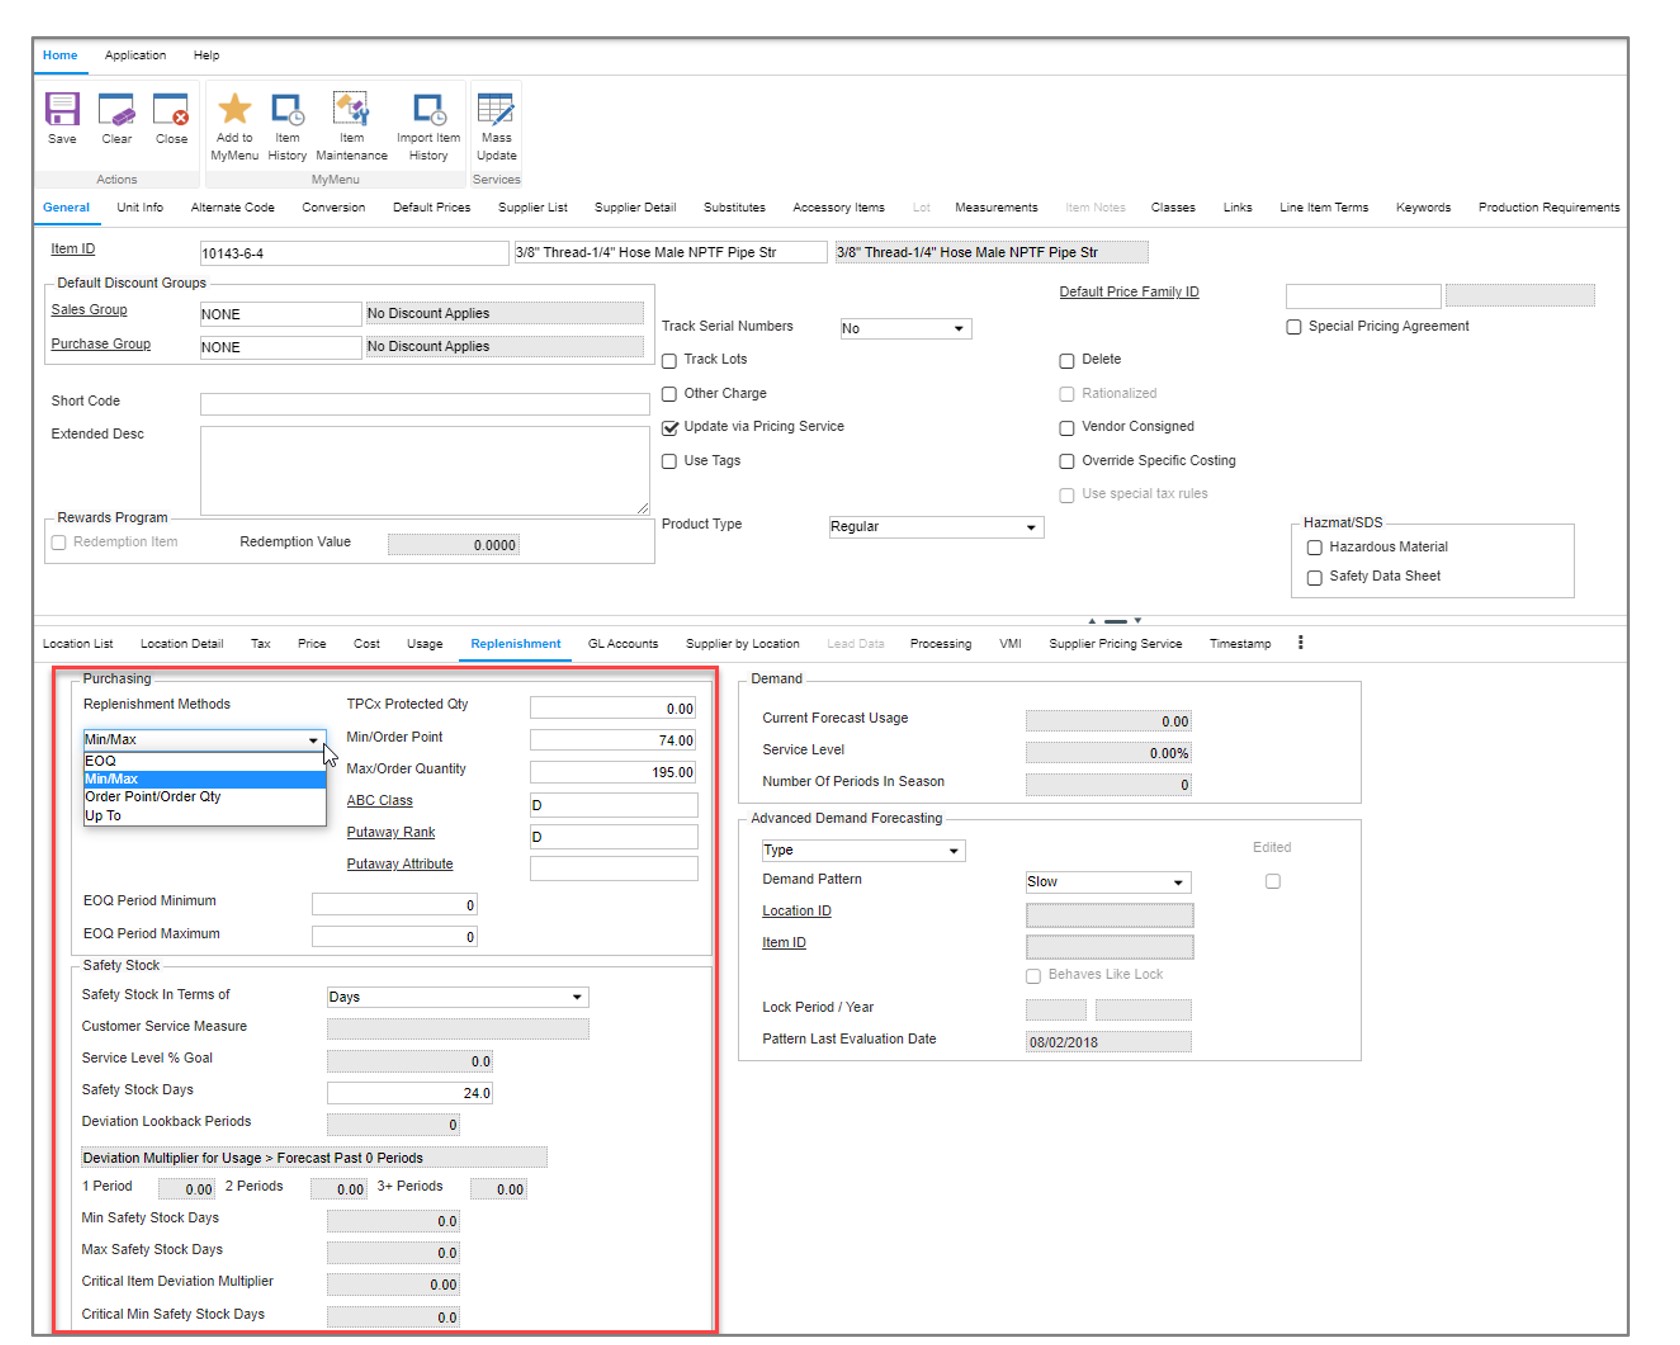
In the inventory management module of AX and F&SC, users can manually enter planning parameters for every stock item. These parameters include reorder points, safety stock lead times, safety stock quantities, reorder cycles, and order modifiers such as supplier imposed minimum and maximum order quantities and order multiples. Once entered, the ERP system will reconcile incoming supply, current on hand, outgoing demand, and the user defined forecasts and stocking policies to net out the supply plan or order schedule (i.e., what to order and when).

There are 4 replenishment policy choices in F&SC and AX:  Fixed Reorder Quantity, Maximum Quantity, Lot-For-Lot and Customer Order Driven.

  • Fixed Reorder Quantity and Max are reorder point-based replenishment methods. Both suggest orders when on hand inventory hits the reorder point. With fixed ROQ, the order size is specified and will not vary until changed. With Max, order sizes will vary based on stock position at time of order with orders being placed up to the Max.
  • Lot-for Lot is a forecasted based replenishment method that pools total demand forecasted over a user defined time frame (the “lot accumulation period”) and generates an order suggestion totaling the forecasted quantity. So, if your total forecasted demand is 100 units per month and the lot accumulation period is 3 months, then your order suggestion would equal 300 units.
  • Order Driven is a make to order based replenishment method. It doesn’t utilize reorder points or forecasts. Think of it as a “sell one, buy one” logic that only places orders after demand is entered.


Limitations

Every one of F&SC / AX replenishment settings must be entered manually or imported through custom uploads created by customers.  There simply isn’t any way for users to natively generate any inputs (especially not optimal ones). The lack of credible functionality for unit level forecasting and inventory optimization within the ERP system is why so many AX and F&SC users are forced to rely on spreadsheets for planning and then manually set the parameters the ERP needs.  In reality, most planners end up manually set demand forecasts and reordering.

And when they can use spread sheets, they often rely on wide rule of thumb methods that results in using simplified statistical models.  Once calculated in the spread sheet these must be loaded into F&SC/AX.  They are often either loaded via cumbersome file imports or manually entered.   Because of the time and effort, it takes to build these, companies do not frequently update these numbers.

Once these are set in place, organizations tend to employ a reactive approach to changes.  The only time a buyer/planner reviews inventory policy is annually or at the time of purchases or manufacturing.   Some firms will also react after encountering problems with inventory levels being short (or too high).  Managing this in AX and F&AS requires manual interrogation to review history, calculate forecasts, assess buffer positions, and to recalibrate.

Microsoft recognizes these constraints in their core ERPs and understands the significant challenges to customers.  In response Microsoft has positioned forecasting under their AI Azure stack.  This method is outside of the core ERPs.  It is offered as a tool set for Data Scientists to use in defining custom complex statistics and calculations as a company wishes.  This is in addition to some basic simple calculations as a starting point are currently in their start up phases of development.  While this may hold long term gains, currently this method means customers start from near scratch and define what Microsoft currently called ‘experiments’ to gauge demand planning.

The bottom line is that customers face large challenges in getting the Dynamics stack itself to help solve these problems.  The result is for CFOs to have less cash available for what they need and for Sales Execs to have sales opportunities unfilled and a potential loss of sales because the firm can’t ship the goods the customer wants.


Get Smarter

Wouldn’t it be better to simply leverage a best of breed add-on for demand planning; and a best of breed inventory optimization solution to manage and balance costs and fulfilment levels?  Wouldn’t it be better to be able to do this on a daily or weekly basis to make your decisions closest to the need, preserving cash while meeting sales demand?

Imagine having a bidirectional integration with AX and F&AS so this all operates easily and quickly.   One where:

  • you could automatically recalibrate policies in frequent planning cycles using field proven, cutting-edge statistical models,
  • you would be able to calculate demand forecasts that account for seasonality, trend, and cyclical patterns,
  • You would automatically leverage optimization methods that prescribe the most profitable stocking policies and service levels that consider the real costs of carrying inventory and stock outages, giving you a full economic picture,
  • You could free up cash for use within the company and manage your inventory levels to improve order fulfillment at the same time as you free this cash.
  • you would have safety stocks and inventory levels that would account for demand and supply variability, business conditions, and priorities,
  • you’d be able to target specific service levels by groups of products, customers, warehouses, or any other dimension you selected,
  • you increase overall company profit and balance sheet health.


Extend Microsoft 365 F&SC and AX with Smart IP&O

To see a recording of the Microsoft Dynamics Communities Webinar showcasing Smart IP&O, register here:

https://smartcorp.com/inventory-planning-with-microsoft-365-fsc-and-ax/


Beyond the forecast – Collaboration and Consensus Planning

5 Steps to Consensus Demand Planning

The whole point of demand forecasting is to establish the best possible view of future demand.  This requires that we draw upon the best data and inputs we can get, leverage statistics to capture underlying patterns, put our heads together to apply overrides based on business knowledge, and agree on a consensus demand plan that serves as cornerstone to the company’s overall demand plan.

Step 1: Develop an accurate demand signal.   What constitutes demand?  Consider how  your organization defines demand – say, confirmed sales orders net of cancellations or shipment data adjusted to remove the impact of historical stockouts  – and use this consistently.  This is your measure of what the market is requesting you to deliver.  Don’t confuse this with your ability to deliver – that should be reflected in the revenue plan.

Step 2: Generate a statistical forecast.  Plan for thousands of items, using a proven forecasting application that automatically pulls in your data and reliably produces accurate forecasts for all of your items.  Review the first pass of your forecast, then make adjustments.  A strike or train wreck may have interrupted shipping last month – don’t let that wag your forecast.  Adjust for these and reforecast.  Do the best you can, then invite others to weigh in.

Step 3: Bring on the experts.  Product line managers, sales leaders, key distribution partners know their markets.  Share your forecast with them.  Smart uses the concept of a “Snapshot” to share a facsimile of your forecast – at any level, for any product line – with people who may know better.  There could be an enormous order that hasn’t hit the pipeline, or a channel partner is about to run their annual promotion.  Give them an easy way to take their portion of the forecast and change it.  Drag this month up, that one down …

Step 4:  Measure Accuracy and Forecast Value Add.  Some of your contributors may be right on the money, other tend to be biased high or low.  Use forecast vs. actuals reporting and measure forecast value add analysis to measure forecast errors and whether changes to the forecast are hurting or helping.  By informing the process with this information, your company will improve it’s ability to forecast more accurately.

Step 5: Agree on the Consensus Forecast.  You can do this one product line or geography at a time, or business by  business.  Convene the team, graphically stack up their inputs, review past accuracy performance, discuss their reasons for increasing or reducing the forecast, and agree on whose inputs to use.  This becomes your consensus plan.  Finalize the plan and send it off – upload forecasts to MRP, send to finance and manufacturing.  You have just kicked off your Sales, Inventory and Operational Planning process.

You can do this.  And we can help.  If you have any questions about collaborative demand planning please reply to this blog, we will follow up.


5 Tips for Creating Smart Forecasts

In Smart Software’s forty-plus years of providing forecasting software, we’ve met many people who find themselves, perhaps surprisingly, becoming demand forecasters. This blog is aimed primarily at those fortunate individuals who are about to start this adventure (though seasoned pros may enjoy the refresher).

Welcome to the field! Good forecasting can make a big difference to your company’s performance, whether you are forecasting to support sales, marketing, production, inventory, or finance.

There is a lot of math and statistics underlying demand forecasting methods, so your assignment suggests that you are not one of those math-phobic people who would rather be poets. Luckily, if you are feeling a bit shaky and not yet healed from your high school geometry class, a lot of the math is built into forecasting software, so your first job is to leave the math for later while you get a view of the big picture. It is indeed a big picture, but let’s isolate few of the ideas that will most help you succeed.


  1. Demand Forecasting is a team sport. Even in a small company, the demand planner is part of a team, with some folks bringing the data, some bringing the tech, and some bringing the business judgment. In a well-run business, your job will never be to simply feed some data into a program and send out a forecast report. Many companies have adopted a process called Sales and Operations Planning (S&OP) in which your forecast will be used to kick off a meeting to make certain judgments (e.g., Should we assume this trend will continue? Will it be worse to under-forecast or over-forecast?) and to blend extra information into the final forecast (e.g., sales force input, business intelligence on competitors’ moves, promotions). The implication for you is that your skills at listening and communicating will be important to your success.


  1. Statistical Forecasting engines need good fuel. Historical data is the fuel used by statistical forecasting programs, so bad or missing or delayed data can degrade your work product. Your job will implicitly include a quality control aspect, and you must keep a keen eye on the data that are supplied to you. Along the way, it is a good idea to make the IT people your friends.


  1. Your name is on your forecasts. Like it or not, if I send forecasts up the chain of command, they get labeled as “Tom’s forecasts.” I must be prepared to own those numbers. To earn my seat at the table, I must be able to explain what data my forecasts were based on, how they were calculated, why I used Method A instead of Method B to do the calculations, and especially how firm or squishy they are. Here honesty is important. No forecast can reasonably be expected to be perfectly accurate, but not all managers can be expected to be perfectly reasonable. If you’re unlucky, your management will think that your reports of forecast uncertainty suggest either ignorance or incompetence. In truth, they indicate professionalism. I have no useful advice about how best to manage such managers, but I can warn you about them. It’s up to you to educate those who use your forecasts. The best managers will appreciate that.


  1. Leave your spreadsheets behind. It’s not uncommon for someone to be promoted to forecaster because they were great with Excel. Unless you are with an unusually small company, the scale of modern corporate forecasting overwhelms what you can handle with spreadsheets. The increasing speed of business compounds the problem: the sleepy tempo of annual and quarterly planning meetings is rapidly giving way to weekly or even daily re-forecasts as conditions change. So, be prepared to lean on a professional vendor of modern, scalable cloud-based demand planning and statistical forecasting software for training and support.


  1. Think visually. It will be very useful, both in deciding how to generate demand forecasts and in presenting them to management, so take advantage of the visualization capabilities built into forecasting software. As I noted above, in today’s high-frequency business world, the data you work with can change rapidly, so what you did last month may not be the right thing to do this month. Literally keep an eye on your data by making simple plots, like “timeplots” that show things like trend or seasonality or (especially) changes in trend or seasonality or anomalies that must be dealt with. Similarly, supplementing tables of forecasts with graphs comparing current forecasts to prior forecasts to actuals can be very helpful in an S&OP process. For example, timeplots showing past values, forecasted values, and “forecast intervals” indicating the objective uncertainty in the forecasts provide a solid basis for your team to fully appreciate the message in your forecasts.


That’s enough for now. As a person who’s taught in universities for half a century, I’m inclined to start into the statistical side of forecasting, but I’ll save that for another time. The five tips above should be helpful to you as you grow into a key part of your corporate planning team. Welcome to the game!


Extend Epicor Prophet 21 with Smart IP&O’s Forecasting & Dynamic Reorder Point Planning

In this article, we will review the inventory ordering functionality in Epicor P21, explain its limitations, and summarize how Smart Inventory Planning & Optimization (Smart IP&O) can help reduce inventory, minimize stock-outs and restore your organization’s trust in your ERP by providing robust predictive analytics, consensus-based forecasting, and what-if scenario planning.

Replenishment Planning Features within Epicor Prophet 21
Epicor P21 can manage replenishment by suggesting what to order and when via reorder point-based or forecast-driven inventory policies.  Users may compute these policies externally or generate them dynamically within P21.  Once the policies and forecasts have been specified, P21’s Purchase Order Requirements Generator (PORG) will create automated order suggestions of what to replenish and when by reconciling incoming supply, current on hand, outgoing demand, stocking policies, and demand forecasts.

Epicor P21 has 4 Replenishment Methods
In the item maintenance screen of Epicor P21, users can choose from one of four replenishment methods for each stock item.

  1. Min/Max
  2. Order Point/Order Quantity
  3. EOQ
  4. Up To

There are additional settings and configurations for determining lead times and accounting for order modifiers such as supplier-imposed minimum and maximum order quantities.  Min/Max and Order Point/Order Quantity are considered “static” policies.  EOQ and Up To are considered “dynamic” policies and computed within P21.

Min/Max
The reorder point is equal to the Min.  Whenever on hand inventory drops below the Min (reorder point) the PORG report will create an order suggestion up to the Max (for example, if on hand after the breach is 20 units and the Max is 100 then the order quantity will be 80).  Min/Max is considered a static policy and once entered into P21 will remain unchanged unless overridden by the user.  Users often run spreadsheets to compute the Min/Max values and update them from time to time.

Order Point/Order Quantity
This is the same as the Min/Max policy except instead of ordering up to the Max, an order will be suggested for a fixed quantity defined by the user (for example, always order 100 units when the order point is breached). OP/OQ is considered a static policy and will remain unchanged unless overridden by the user.  Users often run spreadsheets to compute OP/OQ values and update them from time to time.

EOQ
The EOQ policy is a reorder point-based method.  The reorder point is dynamically generated based on P21’s forecast of demand over lead time + demand over the review period + safety stock.  The order quantity is based on an Economic Order Quantity calculation that considers holding costs and ordering costs and attempts to recommend an order size that minimizes total cost.  When on hand inventory breaches the reorder point, the PORG report will kick out an order equal to the computed EOQ.

Up To
The Up To method is another dynamic policy that relies on a reorder point.  It is computed the same way as the EOQ method using P21’s forecasted demand over the lead time + demand over review period + safety stock.   The order quantity suggestion is based on whatever is needed to replenish stock back “up to” the reorder point.  This tends to equate to an order quantity that is consistent with the lead time demand because as demand drives stock below the reorder point, orders will be suggested “up to” the reorder point.

Epicor Prophet 21 with Forecasting Inventory Planning P21

P21’s Item Maintenance Screen where users can specify the desired inventory policy and configure other settings such as safety stock and order modifiers.

Limitations

Forecast Methods
There are two forecast modes in P21:  Basic and Advanced.  Each use a series of averaging methods and require manual configurations and user determined classification rules to generate a demand forecast.  Neither mode is designed with an out-of-the-box expert system that automatically generates forecasts that account for underlying patterns such as trend or seasonality.  Lots of configuration is required that tends to inhibit user adoption and modification of the assumed forecasting rules defined in the initial implementation that may no longer be relevant.  There isn’t a way to easily compare the forecast accuracy of different configurations.  For example, is it better to use 24 months of history or 18 months?  Is it more accurate to assume a trend should be applied when an item grows by 2% per month or should it be 10%?  Is it better to assume the item is seasonal if 80% or more of it’s demand occurs in 6 months of the year or  4 months of the year? As a result, it is common for classification rules to be too broad or specific resulting in problems such as application of an incorrect forecasting model, using too much or too little history, or over/understating the trend and seasonality.   To learn more about how this works, check out this blog post (coming soon)

Forecast Management & Consensus Planning
P21 lacks forecast management features that enable organizations to plan at multiple hierarchy levels such as product family, region, or by customer.  Forecasts must be created at the lowest level of granularity (product by location) where demand is often too intermittent to get a good forecast.  There isn’t a way to share forecasts, collaborate, review, or create forecasts at aggregate levels, and agree on the consensus plan. It is difficult to incorporate business knowledge, assess forecasts at higher levels of aggregation, and track whether overrides are improving or hurting forecast accuracy. This makes forecasting too one-dimensional and dependent on the initial math configurations.  

Intermittent Demand
Many P21 customers rely on static methods (Min/Max and OP/OQ) because of the prevalence of intermittent demand.  Otherwise known as “lumpy”, intermittent demand is characterized by sporadic sales, large spikes in demand, and many periods with no demand at all. When demand is intermittent, traditional forecasting and safety stock methods just don’t work.  Since distributors don’t have the luxury of stocking only high movers with consistent demand, they need specialized solutions that are engineered to effectively plan intermittently demanded items. 80% or more of a distributor’s parts will have intermittent demand.  The stocking policies that are generated using traditional methods such as those available in P21 and other planning applications will result in incorrect estimates of what to stock to achieve the targeted service level.  As illustrated in the graph below, it isn’t possible to consistently forecast the spikes.  You are stuck with a forecast that is effectively an average of the prior periods.

Epicor Prophet 21 with Forecasting Inventory Management

Forecasts of intermittent demand can’t predict the spikes and require safety stock buffers to protect against stockouts.


Second, P21’s safety stock methods allow you to set a target service level but the underlying logic mistakenly assumes that the demand is normally distributed.  With intermittent demand, the demand isn’t “normal” and therefore the estimate of safety stock will be wrong.   Here is what wrong means: when setting a service level of, for example 98%, the expectation is that 98% of the time the stock on hand will fill 100% of what the customer needs from the shelf.  Using a normal distribution to compute safety stocks will result in large deviations between the targeted service level and actual service level achieved.  It is not uncommon to see situations where the actual service level misses the target by 10% or more (i.e., targeted 95% but only achieved 85%).


Epicor Prophet 21 with Forecasting Inventory Analytics

In this figure you can see the demand history of an intermittently demanded part and two distributions based on this demand history. The first distribution was generated using the same “normal distribution: logic employed by P21. The second is a simulated distribution based on Smart Software’s probabilistic forecasting. The “normal” P21 distribution recommends that 46 units is needed to achieve the 99% service level but when compared to actuals far more inventory was needed. Smart accurately predicted that 63 units was required to achieve the service level.

This blog explains how you can test your system’s service level accuracy.

Reliance on Spreadsheets & Reactive Planning
P21 customers tell us that they rely heavily on the use of spreadsheets to manage stocking policies and forecasting.  Spreadsheets aren’t purpose-built for forecasting and inventory optimization. Users will often bake in user-defined rule of thumb methods that often do more harm than good.  Once calculated, users must input the information back into P21 via manual file imports or even manual entry.  The time consuming nature of the process leads companies to infrequently compute their inventory policies – Many months and on occasion years go by in between mass updates leading to a “set it and forget it” reactive approach, where the only time a buyer/planner reviews inventory policy is at the time of order.  When policies are reviewed after the order point is already breached, it is too late.  When the order point is deemed too high, manual interrogation is required to review history, calculate forecasts, assess buffer positions, and to recalibrate.  The sheer volume of orders means that buyers will just release orders rather than take the painstaking time to review everything, leading to significant excess stock.  If the reorder point is too low, it’s already too late.  An expedite is now required driving up costs and even then, you’ll still lose sales if the customer goes elsewhere.

Limited What If Planning
Since features for modifying reorder points and order quantities are baked into P21 it is not possible to make wholesale changes across groups of items and assess predicted outcomes before deciding to commit.  This forces users to adopt a “wait and see” process when it comes to modifying parameters. Planners will make a change and then monitor actuals until they are confident the change improved things.  Managing this at scale—many planners are dealing with tens of thousands of items—is extremely time consuming and the end result is infrequent recalibration of inventory policy. This also contributes to reactive planning whereby planners will only review settings after a problem has occurred.

Epicor is Smarter
Epicor has partnered with Smart Software and offers Smart IP&O as a cross platform add-on to Prophet 21 complete with a bidirectional API-based integration.  This enables Epicor customers to leverage built-for-purpose best of breed forecasting and inventory optimization applications.  With Epicor Smart IP&O you can generate forecasts that capture trend and seasonality without having to first apply manual configurations.  You will be able to automatically recalibrate policies every planning cycle using field proven, cutting-edge statistical and probabilistic models that were engineered to accurately plan for intermittent demand.   Safety stocks will accurately account for demand and supply variability, business conditions, and priorities.  You can leverage service level driven planning so you have just enough stock or turn on optimization methods that prescribe the most profitable stocking policies and service levels that consider the real cost of carrying inventory. You can build consensus demand forecasts that blend business knowledge with statistics, better assess customer and sales forecasts, and confidently upload forecasts and stocking policies to Epicor with a few mouse-clicks.

Smart IP&O customers routinely realize 7 figure annual returns from reduced expedites, increased sales, and less excess stock, all the while gaining a competitive edge by differentiating themselves on improved customer service. To see a recorded webinar hosted by the Epicor Users Group that profiles Smart’s Demand Planning and Inventory Optimization platform, please register here: https://smartcorp.com/epicor-smart-inventory-planning-optimization/


Scenario-based Forecasting vs. Equations

Why Scenario-based planning helps planners better manage risk and create better outcomes.

If you are reading this, you are probably a supply chain professional with responsibilities for demand forecasting, inventory management or both. If you live in the 21st century, you use software of some kind to help you do your job. But what, fundamentally, does your software do for you?

Traditionally, software has served as a delivery vehicle for equations. Even if you decided early on in life that you and equations don’t get along, they can still do something for you, and you can live with them—provided some software keeps all that math at a safe distance away.

This is fine, as far as it goes. But we at Smart Software think you would do better by trading in your equations for scenarios. Most often, the point of an equation is to give “the answer”, typically in the form of a number, as in “next month’s demand for SKUxxx will be 105 units.” Results like these are helpful, but incomplete.

Forecasting can be thought of as a computing problem, but it is more helpful to think of it as an exercise in risk management. The equation’s forecast of 105 units does not include any indication of the uncertainty in the forecast, though there is always some. It does not help you think about plausible contingencies: what if demand is for more than 105 units? What if it’s for fewer than 105? Could it get as high as 130 or as low as 80? Is 80 even remotely likely?

This is where scenario-based analysis shows its advantage. One definition of “scenario” is “a postulated sequence of events.” Our definition is more extensive: a scenario is “a postulated sequence of events and their associated probabilities of happening.” Scenarios are the ultimate what-if planning tool. Forecasting by equation will predict a demand for 105 units. Scenario forecasting produces a bundle of possible demand figures, some more likely and others less so. If there are few or no scenarios as low as 80, you can let that contingency go.

Plus-or-Minus How Much?

Those who are better versed in equation-based forecasting might protest that equation-based software sometimes provides indications of the “plus or minus” of a forecast, complete with a bell-shaped curve indicating the relative likelihood of various contingencies. However, when you see a perfect bell-shaped distribution, you know you are being asked to rely on a theoretical assumption that is only sometimes valid.

Scenario forecasts do not rely on that assumption.  In fact, they need not rely on any pre-conceived mathematical assumption whose main selling point is that it simplifies analysis. You don’t need a simplified analysis–you need a realistic analysis based on facts.

Cutting-edge software produces scenario forecasts, not just for demand planning but also for inventory management. Demand is a key input to inventory software, along with supplier behavior as reflected in replenishment lead times. Both demand and supply need to be forecasted if you want to see the consequences of, for instance, choosing a reorder point of 15 and an order quantity of 25.

Inventory systems are what is called “path sensitive”, meaning that any particular sequence of demand values will yield different performance than the same demand values in a different order. For example, if all your highest demand periods come bunched up, one after another, you’ll have much more difficulty keeping stocked than if the same high demand periods are spaced apart with time to restock in between. Scenarios reflect these differences in sufficient detail to yield average performance metrics reflective of the various contingencies inherent in uncertain demand.

Figure 1 illustrates the difference between an equation-based forecast and forecast scenarios.  The green cells hold 10 months of demand for a spare part. The blue cells hold an equation-based forecast that calls for average demand of 1.5 units in months 11, 12 and 13. The pistachio-colored cells hold eight scenario forecasts, though in practice our software would generate tens of thousands of scenarios. Now, the scenarios also average out to 1.5 units per month, but they go further and display the wide variety of ways that the next three months could play out. For instance, reading vertically, the monthly demand could range from 0 to 3. Reading horizontally, the three-month totals could range from 0 to 6, compared to the equation-based estimate of 4.5. Continuing with this toy example, if you have 5 units on hand and the replenishment lead time is greater than 3 months, the equation-based model says you will be ok over the next 3 months, but the scenario-based results say you have 1 chance in 8 (12.5%) chance of stocking out. Equivalently, you have an 87.5% service level. If the part is critical and you are aiming for a 95% service level, you are at risk of missing your item availability goal.

Scenario based Forecasting vs Equations hd2

Figure 1: Comparing equation-based and scenario-based forecasts


Summary

Remember, equation-based forecasting gives you information, but shallow information. Scenario-based forecasting can tell you not just what result is most likely but also how reliable any of a variety of predictions are—and this allows you to bring your judgment to bear on balancing risk and stocking expenses—all automated to scale to a vast catalog of items.