12 Causes of Overstocking and Practical Solutions

Inventory overstocking can harm both financial stability and operational efficiency. When an organization is overstocked, it ties up capital in excess inventory that might not sell, increasing storage costs and the risk of inventory obsolescence. Additionally, the funds used to purchase the excess inventory could have been better invested in other areas of the business, such as marketing or research and development. Overstocking also hampers cash flow, as money is locked in stock rather than available for immediate operational needs. Managing inventory effectively is critical for maintaining a healthy balance sheet and ensuring that resources are optimally allocated. Here is an in-depth exploration of the main causes of overstocking, their implications, and possible solutions.


1 Inaccurate Demand Forecasting

One of the primary causes of overstocking is inaccurate demand forecasting. When businesses rely on outdated forecasting methods or insufficient data, they can easily overestimate demand, leading to overstocking. A prime example is the clothing industry, where fashion trends can change rapidly. A well-known fashion brand recently faced challenges after overestimating demand for a new clothing line based on flawed data analysis, leading to unsold inventory.

To address this issue, companies can implement new technologies that automatically select the best forecasting methods for the data, incorporating trends and seasonal patterns to ensure accuracy. By improving forecasting accuracy, businesses can better align their inventory with actual demand, leading to more precise inventory management and fewer overstock scenarios. For instance, a Hardware retailer using Smart Demand Planner reduced forecasting errors by 15%, demonstrating the potential for significant improvement in inventory management​​​​.


2 Improper Inventory Management

Effective inventory management is fundamental to prevent overstocking. Without accurate systems to track inventory levels, businesses might order excess stock and incur higher expenses. This issue often stems from reliance on spreadsheets or inefficient ERP systems that lack real-time data integration.

State-of-the-art technologies provide real-time visibility into inventory levels, allowing businesses to automate and optimize reordering processes.  A large electric utility company faced challenges in maintaining service parts availability without overstocking, managing over 250,000 part numbers across a diverse network of power generation and distribution facilities. The company replaced its outdated system with Smart IP&O and integrated it in real-time with their Enterprise Asset Management (EAM) system. Smart IP&O enabled the utility to use “what-if” scenarios, creating digital twins of alternate stocking policies and simulating performance across key performance indicators, such as inventory value, service levels, fill rates, and shortage costs. This allowed the utility to make targeted adjustments to their stocking parameters, which were then deployed to their EAM system, driving optimal replenishments of spare parts.

The outcome was significant: a $9 million reduction in inventory, freeing up cash and valuable warehouse space while sustaining target service levels of over 99%​


3 Overly Optimistic Sales Projections

Businesses, especially those in growth phases, may predict higher sales than they achieve, leading to excess inventory intended to meet anticipated demand that never materializes. An example of this is the recent case with an electric vehicle manufacturer that projected high sales for its truck but faced production delays and lower-than-expected demand, resulting in an overstock of components and parts. This miscalculation led to increased storage costs and strained financial resources.

Another automotive aftermarket company struggled to forecast intermittently demanded parts accurately, frequently resulting in overstocking and stockouts.  Using AI-driven technology enabled the company to significantly reduce backorders and lost sales, with fill rates improving from 93% to 96% within just three months. By leveraging Smart IP&O forecasting technologies, the company could generate accurate estimates of cumulative demand over lead times, providing better visibility of potential demand scenarios. This allowed for optimized inventory levels, reducing storage costs and improving financial efficiency by aligning inventory with actual demand​.


4 Bulk Purchasing Discounts

The appeal of cost savings from bulk purchases can prompt businesses to buy more than needed, tying up capital and storage space. This often leads to storage challenges when excess stock is ordered to secure a discount.

To address this challenge, businesses should weigh the benefits of bulk discounts against the costs of holding excess inventory. Next-generation technology can help identify the most cost-effective purchasing strategy by balancing immediate savings with long-term storage costs. By implementing Smart IP&O, MNR could accurately forecast inventory requirements and optimize its inventory management processes. This led to an 8% reduction in parts inventory, reaching a high customer service level of 98.7% and reducing inventory growth for new equipment from a projected 10% to only 6%.


5 Seasonal Demand Fluctuations

Difficulty in aligning inventory with seasonal demand can result in surplus stock once the peak sales period ends. Toy manufacturers, for example, might produce too many holiday-themed toys only to face low demand after the holidays. The fashion industry frequently experiences similar challenges, with certain styles becoming obsolete as seasons change. The latest technologies can help businesses anticipate seasonal demand shifts and adjust inventory levels accordingly. By analyzing past sales data and predicting future trends, businesses can better prepare for seasonal fluctuations, minimize overstocking risk, and improve inventory turnover.


6 Supplier Lead Time Variability

Unreliable supplier lead times can lead to overstocking as a buffer against delays. If lead times improve or demand decreases unexpectedly, businesses may have excess inventory. For example, an auto parts distributor might stockpile components to mitigate supplier delays, only to find lead times improving suddenly.

12 Causes of Overstocking and Practical Solutions

Advanced technology can help by providing real-time data and predictive analytics to manage lead time variability better. These tools allow companies to dynamically adjust their orders, reducing the need for excessive safety stock.


7 Inadequate Inventory Policies

Outdated or incorrect inventory policies, such as faulty Min/Max settings, can lead to over-ordering.  However, using Modern technology to regularly review and update inventory policies ensures they align with current business needs and market conditions. By keeping policies up-to-date, businesses can reduce the risk of overstocking due to procedural errors. A recent case study demonstrated how a major retailer used Smart IP&O to revise inventory policies, resulting in a 15% reduction in overstock​​.


8 Promotions and Marketing Campaigns

Misalignment between marketing efforts and actual customer demand can cause businesses to overestimate the impact of promotions, resulting in unsold inventory. For example, a cosmetics company might overproduce a limited edition product, expecting high demand that doesn’t materialize. Leveraging Smart IP&O can help align marketing initiatives with realistic demand expectations, avoiding excess stock. By integrating marketing plans with demand forecasts, businesses can optimize their promotional strategies to better match actual customer interest.


9 Fear of Stockouts

Companies often maintain higher inventory levels to avoid stockouts, which can lead to lost sales and unhappy customers. This fear can drive businesses to overstock as a safety net, especially in industries where customer satisfaction and retention are crucial. A notable example comes from a large retail chain that significantly increased its inventory of household goods to avoid stockouts. While this strategy initially helped meet customer demand, it later resulted in excess inventory as consumer purchasing patterns stabilized. This overstocking contributed to a profit drop of nearly 90% in the second quarter, largely due to markdowns and the clearing of excess stock.

To mitigate such situations, businesses can utilize advanced inventory planning and optimization tools to provide accurate demand forecasts. For instance, a leading electronics manufacturer used Smart IP&O solution to reduce inventory levels by 20% without impacting service levels, effectively reducing costs while maintaining customer satisfaction by ensuring they had the right amount of stock on hand​​​​.


10 Overcompensation for Supply Chain Issues

Businesses may overstock to safeguard against ongoing supply chain disruptions, but this can lead to storage issues. For instance, a tech company might stockpile components to avoid potential supply chain hiccups, resulting in surplus inventory and increased costs. Advanced systems can help businesses better anticipate and respond to supply chain challenges, balancing the need for safety stock with the risk of overstocking. A technology firm used Smart IP&O to streamline its inventory strategy, reducing excess stock by 20% while maintaining supply chain resilience​​.


11 Long Lead Times and Unreliable Suppliers

Prolonged lead times and unreliable suppliers can lead businesses to order more stock than needed to cover potential supply gaps. However, less critical Items that are forecasted to achieve very high service levels represent opportunities to reduce inventory.  By targeting lower service levels on less critical items, inventory will be “right size” over time to the new equilibrium, decreasing holding costs and the value of inventory on hand. A major public transit system reduced inventory by more than $4,000,000 while improving service levels using our cutting-edge technology.


12 Lack of Real-Time Inventory Visibility

Without real-time insights into inventory, businesses often order more stock than necessary, leading to inefficiencies and increased costs. Smart IP&O enabled Seneca companies to model demand at each stocking location and, using service level-driven planning, determine how much to stock to achieve the service level we require.  By running and comparing different scenarios, they can easily define and update optimal stocking policies for each tech support rep and stockrooms.

The software has provided field technicians with evidence they did not have before, showing them their actual consumption, frequency of part use, and rationale for stocking policies, using 90% as the targeted service level norm.  Field technicians have embraced its use, with significant results:  “Zero Turns” inventory has dropped from $400K to under $100K, “First Fix Rate” exceeds 90%, and total inventory investment has decreased by more than 25%, from $11 million to $ 8 million.


In conclusion, overstocking seriously threatens business profitability and efficiency, leading to increased storage costs, tied-up capital, and potential obsolescence of goods. These issues can strain resources and limit a company’s ability to respond to market changes. However, overstocking can be effectively managed by understanding its causes, such as inaccurate demand forecasting, prolonged lead times, and unreliable suppliers. Implementing robust AI-driven solutions like Smart IP&O can help businesses optimize inventory levels, reduce excess stock, and enhance operational efficiency. By leveraging advanced forecasting and inventory optimization tools, companies can find the right balance in meeting customer demand and minimizing inventory-related costs.


A Primer on Probabilistic Forecasting

The Smart Forecaster

 Pursuing best practices in demand planning,

forecasting and inventory optimization

If you keep up with the news about supply chain analytics, you are more frequently encountering the phrase “probabilistic forecasting.” If this phrase is puzzling, read on.

You probably already know what “forecasting” means. And you probably also know that there seem to be lots of different ways to do it. And you’ve probably heard pungent little phrases like “every forecast is wrong.” So you know that some kind of mathemagic might calculate that “the forecast is you will sell 100 units next month”, and then you might sell 110 units, in which case you have a 10% forecast error.

You may not know that what I just described is a particular kind of forecast called a “point forecast.” A point forecast is so named because it consists of just a single number (i.e., one point on the number line, if you recall the number line from your youth).

Point forecasts have one virtue: They are simple. They also have a flaw: They give rise to snarky statements like “every forecast is wrong.” That is, in most realistic cases, it is unlikely that the actual value will exactly equal the forecast. (Which isn’t such a big deal if the forecast is close enough.)

This gets us to “probabilistic forecasting.” This approach is a step up, because instead of producing a single-number (point) forecast, it yields a probability distribution for the forecast. And unlike traditional extrapolative models that rely purely on the historical data, probabilistic forecasts have the ability to simulate future values that aren’t anchored to the past.

“Probability distribution” is a forbidding phrase, evoking some arcane math that you may have heard of but never studied. Luckily, most adults have enough life experience to have an intuitive grasp of the concept.  When broken down, it’s quite straightforward to understand.

Imagine the simple act of flipping two coins. You might call this harmless fun, but I call it a “probabilistic experiment.” The total number of heads that turn up on the two coins will be either zero, one or two. Flipping two coins is a “random experiment.” The resulting number of heads is a “random variable.” It has a “probability distribution”, which is nothing more than a table of how likely it is that the random variable will turn out to have any of its possible values. The probability of getting two heads when the coins are fair works out to be ¼, as is the probability of no heads. The chance of one head is ½.

The same approach can describe a more interesting random variable, like the daily demand for a spare part.  Figure 2 shows such a probability distribution. It was computed by compiling three years of daily demand data on a certain part used in a scientific instrument sold to hospitals.


Probabilistic demand forecast 1

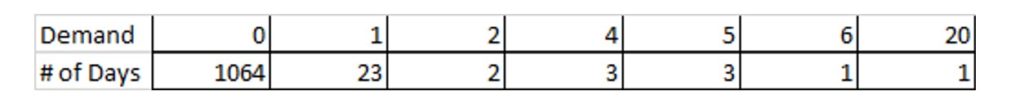
Figure 1: The probability distribution of daily demand for a certain spare part


The distribution in Figure 1 can be thought of as a probabilistic forecast of demand in a single day. For this particular part, we see that the forecast is very likely to be zero (97% chance), but sometimes will be for a handful of units, and once in three years will be twenty units. Even though the most likely forecast is zero, you would want to keep a few on hand if this part were critical (“…for want of a nail…”)

Now let’s use this information to make a more complicated probabilistic forecast. Suppose you have three units on hand. How many days will it take for you to have none? There are many possible answers, ranging from a single day (if you immediately get a demand for three or more) up to a very large number (since 97% of days see no demand).  The analysis of this question is a bit complicated because of all the many ways this situation can play out, but the final answer that is most informative will be a probability distribution. It turns out that the number of days until there are no units left in stock has the distribution shown in Figure 2.

Probabilistic demand forecast 2

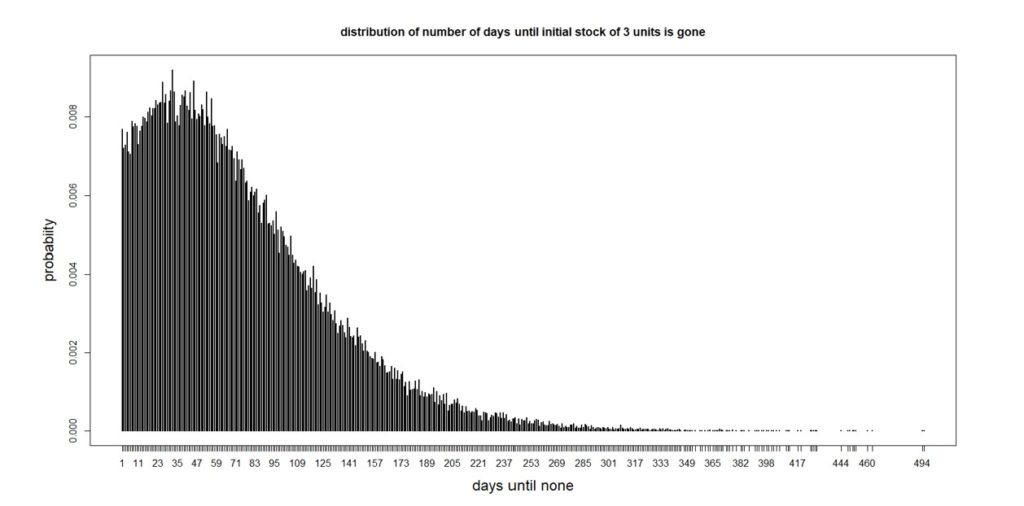
Figure 2: Distribution of the number of days until all three units are gone


The average number of days is 74, which would be a point forecast, but there is a lot of variation around the average. From the perspective of inventory management, it is notable that there is a 25% chance that all the units will be gone after 32 days. So if you decided to order more when you were down to only three on the shelf, it would be good to have the supplier get them to you before a month has passed. If they couldn’t, you’d have a 75% chance of stocking out – not good for a critical part.

The analysis behind Figure 2 involved making some assumptions that were convenient but not necessary if they were not true. The results came from a method called “Monte Carlo simulation”, in which we start with three units, pick a random demand from the distribution in Figure 1, subtract it from the current stock, and continue until the stock is gone, recording how many days went by before you ran out. Repeating this process 100,000 times produced Figure 2.

Applications of Monte Carlo simulation extend to problems of even larger scope than the “when do we run out” example above. Especially important are Monte Carlo forecasts of future demand. While the usual forecasting result is a set of point forecasts (e.g., expected unit demand over the next twelve months), we know that there are any number of ways that the actual demand could play out. Simulation could be used to produce, say, one thousand possible sets of 365 daily demand demands.

This set of demand scenarios would more fully expose the range of possible situations with which an inventory system would have to cope. This use of simulation is called “stress testing”, because it exposes a system to a range of varied but realistic scenarios, including some nasty ones. Those scenarios are then input to mathematical models of the system to see how well it will cope, as reflected in key performance indicators (KPI’s). For instance, in those thousand simulated years of operation, how many stockouts are there in the worst year? the average year? the best year? In fact, what is the full probability distribution of the number of stockouts in a year, and what is the distribution of their size?

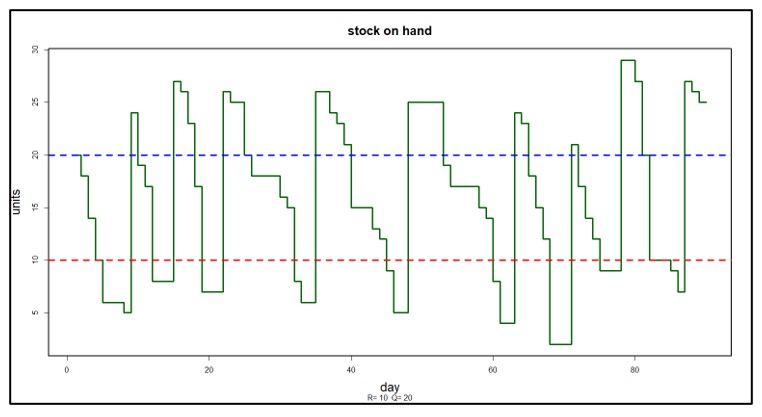
Figures 3 and 4 illustrate probabilistic modeling of an inventory control system that converts stockouts to backorders. The system simulated uses a Min/Max control policy with Min = 10 units and Max = 20 units.

Figure 3 shows one simulated year of daily operations in four plots. The first plot shows a particular pattern of random daily demand in which average demand increases steadily from Monday to Friday but disappears on weekends. The second plot shows the number of units on hand each day. Note that there are a dozen times during this simulated year when inventory goes negative, indicating stockouts. The third plot shows the size and timing of replenishment orders. The fourth plot shows the size and timing of backorders.  The information in these plots can be translated into estimates of inventory investment, average units on hand, holding costs, ordering costs and shortage costs.

Probabilistic demand forecast 3

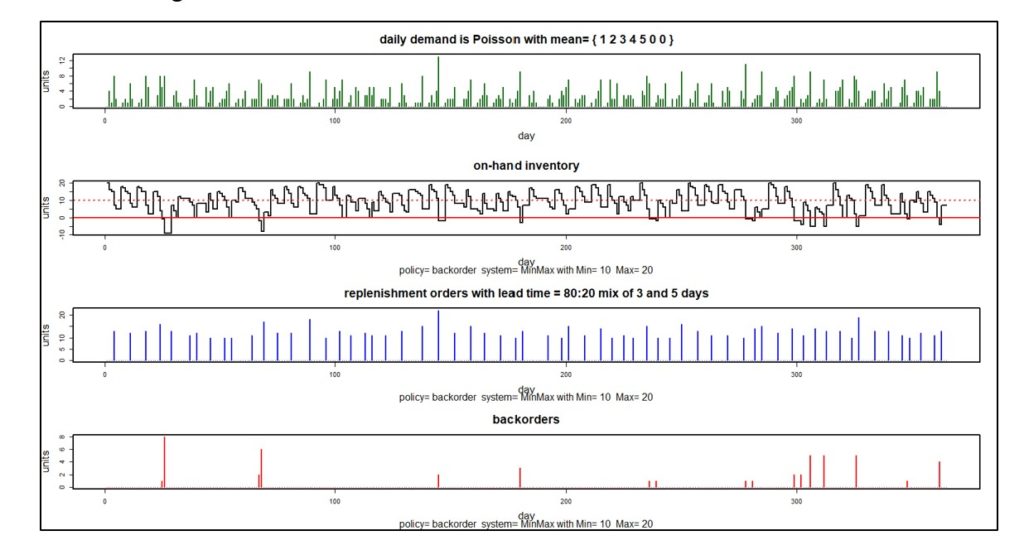
Figure 3: One simulated year of inventory system operation


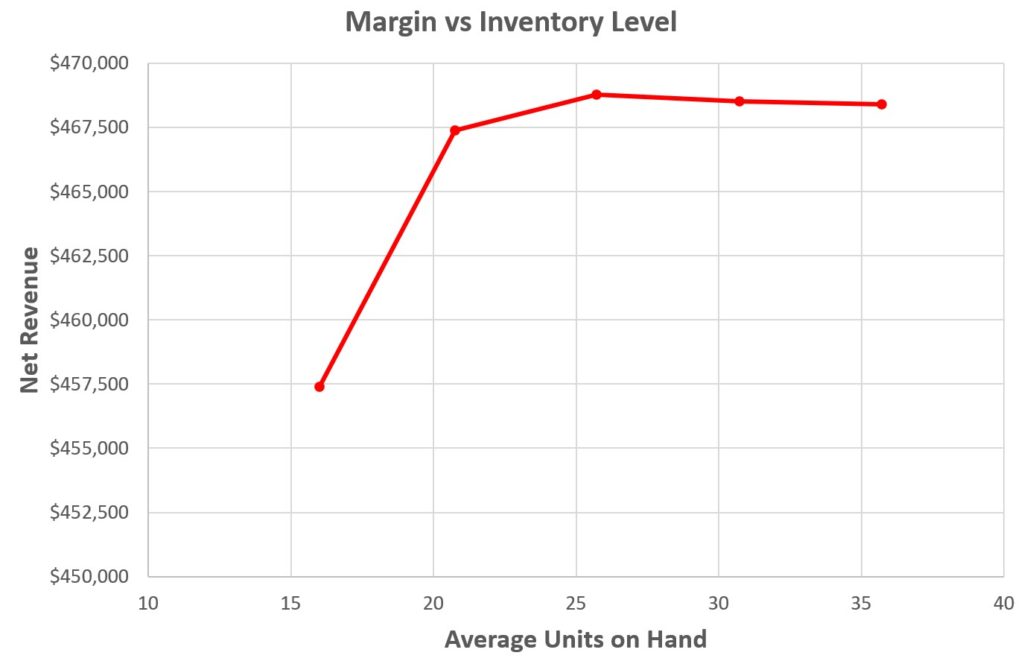
Figure 3 shows one of one thousand simulated years. Each year will have different daily demands, resulting in different values of metrics like units on hand and the various components of operating cost. Figure 4 plots the distribution of 1,000 simulated values of four KPI’s. Simulating 1,000 years of imagined operation exposes the range of possible results so that planners can account not just for average results but also see best-case and worst-case values.

Probabilistic demand forecast 4

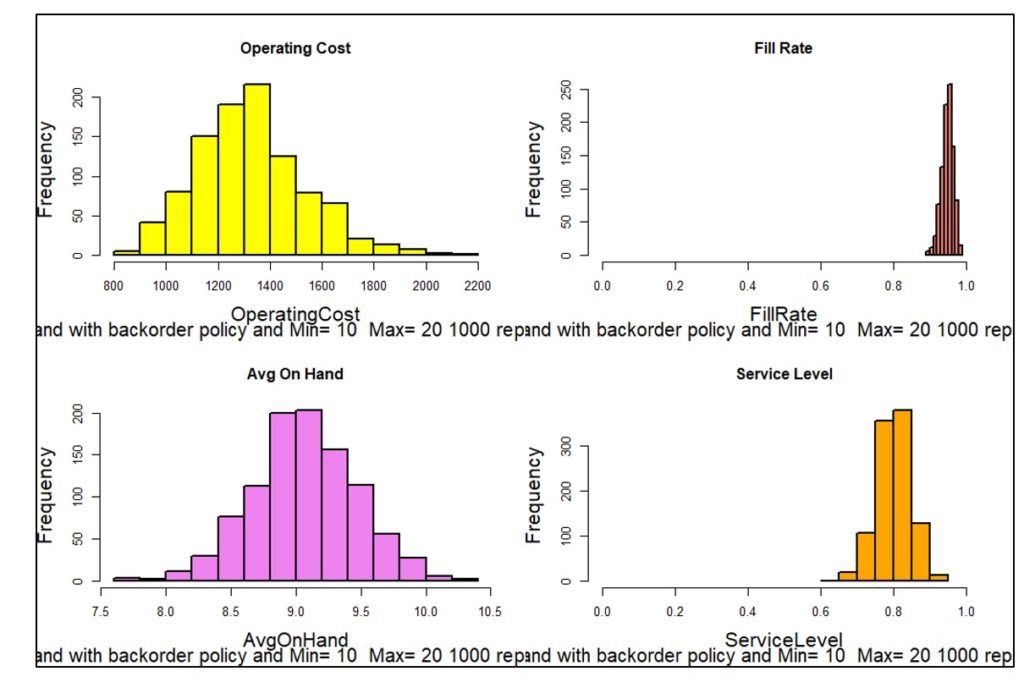
Figure 4: Distributions of four KPI’s based on 1,000 simulations


Monte Carlo simulation is a low-math/high-results approach to probabilistic forecasting: very practical and easy to explain. Advanced probabilistic forecasting methods employed by Smart Software expand upon standard Monte Carlo simulation, yielding extremely accurate estimates of required inventory levels.


Leave a Comment

Related Posts

Make AI-Driven Inventory Optimization an Ally for Your Organization

Make AI-Driven Inventory Optimization an Ally for Your Organization

In this blog, we will explore how organizations can achieve exceptional efficiency and accuracy with AI-driven inventory optimization. Traditional inventory management methods often fall short due to their reactive nature and reliance on manual processes. Maintaining optimal inventory levels is fundamental for meeting customer demand while minimizing costs. The introduction of AI-driven inventory optimization can significantly reduce the burden of manual processes, providing relief to supply chain managers from tedious tasks.

Daily Demand Scenarios

Daily Demand Scenarios

In this Videoblog, we will explain how time series forecasting has emerged as a pivotal tool, particularly at the daily level, which Smart Software has been pioneering since its inception over forty years ago. The evolution of business practices from annual to more refined temporal increments like monthly and now daily data analysis illustrates a significant shift in operational strategies.

Constructive Play with Digital Twins

Constructive Play with Digital Twins

Those of you who track hot topics will be familiar with the term “digital twin.” Those who have been too busy with work may want to read on and catch up. While there are several definitions of digital twin, here’s one that works well: A digital twin is a dynamic virtual copy of a physical asset, process, system, or environment that looks like and behaves identically to its real-world counterpart. A digital twin ingests data and replicates processes so you can predict possible performance outcomes and issues that the real-world product might undergo.

Recent Posts

  • Managing Spare Parts Inventory: Best PracticesManaging Spare Parts Inventory: Best Practices
    In this blog, we’ll explore several effective strategies for managing spare parts inventory, emphasizing the importance of optimizing stock levels, maintaining service levels, and using smart tools to aid in decision-making. Managing spare parts inventory is a critical component for businesses that depend on equipment uptime and service reliability. Unlike regular inventory items, spare parts often have unpredictable demand patterns, making them more challenging to manage effectively. An efficient spare parts inventory management system helps prevent stockouts that can lead to operational downtime and costly delays while also avoiding overstocking that unnecessarily ties up capital and increases holding costs. […]
  • 5 Ways to Improve Supply Chain Decision Speed5 Ways to Improve Supply Chain Decision Speed
    The promise of a digital supply chain has transformed how businesses operate. At its core, it can make rapid, data-driven decisions while ensuring quality and efficiency throughout operations. However, it's not just about having access to more data. Organizations need the right tools and platforms to turn that data into actionable insights. This is where decision-making becomes critical, especially in a landscape where new digital supply chain solutions and AI-driven platforms can support you in streamlining many processes within the decision matrix. […]
  • Two employees checking inventory in temporary storage in a distribution warehouse.12 Causes of Overstocking and Practical Solutions
    Managing inventory effectively is critical for maintaining a healthy balance sheet and ensuring that resources are optimally allocated. Here is an in-depth exploration of the main causes of overstocking, their implications, and possible solutions. […]
  • FAQ Mastering Smart IP&O for Better Inventory ManagementFAQ: Mastering Smart IP&O for Better Inventory Management.
    Effective supply chain and inventory management are essential for achieving operational efficiency and customer satisfaction. This blog provides clear and concise answers to some basic and other common questions from our Smart IP&O customers, offering practical insights to overcome typical challenges and enhance your inventory management practices. Focusing on these key areas, we help you transform complex inventory issues into strategic, manageable actions that reduce costs and improve overall performance with Smart IP&O. […]
  • 7 Key Demand Planning Trends Shaping the Future7 Key Demand Planning Trends Shaping the Future
    Demand planning goes beyond simply forecasting product needs; it's about ensuring your business meets customer demands with precision, efficiency, and cost-effectiveness. Latest demand planning technology addresses key challenges like forecast accuracy, inventory management, and market responsiveness. In this blog, we will introduce critical demand planning trends, including data-driven insights, probabilistic forecasting, consensus planning, predictive analytics, scenario modeling, real-time visibility, and multilevel forecasting. These trends will help you stay ahead of the curve, optimize your supply chain, reduce costs, and enhance customer satisfaction, positioning your business for long-term success. […]

    Inventory Optimization for Manufacturers, Distributors, and MRO

    • Managing Spare Parts Inventory: Best PracticesManaging Spare Parts Inventory: Best Practices
      In this blog, we’ll explore several effective strategies for managing spare parts inventory, emphasizing the importance of optimizing stock levels, maintaining service levels, and using smart tools to aid in decision-making. Managing spare parts inventory is a critical component for businesses that depend on equipment uptime and service reliability. Unlike regular inventory items, spare parts often have unpredictable demand patterns, making them more challenging to manage effectively. An efficient spare parts inventory management system helps prevent stockouts that can lead to operational downtime and costly delays while also avoiding overstocking that unnecessarily ties up capital and increases holding costs. […]
    • Innovating the OEM Aftermarket with AI-Driven Inventory Optimization XLInnovating the OEM Aftermarket with AI-Driven Inventory Optimization
      The aftermarket sector provides OEMs with a decisive advantage by offering a steady revenue stream and fostering customer loyalty through the reliable and timely delivery of service parts. However, managing inventory and forecasting demand in the aftermarket is fraught with challenges, including unpredictable demand patterns, vast product ranges, and the necessity for quick turnarounds. Traditional methods often fall short due to the complexity and variability of demand in the aftermarket. The latest technologies can analyze large datasets to predict future demand more accurately and optimize inventory levels, leading to better service and lower costs. […]
    • Future-Proofing Utilities. Advanced Analytics for Supply Chain OptimizationFuture-Proofing Utilities: Advanced Analytics for Supply Chain Optimization
      Utilities in the electrical, natural gas, urban water, and telecommunications fields are all asset-intensive and reliant on physical infrastructure that must be properly maintained, updated, and upgraded over time. Maximizing asset uptime and the reliability of physical infrastructure demands effective inventory management, spare parts forecasting, and supplier management. A utility that executes these processes effectively will outperform its peers, provide better returns for its investors and higher service levels for its customers, while reducing its environmental impact. […]
    • Centering Act Spare Parts Timing Pricing and ReliabilityCentering Act: Spare Parts Timing, Pricing, and Reliability
      In this article, we'll walk you through the process of crafting a spare parts inventory plan that prioritizes availability metrics such as service levels and fill rates while ensuring cost efficiency. We'll focus on an approach to inventory planning called Service Level-Driven Inventory Optimization. Next, we'll discuss how to determine what parts you should include in your inventory and those that might not be necessary. Lastly, we'll explore ways to enhance your service-level-driven inventory plan consistently. […]

      Goldilocks Inventory Levels

      You may remember the story of Goldilocks from your long-ago youth. Sometimes the porridge was too hot, sometimes it was too cold, but just once it was just right. Now that we are adults, we can translate that fairy tale into a professional principle for inventory planning: There can be too little or too much inventory, and there is some Goldilocks level that is “just right.” This blog is about finding that sweet spot.

      To illustrate our supply chain fable, consider this example. Imagine that you sell service parts to keep your customers systems up and running. You offer a particular service part that costs you $100 to make but sells for a 20% markup. You can make $20 on each unit you sell, but you don’t get to keep the whole $20 because of the inventory operating costs you bear to be able to sell the part. There are holding costs to keep the part in good repair while in stock and ordering costs to replenish units you sell. Finally, sometimes you lose revenue from lost sales due to stockouts.  

      These operating costs can be directly related to the way you manage the part in inventory. For our example, assume you use a (Q,R) inventory policy, where Q is the replenishment order quantity and R is the reorder point. Assume further that the reason you are not making $30 per unit is that you have competitors, and customers will get the part from them if they can’t get it from you.

      Both your revenue and your costs depend in complex ways on your choices for Q and R. These will determine how much you order, when and therefore how often you order, how often you stock out and therefore how many sales you lose, and how much cash you tie up in inventory. It is impossible to cost out these relationships by guesswork, but modern software can make the relationships visible and calculate the dollar figures you need to guide your choice of values for Q and R. It does this by running detailed, fact-based, probabilistic simulations that predict costs and performance by averaging over a large number of realistic demand scenarios.  

      With these results in hand, you can work out the margin associated with (Q,R) values using the simple formula

      Margin = (Demand – Lost Sales) x Profit per unit sold – Ordering Costs – Holding Costs.

      In this formula, Lost Sales, Ordering Costs and Holding Costs are dependent on reorder point R and order quantity Q.

      Figure 1 shows the result of simulations that fixed Q at 25 units and varied R from 10 to 30 in steps of 5. While the curve is rather flat on top, you would make the most money by keeping on-hand inventory around 25 units (which corresponds to setting R = 20). More inventory, despite a higher service level and fewer lost sales, would make a little less money (and ties up a lot more cash), and less inventory would make a lot less.


      Margins vs Inventory Level Business

      Figure 1: Showing that there can be too little or too much inventory on hand


      Without relying on the inventory simulation software, we would not be able to discover

      • a) that it is possible to carry too little and too much inventory
      • b) what the best level of inventory is
      • c) how to get there by proper choices of reorder point R and order quantity Q.


      Without an explicit understanding of the above, companies will make daily inventory decisions relying on gut feel and averaging based rule of thumb methods. The tradeoffs described here are not exposed and the resulting mix of inventory yields a far lower return forfeiting hundreds of thousands to millions per year in lost profits.  So be like Goldilocks.  With the right systems and software tools, you too can get it just right!    


      Leave a Comment
      Related Posts
      Managing Spare Parts Inventory: Best Practices

      Managing Spare Parts Inventory: Best Practices

      In this blog, we’ll explore several effective strategies for managing spare parts inventory, emphasizing the importance of optimizing stock levels, maintaining service levels, and using smart tools to aid in decision-making. Managing spare parts inventory is a critical component for businesses that depend on equipment uptime and service reliability. Unlike regular inventory items, spare parts often have unpredictable demand patterns, making them more challenging to manage effectively. An efficient spare parts inventory management system helps prevent stockouts that can lead to operational downtime and costly delays while also avoiding overstocking that unnecessarily ties up capital and increases holding costs.

      12 Causes of Overstocking and Practical Solutions

      12 Causes of Overstocking and Practical Solutions

      Managing inventory effectively is critical for maintaining a healthy balance sheet and ensuring that resources are optimally allocated. Here is an in-depth exploration of the main causes of overstocking, their implications, and possible solutions.

      FAQ: Mastering Smart IP&O for Better Inventory Management.

      FAQ: Mastering Smart IP&O for Better Inventory Management.

      Effective supply chain and inventory management are essential for achieving operational efficiency and customer satisfaction. This blog provides clear and concise answers to some basic and other common questions from our Smart IP&O customers, offering practical insights to overcome typical challenges and enhance your inventory management practices. Focusing on these key areas, we help you transform complex inventory issues into strategic, manageable actions that reduce costs and improve overall performance with Smart IP&O.

      Probabilistic vs. Deterministic Order Planning

      The Smart Forecaster

      Man with a computer in a warehouse best practices in demand planning, forecasting and inventory optimization

      Consider the problem of replenishing inventory. To be specific, suppose the inventory item in question is a spare part. Both you and your supplier will want some sense of how much you will be ordering and when. And your ERP system may be insisting that you let it in on the secret too.

      Deterministic Model of Replenishment

      The simplest way to get a decent answer to this question is to assume the world is, well, simple. In this case, simple means “not random” or, in geek speak, “deterministic.” In particular, you pretend that the random size and timing of demand is really a continuous drip-drip-drip of a fixed size coming at a fixed interval, e.g., 2, 2, 2, 2, 2, 2… If this seems unrealistic, it is. Real demand might look more like this: 0, 1, 10, 0, 1, 0, 0, 0 with lots of zeros, occasional but random spikes.

      But simplicity has its virtues. If you pretend that the average demand occurs every day like clockwork, it is easy to work out when you will need to place your next order, and how many units you will need.  For instance, suppose your inventory policy is of the (Q,R) type, where Q is a fixed order quantity and R is a fixed reorder point. When stock drops to or below the reorder point R, you order Q units more. To round out the fantasy, assume that the replenishment lead time is also fixed: after L days, those Q new units will be on the shelf ready to satisfy demand.

      All you need now to answer your questions is the average demand per day D for the item. The logic goes like this:

      1. You start each replenishment cycle with Q units on hand.
      2. You deplete that stock by D units per day.
      3. So, you hit the reorder point R after (Q-R)/D days.
      4. So, you order every (Q-R)/D days.
      5. Each replenishment cycle lasts (Q-R)/D + L days, so you make a total of 365D/(Q-R+LD) orders per year.
      6. As long as lead time L < R/D, you will never stock out and your inventory will be as small as possible.

      Figure 1 shows the plot of on-hand inventory vs time for the deterministic model. Around Smart Software, we refer to this plot as the “Deterministic Sawtooth.” The stock starts at the level of the last order quantity Q. After steadily decreasing over the drop time (Q-R)/D, the level hits the reorder point R and triggers an order for another Q units. Over the lead time L, the stock drops to exactly zero, then the reorder magically arrives and the next cycle begins.

      Figure 1 Deterministic model of on-hand inventory

      Figure 1: Deterministic model of on-hand inventory


      This model has two things going for it. It requires no more than high school algebra, and it combines (almost) all the relevant factors to answer the two related questions: When will we have to place the next order? How many orders will we place in a year?

      Probabilistic Model of Replenishment

      Not surprisingly, if we strip away some of the fantasy from the deterministic model, we get more useful information. The probabilistic model incorporates all the messy randomness in the real-world problem: the uncertainty in both the timing and size of demand, the variation in replenishment lead time, and the consequences of those two factors: the chance of stock on hand undershooting the reorder point, the chance that there will be a stockout, the variability in the time until the next order, and the variable number of orders executed in a year.

      The probabilistic model works by simulating the consequences of uncertain demand and variable lead time. By analyzing the item’s historical demand patterns (and excluding any observations that were recorded during a time when demand may have been fundamentally different), advanced statistical methods create an unlimited number of realistic demand scenarios. Similar analysis is applied to records of supplier lead times. Combining these supply and demand scenarios with the operational rules of any given inventory control policy produces scenarios of the number of parts on hand. From these scenarios, we can extract summaries of the varying intervals between orders.

      Figure 2 shows an example of a probabilistic scenario; demand is random, and the item is managed using reorder point R = 10 and order quantity Q=20. Gone is the Deterministic Sawtooth; in its place is something more complex and realistic (the Probabilistic Staircase). During the 90 simulated days of operation, there were 9 orders placed, and the time between orders clearly varied.

      Using the probabilistic model, the answers to the two questions (how long between orders and how many in a year) get expressed as probability distributions reflecting the relative likelihoods of various scenarios. Figure 3 shows the distribution of the number of days between orders after ten years of simulated operation. While the average is about 8 days, the actual number varies widely, from 2 to 17.

      Instead of telling your supplier that you will place X orders next year, you can now project X ± Y orders, and your supplier knows better their upside and downside risks. Better yet, you could provide the entire distribution as the richest possible answer.

      Figure 2 A probabilistic scenario of on-hand inventory

      Figure 2 A probabilistic scenario of on-hand inventory


      Figure 3 Distribution of days between orders

      Figure 3: Distribution of days between orders


      Climbing the Random Staircase to Greater Efficiency

      Moving beyond the deterministic model of  inventory opens up new possibilities for optimizing operations. First, the probabilistic model allows realistic assessment of stockout risk. The simple model in Figure 1 implies there is never a stockout, whereas probabilistic scenarios allow for the possibility (though in Figure 2 there was only one close call around day 70). Once the risk is known, software can optimize by searching  the “design space” (i.e., all possible values of R and Q) to find a design that meets a target level of stockout risk at minimal cost. The value of the deterministic model in this more realistic analysis is that it provides a good starting point for the search through design space.

      Summary

      Modern software provides answers to operational questions with various degrees of detail. Using the example of the time between replenishment orders, we’ve shown that the answer can be calculated approximately but quickly by a simple deterministic model. But it can also be provided in much richer detail with all the variability exposed by a probabilistic model. We think of these alternatives as complementary. The deterministic model bundles all the key variables into an easy-to-understand form. The probabilistic model provides additional realism that professionals expect and supports effective search for optimal choices of reorder point and order quantity.


      Leave a Comment
      Related Posts
      Managing Spare Parts Inventory: Best Practices

      Managing Spare Parts Inventory: Best Practices

      In this blog, we’ll explore several effective strategies for managing spare parts inventory, emphasizing the importance of optimizing stock levels, maintaining service levels, and using smart tools to aid in decision-making. Managing spare parts inventory is a critical component for businesses that depend on equipment uptime and service reliability. Unlike regular inventory items, spare parts often have unpredictable demand patterns, making them more challenging to manage effectively. An efficient spare parts inventory management system helps prevent stockouts that can lead to operational downtime and costly delays while also avoiding overstocking that unnecessarily ties up capital and increases holding costs.

      12 Causes of Overstocking and Practical Solutions

      12 Causes of Overstocking and Practical Solutions

      Managing inventory effectively is critical for maintaining a healthy balance sheet and ensuring that resources are optimally allocated. Here is an in-depth exploration of the main causes of overstocking, their implications, and possible solutions.

      FAQ: Mastering Smart IP&O for Better Inventory Management.

      FAQ: Mastering Smart IP&O for Better Inventory Management.

      Effective supply chain and inventory management are essential for achieving operational efficiency and customer satisfaction. This blog provides clear and concise answers to some basic and other common questions from our Smart IP&O customers, offering practical insights to overcome typical challenges and enhance your inventory management practices. Focusing on these key areas, we help you transform complex inventory issues into strategic, manageable actions that reduce costs and improve overall performance with Smart IP&O.

      Increasing Revenue by Increasing Spare Part Availability

      The Smart Forecaster

       Pursuing best practices in demand planning,

      forecasting and inventory optimization

      Let’s start by recognizing that increased revenue is a good thing for you, and that increasing the availability of the spare parts you provide is a good thing for your customers.

      But let’s also recognize that increasing item availability will not necessarily lead to increased revenue. If you plan incorrectly and end up carrying excess inventory, the net effect may be good for your customers but will definitely be bad for you. There must be some right way to make this a win-win, if only it can be recognized.

      To make the right decision here, you have to think systematically about the problem. That requires that you use probabilistic models of the inventory control process.


      A Scenario

      Let’s consider a specific, realistic scenario. Quite a number of factors have an influence on the results:

      • The item: A specific low-volume spare part.
      • Demand mean: Averaging 0.1 units per day (so, highly “intermittent”)
      • Demand standard deviation: 0.35 units per day (so, highly variable or “overdispersed”).
      • Supplier average lead time: 5 days.
      • Unit cost: $100.
      • Holding cost per year as % of unit cost: 10%.
      • Ordering cost per PO cut: $25.
      • Stockout consequences: Lost sales (so, a competitive market, no backorders).
      • Shortage cost per lost sale: $100.
      • Service level target: 85% (so, 15% chance of a stockout in any replenishment cycle).
      • Inventory control policy: Periodic-review/Order-up-to (also called at (T,S) policy)


      Inventory Control Policy

      A word about the inventory control policy. The (T,S) policy is one of several that are common in practice. Though there are other more efficient policies (e.g., they don’t wait for T days to go by before making adjustment to stock), (T,S) is one of the simplest and so it is quite popular. It works this way: Every T days, you check how many units you have in stock, say X units. Then you order S-X units, which appear after the supplier lead time (in this case, 5 days). The T in (T,S) is the “order interval”, the number of days between orders; the S is the “order-up-to level”, the number of units you want to have on hand at the start of each replenishment cycle.

      To get the most out of this policy, you must wisely pick values of T and S. Picking wisely means you cannot win by guessing or using simple rule-of-thumb guides like “Keep an average of 3 x average demand on hand.”  Poor choices of T and S hurt both your customers and your bottom line. And sticking too long with choices that were once good can result in poor performance should any of the factors above change significantly, so the values of T and S should be recalculated now and then.

      The smart way to pick the right values of T and S is to use probabilistic models encoded in advanced software. Using software is essential when you have to scale up and pick values of T and S that are right for not one item but hundreds or thousands.


      Analysis of Scenario

      Let’s think about how to make money in this scenario. What’s the upside? If there were no expenses, this item could generate an average of $3,650 per year: 0.1 units/day x 365 days x $100/unit. Subtracted from that will be operating costs, comprised of holding, ordering and shortage costs. Each of those will depend on your choices of T and S.

      The software provides specific numbers: Setting T = 321 days and S = 40 units will result in average annual operating costs of $604, giving an expected margin of $3,650 – $604 = $3,046. See Table 1, left column. This use of software is called “predictive analytics” because it translates system design inputs into estimates of a key performance indicator, margin.

      Now think about whether you can do better. The service level target in this scenario is 85%, which is a somewhat relaxed standard that is not going to turn any heads. What if you could offer your customers a 99% service level? That sounds like a distinct competitive advantage, but would it reduce your margin? Not if you properly adjust the values of T and S.

      Setting T = 216 days and S = 35 units will reduce average annual operating costs to $551 and increase expected margin to $3,650 – $551 = $3,099. See Table 1, right column. Here is the win-win we wanted: higher customer satisfaction and roughly 2% more revenue. This use of the software is called “sensitivity analysis” because it shows how sensitive the margin is to the choice of service level target.

      Software can also help you visualize the complex, random dynamics of inventory movements. A by-product of the analysis that populated Table 1 are graphs showing the random paths taken by stock as it decreases over a replenishment cycle. Figure 1 shows a selection of 100 random scenarios for the scenario in which the service level target is 99%. In the figure, only 1 of the 100 scenarios resulted in a stockout, confirming the accuracy of the choice of order-up-to-level.


      Summary

      Management of spare parts inventories is often done haphazardly using gut instinct, habit, or obsolete rule-of-thumb. Winging it this way is not a reliable and reproducible path to higher margin or higher customer satisfaction. Probability theory, distilled into probability models then encoded in advanced software, is the basis for coherent, efficient guidance about how to manage spare parts based on facts: demand characteristics, lead times, service level targets, costs and the other factors. The scenarios analyzed here illustrate that it is possible to achieve both higher service levels and higher margin. A multitude of scenarios not shown here offer ways to achieve higher service levels but lose margin. Use the software.

      Scenarios with different service level targets

      Stock on hand during one replenishment cycle


      Leave a Comment

      Related Posts

      Make AI-Driven Inventory Optimization an Ally for Your Organization

      Make AI-Driven Inventory Optimization an Ally for Your Organization

      In this blog, we will explore how organizations can achieve exceptional efficiency and accuracy with AI-driven inventory optimization. Traditional inventory management methods often fall short due to their reactive nature and reliance on manual processes. Maintaining optimal inventory levels is fundamental for meeting customer demand while minimizing costs. The introduction of AI-driven inventory optimization can significantly reduce the burden of manual processes, providing relief to supply chain managers from tedious tasks.

      Daily Demand Scenarios

      Daily Demand Scenarios

      In this Videoblog, we will explain how time series forecasting has emerged as a pivotal tool, particularly at the daily level, which Smart Software has been pioneering since its inception over forty years ago. The evolution of business practices from annual to more refined temporal increments like monthly and now daily data analysis illustrates a significant shift in operational strategies.

      Constructive Play with Digital Twins

      Constructive Play with Digital Twins

      Those of you who track hot topics will be familiar with the term “digital twin.” Those who have been too busy with work may want to read on and catch up. While there are several definitions of digital twin, here’s one that works well: A digital twin is a dynamic virtual copy of a physical asset, process, system, or environment that looks like and behaves identically to its real-world counterpart. A digital twin ingests data and replicates processes so you can predict possible performance outcomes and issues that the real-world product might undergo.

      Recent Posts

      • Managing Spare Parts Inventory: Best PracticesManaging Spare Parts Inventory: Best Practices
        In this blog, we’ll explore several effective strategies for managing spare parts inventory, emphasizing the importance of optimizing stock levels, maintaining service levels, and using smart tools to aid in decision-making. Managing spare parts inventory is a critical component for businesses that depend on equipment uptime and service reliability. Unlike regular inventory items, spare parts often have unpredictable demand patterns, making them more challenging to manage effectively. An efficient spare parts inventory management system helps prevent stockouts that can lead to operational downtime and costly delays while also avoiding overstocking that unnecessarily ties up capital and increases holding costs. […]
      • 5 Ways to Improve Supply Chain Decision Speed5 Ways to Improve Supply Chain Decision Speed
        The promise of a digital supply chain has transformed how businesses operate. At its core, it can make rapid, data-driven decisions while ensuring quality and efficiency throughout operations. However, it's not just about having access to more data. Organizations need the right tools and platforms to turn that data into actionable insights. This is where decision-making becomes critical, especially in a landscape where new digital supply chain solutions and AI-driven platforms can support you in streamlining many processes within the decision matrix. […]
      • Two employees checking inventory in temporary storage in a distribution warehouse.12 Causes of Overstocking and Practical Solutions
        Managing inventory effectively is critical for maintaining a healthy balance sheet and ensuring that resources are optimally allocated. Here is an in-depth exploration of the main causes of overstocking, their implications, and possible solutions. […]
      • FAQ Mastering Smart IP&O for Better Inventory ManagementFAQ: Mastering Smart IP&O for Better Inventory Management.
        Effective supply chain and inventory management are essential for achieving operational efficiency and customer satisfaction. This blog provides clear and concise answers to some basic and other common questions from our Smart IP&O customers, offering practical insights to overcome typical challenges and enhance your inventory management practices. Focusing on these key areas, we help you transform complex inventory issues into strategic, manageable actions that reduce costs and improve overall performance with Smart IP&O. […]
      • 7 Key Demand Planning Trends Shaping the Future7 Key Demand Planning Trends Shaping the Future
        Demand planning goes beyond simply forecasting product needs; it's about ensuring your business meets customer demands with precision, efficiency, and cost-effectiveness. Latest demand planning technology addresses key challenges like forecast accuracy, inventory management, and market responsiveness. In this blog, we will introduce critical demand planning trends, including data-driven insights, probabilistic forecasting, consensus planning, predictive analytics, scenario modeling, real-time visibility, and multilevel forecasting. These trends will help you stay ahead of the curve, optimize your supply chain, reduce costs, and enhance customer satisfaction, positioning your business for long-term success. […]

        Inventory Optimization for Manufacturers, Distributors, and MRO

        • Managing Spare Parts Inventory: Best PracticesManaging Spare Parts Inventory: Best Practices
          In this blog, we’ll explore several effective strategies for managing spare parts inventory, emphasizing the importance of optimizing stock levels, maintaining service levels, and using smart tools to aid in decision-making. Managing spare parts inventory is a critical component for businesses that depend on equipment uptime and service reliability. Unlike regular inventory items, spare parts often have unpredictable demand patterns, making them more challenging to manage effectively. An efficient spare parts inventory management system helps prevent stockouts that can lead to operational downtime and costly delays while also avoiding overstocking that unnecessarily ties up capital and increases holding costs. […]
        • Innovating the OEM Aftermarket with AI-Driven Inventory Optimization XLInnovating the OEM Aftermarket with AI-Driven Inventory Optimization
          The aftermarket sector provides OEMs with a decisive advantage by offering a steady revenue stream and fostering customer loyalty through the reliable and timely delivery of service parts. However, managing inventory and forecasting demand in the aftermarket is fraught with challenges, including unpredictable demand patterns, vast product ranges, and the necessity for quick turnarounds. Traditional methods often fall short due to the complexity and variability of demand in the aftermarket. The latest technologies can analyze large datasets to predict future demand more accurately and optimize inventory levels, leading to better service and lower costs. […]
        • Future-Proofing Utilities. Advanced Analytics for Supply Chain OptimizationFuture-Proofing Utilities: Advanced Analytics for Supply Chain Optimization
          Utilities in the electrical, natural gas, urban water, and telecommunications fields are all asset-intensive and reliant on physical infrastructure that must be properly maintained, updated, and upgraded over time. Maximizing asset uptime and the reliability of physical infrastructure demands effective inventory management, spare parts forecasting, and supplier management. A utility that executes these processes effectively will outperform its peers, provide better returns for its investors and higher service levels for its customers, while reducing its environmental impact. […]
        • Centering Act Spare Parts Timing Pricing and ReliabilityCentering Act: Spare Parts Timing, Pricing, and Reliability
          In this article, we'll walk you through the process of crafting a spare parts inventory plan that prioritizes availability metrics such as service levels and fill rates while ensuring cost efficiency. We'll focus on an approach to inventory planning called Service Level-Driven Inventory Optimization. Next, we'll discuss how to determine what parts you should include in your inventory and those that might not be necessary. Lastly, we'll explore ways to enhance your service-level-driven inventory plan consistently. […]