Why Days of Supply Targets Don’t Work when Computing Safety Stocks

Why Days of Supply Targets Don’t Work when Computing Safety Stocks

CFOs tell us they need to spend less on inventory without impacting sales.  One way to do that is to move away from using targeted day of supply to determine reorder points and safety stock buffers.   Here is how a days of supply model works:

  1. Compute average demand per day and multiply the demand per day by supplier lead time in days to get lead time demand
  2. Pick a days of supply buffer (i.e., 15, 30, 45 days, etc.). Use larger buffers being used for more important items and smaller buffers for less important items.
  3. Add the desired days of supply buffer to demand over the lead time to get the reorder point. Order more when on hand inventory falls below the reorder point

Here is what is wrong with this approach:

  1. The average doesn’t account for seasonality and trend – you’ll miss obvious patterns unless you spend lots of time manually adjusting for it.
  2. The average doesn’t consider how predictable an item is – you’ll overstock predictable items and understock less predictable ones. This is because the same days of supply for different items yields a very different stock out risk.
  3. The average doesn’t tell a planner how stock out risk is impacted by the level of inventory – you’ll have no idea whether you are understocked, overstocked, or have just enough. You are essentially planning with blinders on.

There are many other “rule of thumb” approaches that are equally problematic.  You can learn more about them in this post

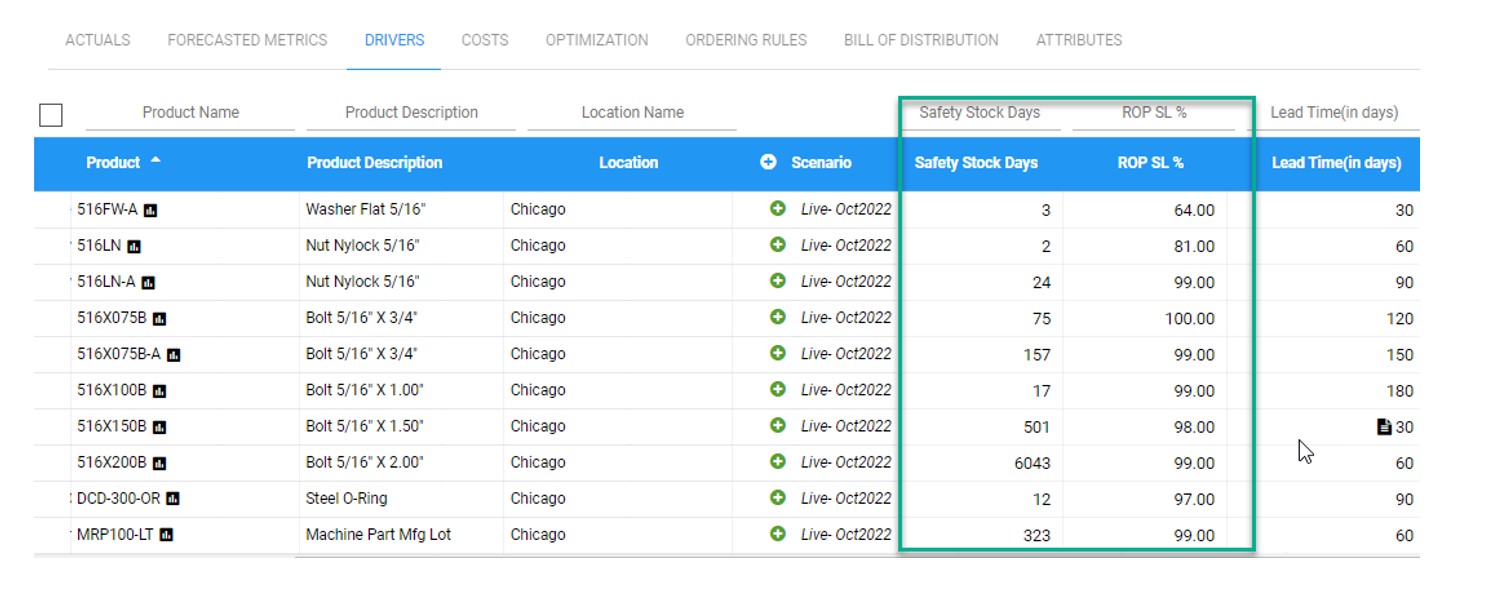
A better way to plan the right amount of safety stock is to leverage probability models that identify exactly how much stock is needed given the risk of stock-out you are willing to accept.   Below is a screenshot of Smart Inventory Optimization that does exactly that.  First, it details the predicted service levels (probability of not stocking out) associated with the current days of supply logic.  The planner can now see the parts where predicted service level is too low or too costly.  They can then make immediate corrections by targeting the desired service levels and level of inventory investment. Without this information, a planner isn’t going to know whether the targeted days of safety stock is too much, too little, or just right resulting in overstocks and shortages that cost market share and revenue. 

Computing Safety Stocks 2


5 Tips for Creating Smart Forecasts

In Smart Software’s forty-plus years of providing forecasting software, we’ve met many people who find themselves, perhaps surprisingly, becoming demand forecasters. This blog is aimed primarily at those fortunate individuals who are about to start this adventure (though seasoned pros may enjoy the refresher).

Welcome to the field! Good forecasting can make a big difference to your company’s performance, whether you are forecasting to support sales, marketing, production, inventory, or finance.

There is a lot of math and statistics underlying demand forecasting methods, so your assignment suggests that you are not one of those math-phobic people who would rather be poets. Luckily, if you are feeling a bit shaky and not yet healed from your high school geometry class, a lot of the math is built into forecasting software, so your first job is to leave the math for later while you get a view of the big picture. It is indeed a big picture, but let’s isolate few of the ideas that will most help you succeed.


  1. Demand Forecasting is a team sport. Even in a small company, the demand planner is part of a team, with some folks bringing the data, some bringing the tech, and some bringing the business judgment. In a well-run business, your job will never be to simply feed some data into a program and send out a forecast report. Many companies have adopted a process called Sales and Operations Planning (S&OP) in which your forecast will be used to kick off a meeting to make certain judgments (e.g., Should we assume this trend will continue? Will it be worse to under-forecast or over-forecast?) and to blend extra information into the final forecast (e.g., sales force input, business intelligence on competitors’ moves, promotions). The implication for you is that your skills at listening and communicating will be important to your success.


  1. Statistical Forecasting engines need good fuel. Historical data is the fuel used by statistical forecasting programs, so bad or missing or delayed data can degrade your work product. Your job will implicitly include a quality control aspect, and you must keep a keen eye on the data that are supplied to you. Along the way, it is a good idea to make the IT people your friends.


  1. Your name is on your forecasts. Like it or not, if I send forecasts up the chain of command, they get labeled as “Tom’s forecasts.” I must be prepared to own those numbers. To earn my seat at the table, I must be able to explain what data my forecasts were based on, how they were calculated, why I used Method A instead of Method B to do the calculations, and especially how firm or squishy they are. Here honesty is important. No forecast can reasonably be expected to be perfectly accurate, but not all managers can be expected to be perfectly reasonable. If you’re unlucky, your management will think that your reports of forecast uncertainty suggest either ignorance or incompetence. In truth, they indicate professionalism. I have no useful advice about how best to manage such managers, but I can warn you about them. It’s up to you to educate those who use your forecasts. The best managers will appreciate that.


  1. Leave your spreadsheets behind. It’s not uncommon for someone to be promoted to forecaster because they were great with Excel. Unless you are with an unusually small company, the scale of modern corporate forecasting overwhelms what you can handle with spreadsheets. The increasing speed of business compounds the problem: the sleepy tempo of annual and quarterly planning meetings is rapidly giving way to weekly or even daily re-forecasts as conditions change. So, be prepared to lean on a professional vendor of modern, scalable cloud-based demand planning and statistical forecasting software for training and support.


  1. Think visually. It will be very useful, both in deciding how to generate demand forecasts and in presenting them to management, so take advantage of the visualization capabilities built into forecasting software. As I noted above, in today’s high-frequency business world, the data you work with can change rapidly, so what you did last month may not be the right thing to do this month. Literally keep an eye on your data by making simple plots, like “timeplots” that show things like trend or seasonality or (especially) changes in trend or seasonality or anomalies that must be dealt with. Similarly, supplementing tables of forecasts with graphs comparing current forecasts to prior forecasts to actuals can be very helpful in an S&OP process. For example, timeplots showing past values, forecasted values, and “forecast intervals” indicating the objective uncertainty in the forecasts provide a solid basis for your team to fully appreciate the message in your forecasts.


That’s enough for now. As a person who’s taught in universities for half a century, I’m inclined to start into the statistical side of forecasting, but I’ll save that for another time. The five tips above should be helpful to you as you grow into a key part of your corporate planning team. Welcome to the game!


Supply Chain Math: Don’t Bring a Knife to a Gunfight

Whether you understand it in detail yourself or rely on trustworthy software, math is a fact of life for anyone in inventory management and demand forecasting who is hoping to remain competitive in the modern world.

At a conference recently, the lead presenter in an inventory management workshop proudly proclaimed that he had no need for “high-fallutin’ math”, which was explained to mean anything beyond sixth-grade math.

Math is not everyone’s first love. But if you really care about doing your job well, you can’t approach the work with a grade school mentality. Supply chain tasks like demand forecasting and inventory management are inherently mathematical. The blog associated with edX, a premier site for online college course material, has a great post on this topic, at https://www.mooc.org/blog/how-is-math-used-in-supply-chain. Let me quote the first bit:

Math and the supply chain go hand and hand. As supply chains grow, increasing complexity will drive companies to look for ways to manage large-scale decision-making. They can’t go back to how supply chains were 100 years ago—or even two years ago before the pandemic. Instead, new technologies will help streamline and manage the many moving parts. The logistics skills, optimization technologies, and organizational skills used in supply chain all require mathematics.

Our customers don’t need to be experts in supply chain math, they just need to be able to wield the software that contains the math. Software combines users’ experience and subject matter expertise to produce results that make the difference between success and failure. To do its job, the software can’t stop at sixth-grade math; it needs probability, statistics, and optimization theory.

It’s up to us software vendors to package the math in such a way that what goes into the calculations is all that is relevant, even if complicated; and that what comes out is clear, decision-relevant, and defensible when you must justify your recommendations to higher management.

Sixth-grade math can’t warn you when the way you propose to manage a critical spare part will mean a 70% chance of falling short of your item availability target. It can’t tell you how best to adjust your reorder points when a supplier calls and says, “We have a delivery problem.” It can’t save your skin when there is a surprisingly large order and you have to quickly figure out the best way to set up some expedited special orders without busting the operating budget.

So, respect the folk wisdom and don’t bring a knife to a gunfight.


Service Parts Planning: Planning for consumable parts vs. Repairable Parts

When deciding on the right stocking parameters for spare parts and service parts, it is important to distinguish between consumable and repairable service parts.  These differences are often overlooked by service parts planning software and can result in incorrect estimates of what to stock.  Different approaches are required when planning for consumables vs. repairable spare parts.

First, let’s define these two types of spare parts.

  • Consumable parts are spares contained within the equipment which are replaced rather than repaired when they fail. Examples of consumable parts include batteries, oil filters, screws, and brake pads.  Consumable spare parts tend to be lower-cost parts for which replacement is cheaper than repair or repair may not be possible.
  • Repairable parts are parts that are capable of being repaired and returned to service after failing due to causes like wear and tear, damage, or corrosion. Repairable service parts tend to be more expensive than consumable parts, so repair is usually preferable to replacement. Examples of repairable parts include traction motors in rail cars, jet engines, and copy machines.

Traditional spare parts planning software fail to do the job

Traditional parts planning software is not well-adapted to deal with the randomness in both the demand side and the supply side of MRO operations.

Demand-Side Randomness
Planning for consumable spare parts requires calculation of inventory control parameters (such as reorder points and order quantities, min and max levels, and safety stocks). Planning to manage repairable service parts requires calculation of the right number of spares. In both cases, the analysis must be based on probability models of the random usage of consumables or the random breakdown of repairable parts.  For over 90% of these parts, this random demand is “intermittent” (sometimes called “lumpy” or “anything but normally distributed”). Traditional spare parts forecasting methods were not developed to deal with intermittent demand. Relying on traditional methods leads to costly planning mistakes. For consumables, this means avoidable stockouts, excess carrying costs, and increased inventory obsolescence. For repairable parts, this means excessive equipment downtime and the attendant costs from unreliable performance and disruption of operations.

Supply-Side Randomness
Planning for consumable spare parts must take account of randomness in replenishment lead times from suppliers. Planning for repairable parts must account for randomness in repair and return processes, whether provided internally or contracted out. Planners managing these items often ignore exploitable company data. Instead, they may cross their fingers and hope everything works out, or they may call on gut instinct to “call audibles” and then hope everything works out.  Hoping and guessing cannot beat proper probability modeling. It wastes millions annually in unneeded capital investments and avoidable equipment downtime.

Spare Parts Planning Software solutions

Smart IP&O’s service parts forecasting software uses a unique empirical probabilistic forecasting approach that is engineered for intermittent demand. For consumable spare parts, our patented and APICS award winning method rapidly generates tens of thousands of demand scenarios without relying on the assumptions about the nature of demand distributions implicit in traditional forecasting methods. The result is highly accurate estimates of safety stock, reorder points, and service levels, which leads to higher service levels and lower inventory costs. For repairable spare parts, Smart’s Repair and Return Module accurately simulates the processes of part breakdown and repair. It predicts downtime, service levels, and inventory costs associated with the current rotating spare parts pool. Planners will know how many spares to stock to achieve short- and long-term service level requirements and, in operational settings, whether to wait for repairs to be completed and returned to service or to purchase additional service spares from suppliers, avoiding unnecessary buying and equipment downtime.

Contact us to learn more how this functionality has helped our customers in the MRO, Field Service, Utility, Mining, and Public Transportation sectors to optimize their inventory. You can also download the Whitepaper here.


White Paper: What you Need to know about Forecasting and Planning Service Parts


This paper describes Smart Software’s patented methodology for forecasting demand, safety stocks, and reorder points on items such as service parts and components with intermittent demand, and provides several examples of customer success.


    Four Common Mistakes when Planning Replenishment Targets

    Whether you are using ‘Min/Max’ or ‘reorder point’ and ‘order quantity’ to determine when and how much to restock, your approach might deliver or deny huge efficiencies. Key mistakes to avoid:


    1. Not recalibrating regularly
    2. Only reviewing Min/Max when there is a problem
    3. Using Forecasting methods not up to the task
    4. Assuming data is too slow moving or unpredictable for it to matter


    We have over 150,000 SKU x Location combinations. Our demand is intermittent. Since it’s slow moving, we don’t need to recalculate our reorder points often. We do so maybe once annually but review the reorder points whenever there is a problem.” – Materials Manager.


    This reactive approach will lead to millions in excess stock, stock outs, and lots of wasted time reviewing data when “something goes wrong.” Yet, I’ve heard this same refrain from so many inventory professionals over the years. Clearly, we need to do more to share why this thinking is so problematic.

    It is true that for many parts, a recalculation of the reorder points with up-to-date historical data and lead times might not change much, especially if patterns such as trend or seasonality aren’t present. However, many parts will benefit from a recalculation, especially if lead times or recent demand has changed. Plus, the likelihood of significant change that necessitates a recalculation increases the longer you wait. Finally, those months with zero demands also influence the probabilities and shouldn’t be ignored outright. The key point though is that it is impossible to know what will change or won’t change in your forecast, so it’s better to recalibrate regularly.


      Planning Replenishment Targets Software calculate

    This standout case from real world data illustrates a scenario where regular and automated recalibration shines—the benefits from quick responses to changing demand patterns like these add up quickly. In the above example, the X axis represents days, and the Y axis represents demand. If you were to wait several months between recalibrating your reorder points, you’d undoubtedly order far too soon. By recalibrating your reorder point far more often, you’ll catch the change in demand enabling much more accurate orders.


    Rather than wait until you have a problem, recalibrate all parts every planning cycle at least once monthly. Doing so takes advantage of the latest data and proactively adjusts the stocking policy, thus avoiding problems that would cause manual reviews and inventory shortages or excess.

    The nature of your (potentially varied) data also needs to be matched with the right forecasting tools. If records for some parts show trend or seasonal patterns, using targeting forecasting methods to accommodate these patterns can make a big difference. Similarly, if the data show frequent zero values (intermittent demand), forecasting methods not built around this special case can easily deliver unreliable results.

    Automate, recalibrate and review exceptions. Purpose built software will do this automatically. Think of it another way: is it better to dump a bunch of money into your 401K once per year or “dollar cost average” by depositing smaller, equally sized amounts throughout the year. Recalibrating policies regularly will yield maximized returns over time, just as dollar cost averaging will do for your investment portfolio.

    How often do you recalibrate your stocking policies? Why?