
MAX-MIN OR ROP – ROQ
by Philip Slater
This guest blog is authored by Philip Slater, Founder of SparePartsKNowHow.com the leading educational resource for spare parts management. Mr. Slater is a global leader and consultant in materials management and specifically, engineering spare parts inventory management and optimization. In 2012 Philip was honored with a national Leadership in Logistics Education Award. To view the original blog post, click here.
There are essentially two ways that companies express their inventory control settings: either as MAX- MIN (sometimes MIN-MAX) or ROP-ROQ.
Some people will say that it doesn’t really matter which you use, just as long as you understand the definitions and the pros and cons. However, in my experience it does matter and this is one aspect of spare parts inventory management that you really do need to get right.
Let’s Start With the Definitions for MIN, MAX, ROP & ROQ
MIN = short for minimum
There is, confusingly, two schools of thought about what is meant by the MIN. Most typically this is the point at which the need to order more stock is triggered. Sometimes, however, the MIN is seen as the minimum quantity that can be safely held to cover expected needs. In this case the need to order more stock is set so that the reorder point is one less than the MIN value. That is. MIN -1.
The key to managing when using a MIN setting is to understand the configuration of the computer system you use, as different definitions will change the resulting holding level, the re-order point, and perhaps even the actual safety or buffer stock.
MAX = short for maximum
This value is most typically the targeted maximum holdings of the item. Usually, in a MAX- MIN system, where the MIN is the reorder point, the quantity reordered after reaching the MIN is the quantity required to get back to the MAX. For example, if the MAX- MIN is 5-2, when the quantity in the storeroom reaches 2, procurement would need to order 3 to get back to the MAX.
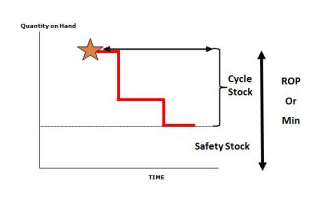
ROP = Reorder Point
As the name suggests, quite simply, this is the stock level at which the need to reorder is triggered. This is calculated by determining the safety stock level and the stock required to service needs during the reorder lead time.
ROQ = Reorder Quantity
Again, as the name suggest, this is the quantity to be reordered when the ROP is reached. This is not the EOQ but rather the quantity that both makes economic sense and is commercially available.
 The Differences are Meaningful and Important
It is essential that every inventory manager understands that the MAX- MIN and ROP-ROQ approaches are not simply interchangeable.
For example, in general terms:
MIN can be equated with the ROP, except if you have a system set up for reordering at a point of MIN-1. In that case, there is no equivalence.
For slow moving items the MAX can in some circumstances be equal to the ROP + ROQ. This is because for slow moving items it is possible that there will be no additional demand before the newly ordered item(s) arrive in stock.
However, with all other items the MAX is UNLIKELY to be equal to the ROP + ROQ as items may be issued between the time of reaching the MIN and the newly ordered items arriving. In fact, there is a logic that says that the MAX would never actually be achieved.
Do these differences matter? I think that they do.
For example, what if you change IT systems? If you move from one type of MAX-MIN system to another but they define the MIN differently then you cannot just migrate your data. This may not seem obvious if everyone is using the language of MAX-MIN but is classic trap where words are used in different ways.
Similarly, if you are benchmarking your holding levels with another company or site then you need to be aware of the different definitions and the outcomes that each approach would achieve. Otherwise you are comparing ‘apples with pears’.
Or what about what happens when a new team members arrives at your company and their previous company used the terms MAX-MIN but with different parameters or meaning to that your company uses. There will likely be an assumption that the terms are used in the same way and this could lead to stock shortages or overstocks, depending on the differences in the definitions.
To add further confusion, some software systems use the term ‘Safety Stock’ to represent the MIN holding level, despite this not being the universal definition of safety stock. This different nomenclature leads some people to assume that holding less than the so-called ‘safety stock’ according to your IT system is ‘unsafe’ or risky, when in fact it may not be at all. They may even be holding an excessive level of stock because they don’t properly apply the term ‘safety stock’. Calling it safety stock does not make it so.
Pros and Cons
MAX-MIN
Pros:
• Conceptually simple to understand.
Cons:
• Terms can be misleading in terms of safety stock and actual maximums.
• Terms are used in different ways and so caution required to ensure a common understanding.
• Values often set using ‘experience’ or intuition.
• Often leads to overstocking while reporting misleading overstock data
ROP-ROQ
Pros:
• Meaning of each term is clear and consistent.
• Values set using auditable logic.
• Safety stock values clearly established.
• Holdings more likely to reflect the actual needs and commercial constraints.
Cons:
• Requires more work to determine the appropriate values.
You Need to Get This Right
The differences between MAX-MIN and ROP-ROQ are not trivial and the terms certainly are not interchangeable. In my experience, the ROP-ROQ approach produces greater transparency and is easier to manage because there is no confusion about the meaning of the terms. This approach also produces a more appropriate and auditable level of inventory.
This suggests that if spare parts inventory management is important to you then you really do need to get this right.

Related Posts

Forecast-Based Inventory Management for Better Planning
Forecast-based inventory management, or MRP (Material Requirements Planning) logic, is a forward-planning method that helps businesses meet demand without overstocking or understocking. By anticipating demand and adjusting inventory levels, it maintains a balance between meeting customer needs and minimizing excess inventory costs. This approach optimizes operations, reduces waste, and enhances customer satisfaction.

Make AI-Driven Inventory Optimization an Ally for Your Organization
In this blog, we will explore how organizations can achieve exceptional efficiency and accuracy with AI-driven inventory optimization. Traditional inventory management methods often fall short due to their reactive nature and reliance on manual processes. Maintaining optimal inventory levels is fundamental for meeting customer demand while minimizing costs. The introduction of AI-driven inventory optimization can significantly reduce the burden of manual processes, providing relief to supply chain managers from tedious tasks.

The Importance of Clear Service Level Definitions in Inventory Management
Inventory optimization software that supports what-if analysis will expose the tradeoff of stockouts vs. excess costs of varying service level targets. But first it is important to identify how “service levels” is interpreted, measured, and reported. This will avoid miscommunication and the false sense of security that can develop when less stringent definitions are used. Clearly defining how service level is calculated puts all stakeholders on the same page. This facilitates better decision-making.
Recent Posts
 Forecast-Based Inventory Management for Better PlanningForecast-based inventory management, or MRP (Material Requirements Planning) logic, is a forward-planning method that helps businesses meet demand without overstocking or understocking. By anticipating demand and adjusting inventory levels, it maintains a balance between meeting customer needs and minimizing excess inventory costs. This approach optimizes operations, reduces waste, and enhances customer satisfaction. […]
 Make AI-Driven Inventory Optimization an Ally for Your OrganizationIn this blog, we will explore how organizations can achieve exceptional efficiency and accuracy with AI-driven inventory optimization. Traditional inventory management methods often fall short due to their reactive nature and reliance on manual processes. Maintaining optimal inventory levels is fundamental for meeting customer demand while minimizing costs. The introduction of AI-driven inventory optimization can significantly reduce the burden of manual processes, providing relief to supply chain managers from tedious tasks. […]
 The Importance of Clear Service Level Definitions in Inventory ManagementInventory optimization software that supports what-if analysis will expose the tradeoff of stockouts vs. excess costs of varying service level targets. But first it is important to identify how “service levels” is interpreted, measured, and reported. This will avoid miscommunication and the false sense of security that can develop when less stringent definitions are used. Clearly defining how service level is calculated puts all stakeholders on the same page. This facilitates better decision-making. […]
 Future-Proofing Utilities: Advanced Analytics for Supply Chain OptimizationUtilities in the electrical, natural gas, urban water, and telecommunications fields are all asset-intensive and reliant on physical infrastructure that must be properly maintained, updated, and upgraded over time. Maximizing asset uptime and the reliability of physical infrastructure demands effective inventory management, spare parts forecasting, and supplier management. A utility that executes these processes effectively will outperform its peers, provide better returns for its investors and higher service levels for its customers, while reducing its environmental impact. […]
 The Cost of Spreadsheet PlanningCompanies that depend on spreadsheets for demand planning, forecasting, and inventory management are often constrained by the spreadsheet’s inherent limitations. This post examines the drawbacks of traditional inventory management approaches caused by spreadsheets and their associated costs, contrasting these with the significant benefits gained from embracing state-of-the-art planning technologies. […]

Inventory Optimization for Manufacturers, Distributors, and MRO
- Future-Proofing Utilities: Advanced Analytics for Supply Chain OptimizationUtilities in the electrical, natural gas, urban water, and telecommunications fields are all asset-intensive and reliant on physical infrastructure that must be properly maintained, updated, and upgraded over time. Maximizing asset uptime and the reliability of physical infrastructure demands effective inventory management, spare parts forecasting, and supplier management. A utility that executes these processes effectively will outperform its peers, provide better returns for its investors and higher service levels for its customers, while reducing its environmental impact. […]
 Centering Act: Spare Parts Timing, Pricing, and ReliabilityIn this article, we'll walk you through the process of crafting a spare parts inventory plan that prioritizes availability metrics such as service levels and fill rates while ensuring cost efficiency. We'll focus on an approach to inventory planning called Service Level-Driven Inventory Optimization. Next, we'll discuss how to determine what parts you should include in your inventory and those that might not be necessary. Lastly, we'll explore ways to enhance your service-level-driven inventory plan consistently. […]
 Why MRO Businesses Need Add-on Service Parts Planning & Inventory SoftwareMRO organizations exist in a wide range of industries, including public transit, electrical utilities, wastewater, hydro power, aviation, and mining. To get their work done, MRO professionals use Enterprise Asset Management (EAM) and Enterprise Resource Planning (ERP) systems. These systems are designed to do a lot of jobs. Given their features, cost, and extensive implementation requirements, there is an assumption that EAM and ERP systems can do it all. In this post, we summarize the need for add-on software that addresses specialized analytics for inventory optimization, forecasting, and service parts planning. […]
 5 Steps to Improve the Financial Impact of Spare Parts PlanningIn today’s competitive business landscape, companies are constantly seeking ways to improve their operational efficiency and drive increased revenue. Optimizing service parts management is an often-overlooked aspect that can have a significant financial impact. Companies can improve overall efficiency and generate significant financial returns by effectively managing spare parts inventory. This article will explore the economic implications of optimized service parts management and how investing in Inventory Optimization and Demand Planning Software can provide a competitive advantage. […]