Why Inventory Planning Shouldn’t Rely Exclusively on Simple Rules of Thumb

For too many companies, a critical piece of data fact-finding ― the measurement of demand uncertainty ― is handled by simple but inaccurate rules of thumb.  For example, demand planners will often compute safety stock by a user-defined multiple of the forecast or historical average.  Or they may configure their ERP to order more when on hand inventory gets to 2 x the average demand over the lead time for important items and 1.5 x for less important ones. This is a huge mistake with costly consequences.

The choice of multiple ends up being a guessing game.  This is because no human being can compute exactly how much inventory to stock considering all the uncertainties.  Multiples of the average lead time demand are simple to use but you can never know whether the multiple used is too large or too small until it is too late.  And once you know, all the information has changed, so you must guess again and then wait and see how the latest guess turns out.  With each new day, you have new demand, new details on lead times, and the costs may have changed.  Yesterday’s guess, no more matter how educated is no longer relevant today.  Proper inventory planning should be void of inventory and forecast guesswork.  Decisions must be made with incomplete information but guessing is not the way to go.

Knowing how much to buffer requires a fact-based statistical analysis that can accurately answer questions such as:

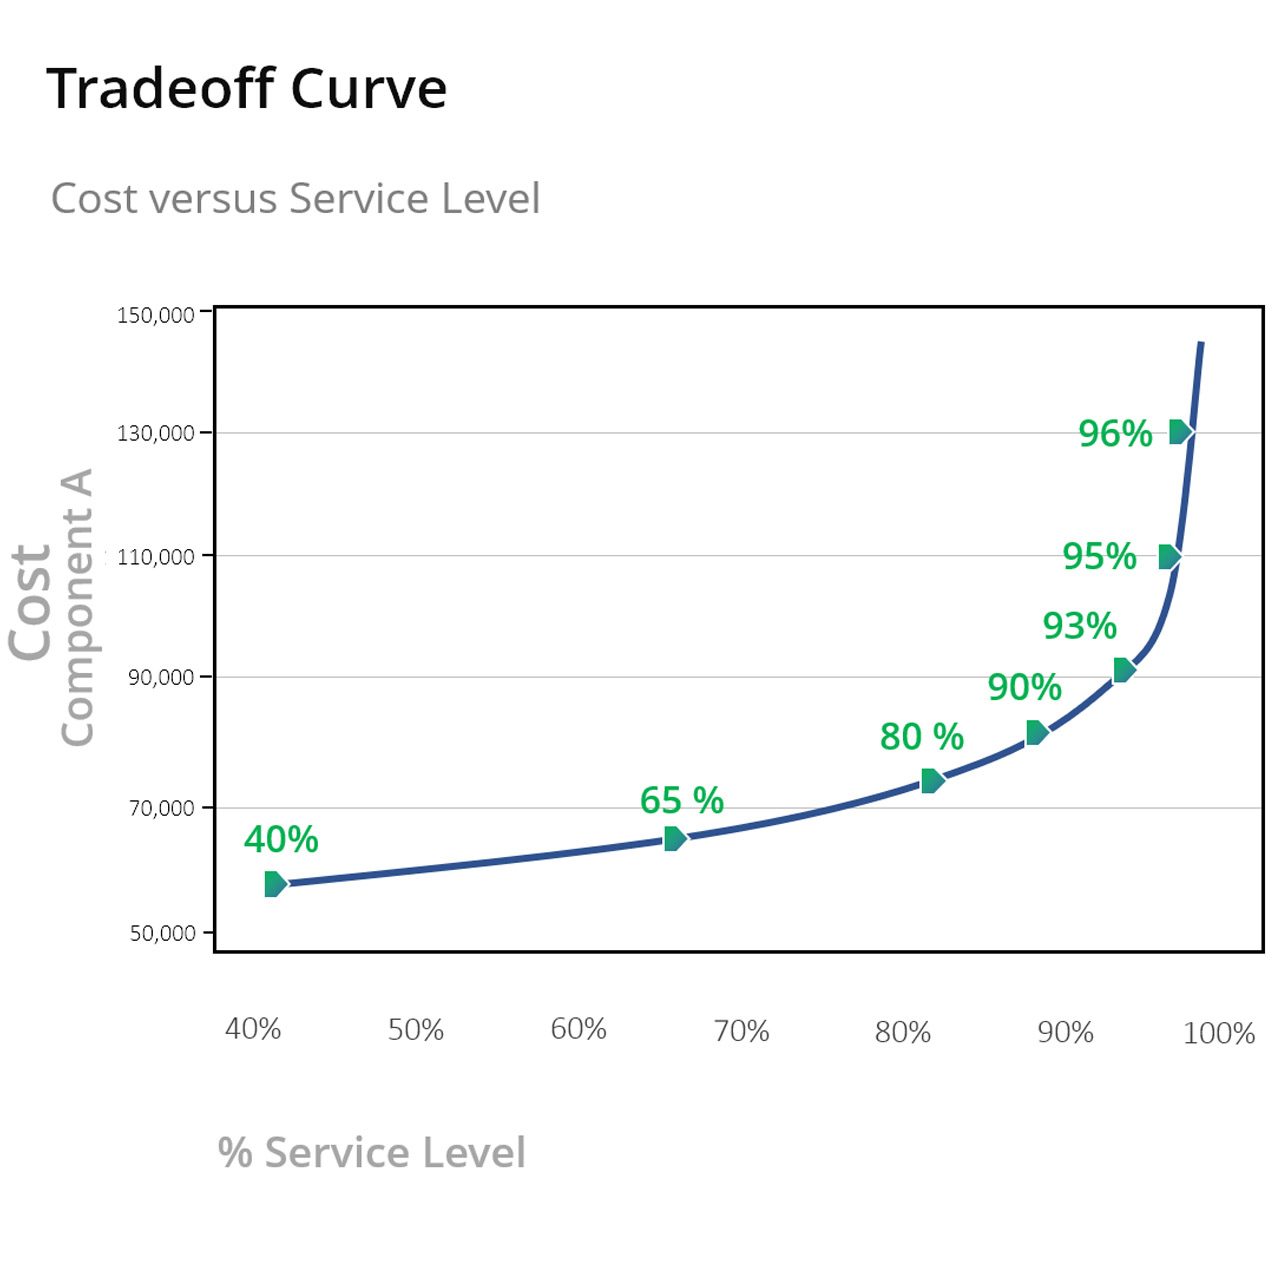
  • How much extra stock is needed to improve service levels by 5%
  • What the hit to on-time delivery will be if inventory is reduced by 5%
  • What service level target is most profitable.
  • How will the stockout risk be impacted by the random lead times we face.

Intuition can’t answer these questions, doesn’t scale across thousands of parts, and is often wrong.  Data, probability math and modern software are much more effective. Winging it is not the path to sustained excellence.


Direct to the Brain of the Boss – Inventory Analytics and Reporting

I’ll start with a confession: I’m an algorithm guy. My heart lives in the “engine room” of our software, where lightning-fast calculations zip back and forth across the AWS cloud, generating demand and supply scenarios used to guide important decisions about demand forecasting and inventory management.

But I recognize that the target of all that beautiful, furious calculation is the brain of the boss, the person responsible for making sure that customer demand is satisfied in the most efficient and profitable way. So, this blog is about Smart Operational Analytics (SOA), which creates reports for management. Or, as they are called in the military, sit-reps.

All the calculations guided by the planners using our software ultimately get distilled into the SOA reports for management. The reports focus on five areas: inventory analysis, inventory performance, inventory trending, supplier performance, and demand anomalies.

Inventory Analysis

These reports keep tabs on current inventory levels and identify areas that need improvement. The focus is on current inventory counts and their status (on hand, in transit, in quarantine), inventory turns, and excesses vs shortages.

Inventory Performance

These reports track Key Performance Indicators (KPIs) such as Fill Rates, Service Levels, and inventory Costs. The analytic calculations elsewhere in the software guide you toward achieving your KPI targets by calculating Key Performance Predictions (KPPs) based on recommended settings for, e.g., reorder points and order quantities. But sometimes surprises occur, or operating policies are not executed as recommended, so there will always be some slippage between KPPs and KPIs.

Inventory Trending

Knowing where things stand today is important, but seeing where things are trending is also valuable. These reports reveal trends in item demand, stockout events, average days on hand, average time to ship, and more.

Supplier Performance

Your company cannot perform at its best if your suppliers are dragging you down. These reports monitor supplier performance in terms of the accuracy and promptness of filling replenishment orders. Where you have multiple suppliers for the same item, they let you compare them.

Demand Anomalies

Your entire inventory system is demand driven, and all inventory control parameters are computed after modeling item demand. So if something odd is happening on the demand side, you must be vigilant and prepare to recalculate things like mins and maxes for items that are starting to act in odd ways.

Summary

The end point for all the massive calculations in our software is the dashboard showing management what’s going on, what’s next, and where to focus attention. Smart Inventory Analytics is the part of our software ecosystem aimed at your company’s C-Suite.

 Smart Reporting Studio Inventory Management Supply Software

Figure 1: Some sample reports in graphical form


You Need to Team up with the Algorithms

Over forty years ago, Smart Software consisted of three friends working to start a company in a church basement. Today, our team has expanded to operate from multiple locations across Massachusetts, New Hampshire and Texas, with team members in England, Spain, Armenia and India. Like many of you in your jobs,  we have found ways to make distributed teams work for us and for you.

This note is about a different kind of teamwork: the collaboration between you and our software that happens at your fingertips. I often write about the software itself and what goes on “under the hood”. This time, my subject is how you should best team up with the software.

Our software suite, Smart Inventory Planning and Optimization (Smart IP&O™) is capable of massively detailed calculations of future demand and the inventory control parameters (e.g., reorder points and order quantities) that would most effectively manage that demand. But your input is required to make the most of all that power. You need to team up with the algorithms.

That interaction can take several forms. You can start by simply assessing how you are doing now. The report writing functions in Smart IP&O (Smart Operational Analytics™) can collate and analyze all your transactional data to measure your Key Performance Indicators (KPIs), both financial (e.g., inventory investment) and operational (e.g., fill rates).

The next step might be to use SIO (Smart Inventory Optimization™), the inventory analytics within SIP&O, to play “what-if” games with the software. For example, you might ask “What if we reduced the order quantity on item 1234 from 50 to 40?” The software grinds the numbers to let you know how that would play out, then you react. This can be useful, but what if you have 50,000 items to consider? You would want to do what-if games for a few critical items, but not all of them.

The real power comes with using the automatic optimization capability in SIO. Here you can team with the algorithms at scale. Using your business judgement, you can create “groups”, i.e., collections of items that share some critical features. For example, you might create a group for “critical spare parts for electric utility customers” consisting of 1,200 parts. Then again calling on your business judgement, you could specify what item availability standard should apply to all the items in that group (e.g., “at least 95% chance of not stocking out in a year”). Now the software can take over and automatically work out the best reorder points and order quantities for every one of those items to achieve your required item availability at the lowest possible total cost. And that, dear reader, is powerful teamwork.


Rethinking forecast accuracy: A shift from accuracy to error metrics

Measuring the accuracy of forecasts is an undeniably important part of the demand planning process. This forecasting scorecard could be built based on one of two contrasting viewpoints for computing metrics. The error viewpoint asks, “how far was the forecast from the actual?” The accuracy viewpoint asks, “how close was the forecast to the actual?” Both are valid, but error metrics provide more information.

Accuracy is represented as a percentage between zero and 100, while error percentages start at zero but have no upper limit. Reports of MAPE (mean absolute percent error) or other error metrics can be titled “forecast accuracy” reports, which blurs the distinction.  So, you may want to know how to convert from the error viewpoint to the accuracy viewpoint that your company espouses.  This blog describes how with some examples.

Accuracy metrics are computed such that when the actual equals the forecast then the accuracy is 100% and when the forecast is either double or half of the actual, then accuracy is 0%. Reports that compare the forecast to the actual often include the following:

  • The Actual
  • The Forecast
  • Unit Error = Forecast – Actual
  • Absolute Error = Absolute Value of Unit Error
  • Absolute % Error = Abs Error / Actual, as a %
  • Accuracy % = 100% – Absolute % Error

Look at a couple examples that illustrate the difference in the approaches. Say the Actual = 8 and the forecast is 10.

Unit Error is 10 – 8 = 2

Absolute % Error = 2 / 8, as a % = 0.25 * 100 = 25%

Accuracy = 100% – 25% = 75%.

Now let’s say the actual is 8 and the forecast is 24.

Unit Error is 24– 8 = 16

Absolute % Error = 16 / 8 as a % = 2 * 100 = 200%

Accuracy = 100% – 200% = negative is set to 0%.

In the first example, accuracy measurements provide the same information as error measurements since the forecast and actual are already relatively close. But when the error is more than double the actual, accuracy measurements bottom out at zero. It does correctly indicate the forecast was not at all accurate. But the second example is more accurate than a third, where the actual is 8 and the forecast is 200. That’s a distinction a 0 to 100% range of accuracy doesn’t register. In this final example:

Unit Error is 200 – 8 = 192

Absolute % Error = 192 / 8, as a % = 24 * 100 = 2,400%

Accuracy = 100% – 2,400% = negative is set to 0%.

Error metrics continue to provide information on how far the forecast is from the actual and arguably better represent forecast accuracy.

We encourage adopting the error viewpoint. You simply hope for a small error percentage to indicate the forecast was not far from the actual, instead of hoping for a large accuracy percentage to indicate the forecast was close to the actual.  This shift in mindset offers the same insights while eliminating distortions.


Using Key Performance Predictions to Plan Stocking Policies

I can’t imagine being an inventory planner in spare parts, distribution, or manufacturing and having to create safety stock levels, reorder points, and order suggestions without using key performance predictions of service levels, fill rates, and inventory costs:

Using Key Performance Predictions to Plan Stocking Policies Iventory

Smart’s Inventory Optimization solution generates out-of-the-box key performance predictions that dynamically simulate how your current stocking policies will perform against possible future demands.  It reports on how often you’ll stock out, the size of the stockouts, the value of your inventory, holding costs, and more.  It lets you proactively identify problems before they occur so you can take corrective action in the short term. You can create what-if scenarios by setting targeted service levels and modifying lead times so you an see the predicted impact of these changes before committing to it.

For example,

  • You can see if a proposed move from the current service level of 90% to a targeted service level of 97% is financially advantageous
  • You can automatically identify if a different service level target is even more profitable to your business that the proposed target.
  • You can see exactly how much you’ll need to increase your reorder points to accommodate a longer lead time.


If you aren’t equipping planners with the right tools, they’ll be forced to set stocking policies, safety stock levels, and create demand forecasts in Excel or with outdated ERP functionality.   Not knowing how policies are predicted to perform will leave your company ill equipped to properly allocate inventory.  Contact us today to learn how we can help!