Effective supply chain and inventory management are essential for achieving operational efficiency and customer satisfaction. This blog provides clear and concise answers to some basic and other common questions from our Smart IP&O customers, offering practical insights to overcome typical challenges and enhance your inventory management practices. Focusing on these key areas, we help you transform complex inventory issues into strategic, manageable actions that reduce costs and improve overall performance with Smart IP&O.
1. What is lead time demand?
The demand is expected to occur over the replenishment lead time. Lead time demand is determined by Smart’s forecasting methods.
2. What is the Min, and how is it computed?
The Min is displayed in the drivers section of SIO is the reorder point and is the sum of the lead time demand and the safety stock. When on-hand inventory falls below the minimum due to demand, you will need to order more. Smart also has a “min” in the “ordering rules” field of SIO, which is the minimum order quantity you can place with a supplier.
3. What is the Max, and how is it computed?
The max is the largest quantity of inventory that will be on the shelf if you adhere to the ordering policy. The Max is the sum of the Min (reorder point) plus the defined OQ.
4. How do you determine the order quantity (OQ)?
The order quantity is initially imported from your ERP system. It can be changed based on a number of user defined choices, including:
Multiple lead time demand
Multiple monthly or weekly demand
Smart’s recommended OQ
5. What is the Economic Order Quantity?
It is the order quantity that will minimize the total costs, considering the cost of holding and costs of ordering inventory.
6. What is the “recommended OQ” that Smart computes?
It is the economic order quantity plus an adjustment if necessary to ensure that the size of the order is greater than or equal to the demand over lead time.
7. Why is the system predicting that we’ll have a low service level?
Smart predicts the service level that will result from the specified inventory policy (Min/Max or Reorder Point/Order Quantity), assuming adherence to that policy. When the predicted service level is low, it can mean that the expected demand over the lead time is greater than the reorder point (Min). When demand over the replenishment lead time is greater than the reorder point your probability of stocking out is higher resulting in a low service level. It may also be that your lead time for replenishment isn’t entered accurately. If the lead time entered is longer than reality, the reorder point may not cover the demand over the lead time. Please check your lead time inputs.
8. Why is the Service level showing as zero when the reorder point (or min) is not zero?
Smart predicts the service level that will result from the specified inventory policy (Min/Max or Reorder Point/Order Quantity), assuming adherence to that policy. When the predicted service level is low, it can mean that the expected demand over the lead time is greater than the reorder point (Min), sometimes many times greater, which would all but guarantee a stock-out. When demand over the replenishment lead time is greater than the reorder point your probability of stocking out is higher resulting in a low service level. It may also be that your lead time for replenishment isn’t entered accurately. If the lead time entered is longer than reality, the reorder point may not cover the demand over the lead time. Please check your lead time inputs.
9. But my actual service levels aren’t as low as Smart is predicting, why?
That may be true because Smart predicts your service level if you adhere to the policy. It is possible you aren’t adhering to the policy that the service level prediction is based on. If your on-hand inventory is higher than your Max quantity, you aren’t adhering to the policy. Check your input assumptions for lead time. Your actual lead times might be much shorter than entered resulting in a predicted service level that is lower than you expect.
10. Smart seems to be recommending too much inventory, or at least more than I’d expect it would; why?
You should consider evaluating the inputs, such as service level and lead times. Perhaps your actual lead times aren’t as long as the lead time Smart is using. We’ve seen situations where suppliers artificially inflate their quoted lead times to ensure they are always on time. If you use that lead time when computing your safety stocks, you’ll inevitably over-stock. So, review your actual lead time history (Smart provides the supplier performance report for this) to get a sense of the actual lead times and adjust accordingly. Or it is possible you are asking for a very high service level that may be further compounded with a very volatile item that has several significant spikes in demand. When demand significantly fluctuates from the mean, using a high service level target (98%+) will result in stocking policies that are designed to cover even very large spikes. Try a lower service level target or reducing the lead time (assuming the specified lead time is no longer realistic) and your inventory will decrease, sometimes very substantially.
11. Smart is using spikes in demand I don’t want it to consider, and it is inflating inventory, how can I correct this?
If you are sure that the spike won’t happen again, then you can remove it from the historical data via an override using Smart Demand Planner. You’ll need to open the forecast project containing that item, adjust the history, and save the adjusted history. You can contact tech support to help you set this up. If the spikes are part of the normal randomness that can sometimes occur, it’s best to leave it alone. Instead, consider a lower service level target. The lower target means the reorder points don’t need to cover the extreme values as often resulting in a lower inventory.
12. When I change the Order Quantity or Max, my cycle service levels don’t change, why?
Smart reports on “cycle service level” and “service level.” When you change your order quantities and Max quantities this will not impact the “cycle service level” because cycle service levels report on performance during the replenishment period only. This is because all that protects you from stockout after the order is placed (and you must wait until the order arrives for the replenishment) is the reorder point or Min. Changing the size of the order quantity or Max on hand (up to levels) won’t impact your cycle service levels. Cycle service level is influenced only by the size of the reorder points and the amount of safety stock being added whereas Smart’s “service level” will change when you modify both reorder points and order quantities.
13. My forecast looks inaccurate. It’s not showing any of the ups and downs observed in history, why?
A good forecast is the one number that is closest to the actual compared to other numbers that could have been predicted. When the historical ups and downs aren’t happening in predictable intervals then often, the best forecast is one that averages or smooths through those historical ups and downs. A forecast predicting future ups and downs that aren’t happening in obvious patterns historically is more likely to be less accurate than one that is forecast a straight or trend line only.
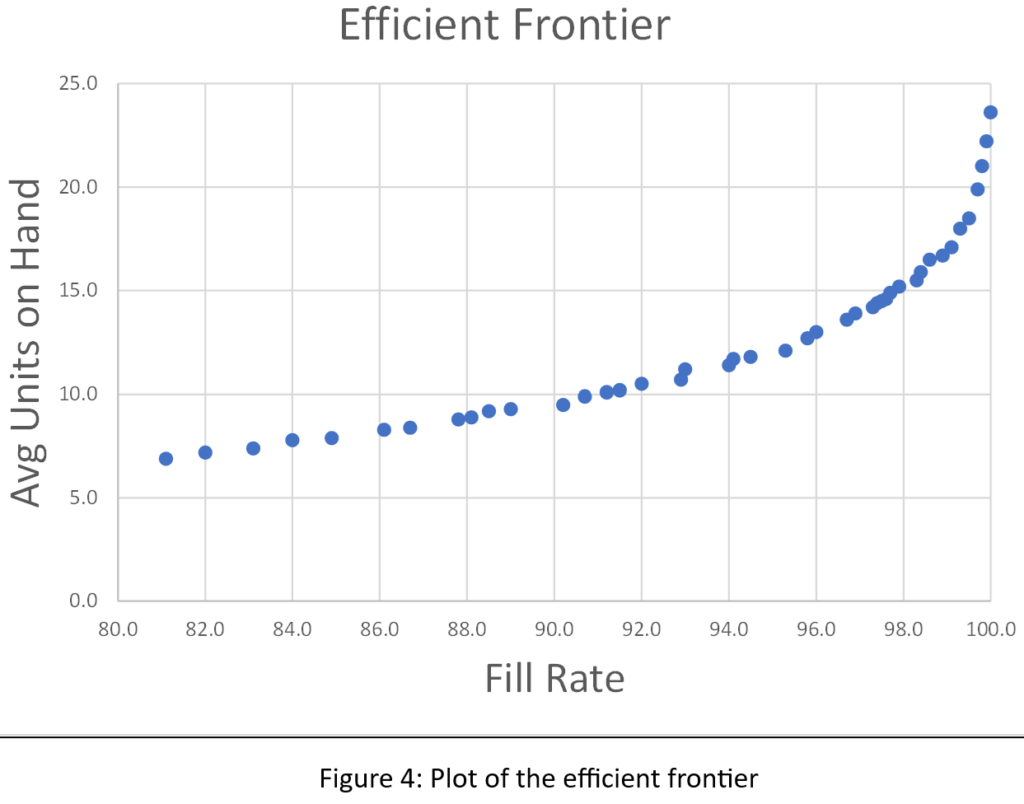
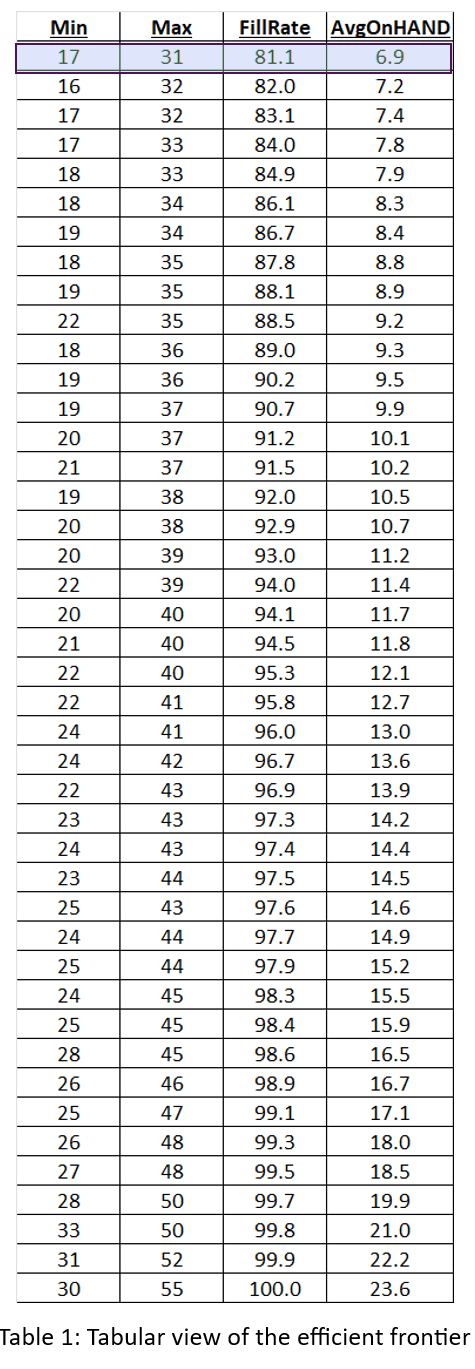
14. What is optimization? How does it work?
Optimization is an option for setting stocking policies where the software picks the stocking policy that yields the total lowest operating cost. For example, if an item is very expensive to hold, a policy that has more stockouts, but less inventory would yield total lower costs than a policy that had fewer stockouts and more inventory. On the other hand, if the item has a high stock out cost then a policy that yields fewer stockouts but requires more inventory would yield more financial benefit than a policy that had less inventory but more stockouts. When using the optimization feature, the user must specify the service level floor (the minimum service level). The software will then decide whether a higher service level will yield a better return. If it does, the reordering policies will target the higher service level. If it doesn’t the reordering policies will default to the user defined service level floor. This webinar provides details and explanations on the math behind optimization. https://www.screencast.com/t/3CfKJoMe2Uj
15. What is a what-if scenario?
What-if scenarios enable you to try out different user-defined choices of inventory policy and test the predicted impact on metrics such as service levels, fill rates, and inventory value. To explore these scenarios, click on the Drivers tab, either at the summary level or the “Items” level, and enter the desired adjustments. You can then recalculate to see how these changes would affect your overall inventory performance. This allows you to compare various strategies and select the most cost-effective and efficient approach for your supply chain.
By addressing common questions and challenges, we’ve provided actionable insights to help you improve your inventory management practices. With Smart IP&O, you have the tools you need to make informed inventory decisions, reduce costs, and enhance overall performance.