The Methods of Forecasting

​Demand planning and statistical forecasting software play a pivotal role in effective business management by incorporating features that significantly enhance forecasting accuracy. One key aspect involves the utilization of smoothing-based or extrapolative models, enabling businesses to quickly make predictions based solely on historical data. This foundation rooted in past performance is crucial for understanding trends and patterns, especially in variables like sales or product demand. Forecasting software goes beyond mere data analysis by allowing the blending of professional judgment with statistical forecasts, recognizing that forecasting is not a one-size-fits-all process. This flexibility enables businesses to incorporate human insights and industry knowledge into the forecasting model, ensuring a more nuanced and accurate prediction.

Features such as forecasting multiple items as a group, considering promotion-driven demand, and handling intermittent demand patterns are essential capabilities for businesses dealing with diverse product portfolios and dynamic market conditions.  Proper implementation of these applications empowers businesses with versatile forecasting tools, contributing significantly to informed decision-making and operational efficiency.

Extrapolative models

Our demand forecasting solutions support a variety of forecasting approaches including extrapolative or smoothing-based forecasting models, such as exponential smoothing and moving averages.  The philosophy behind these models is simple: they try to detect, quantify, and project into the future any repeating patterns in the historical data.

  There are two types of patterns that might be found in the historical data:

  • Trend
  • Seasonality

These patterns are illustrated in the following figure along with random data.

The Methods of Forecasting


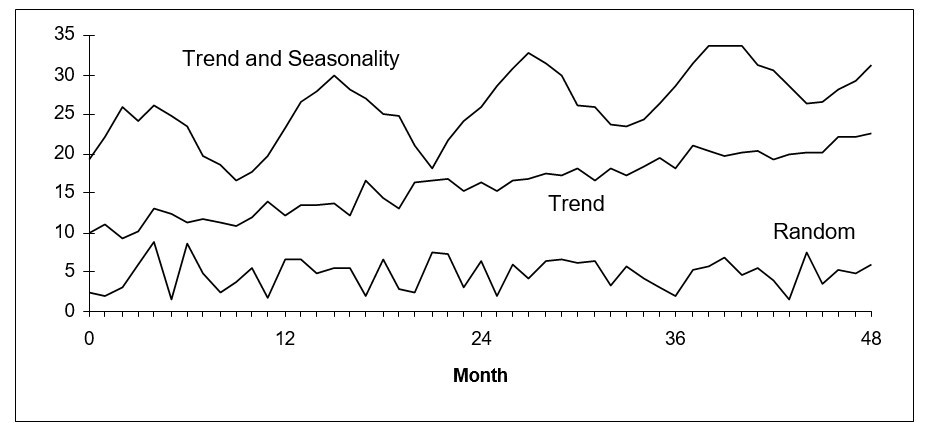
Illustrating trending, seasonal, and random time series data

If the pattern is a trend, then extrapolative models such as double exponential smoothing and linear moving average estimates the rate of increase or decrease in the level of the variable and project that rate into the future.

If the pattern is seasonality, then models such as Winters and triple exponential smoothing estimate either seasonal multipliers or seasonal add factors and then apply these to projections of the nonseasonal portion of the data.

Very often, especially with retail sales data, both trend and seasonal patterns are involved. If these patterns are stable, they can be exploited to give very accurate forecasts.

Sometimes, however, there are no obvious patterns, so that plots of the data look like random noise. Sometimes patterns are clearly visible, but they change over time and cannot be relied upon to repeat. In these cases, the extrapolative models don’t try to quantify and project patterns. Instead, they try to average through the noise and make good estimates of the middle of the distribution of data values. These typical values then become the forecasts.  Sometimes, when users see a historical plot with lots of ups and downs they are concerned when the forecast doesn’t replicate those ups and downs. Normally, this should not be a reason for concern.  This occurs when the historical patterns aren’t strong enough to warrant using a forecasting method that would replicate the pattern.  You want to make sure your forecasts don’t suffer from the “wiggle effect” that is described in this blog post.

Past as a predictor of the future

The key assumption implicit in extrapolative models is that the past is a good guide to the future. This assumption, however, can break down. Some of the historical data may be obsolete. For example, the data might describe a business environment that no longer exists. Or, the world that the model represents may be ready to change soon, rendering all the data obsolete. Because of such complicating factors, the risks of extrapolative forecasting are lower when forecasting only a short time into the future.

Extrapolative models have the practical advantage of being cheap and easy to build, maintain and use. They require only accurate records of past values of the variables you need to forecast. As time goes by, you simply add the latest data points to the time series and reforecast. In contrast, the causal models described below require more thinking and more data. The simplicity of extrapolative models is most appreciated when you have a massive forecasting problem, such as making overnight forecasts of demand for all 30,000 items in inventory in a warehouse.

Judgmental adjustments

Extrapolative models can be run in a fully automatic mode with Demand Planner with no intervention required. Causal models require substantive judgment for wise selection of independent variables. However, both types of statistical models can be enhanced by judgmental adjustments. Both can profit from your insights.

Both causal and extrapolative models are built on historical data. However, you may have additional information that is not reflected in the numbers found in the historical record. For instance, you may know that competitive conditions will soon change, perhaps due to price discounts, or industry trends, or the emergence of new competitors, or the announcement of a new generation of your own products. If these events occur during the period for which you are forecasting, they may well spoil the accuracy of purely statistical forecasts. Smart Demand Planner’ graphical adjustment feature lets you include these additional factors in your forecasts through the process of on- screen graphical adjustment.

Be aware that applying user adjustments to the forecast is a two-edged sword. Used appropriately, it can enhance forecast accuracy by exploiting a richer set of information. Used promiscuously, it can add additional noise to the process and reduce accuracy. We advise that you use judgmental adjustments sparingly, but that you never blindly accept the predictions of a purely statistical forecasting method.  It is also very important to measure forecast value add.  That is, the value added to the forecast process by each incremental step.  For example, if you are applying overrides based on business knowledge, it is important to measure whether those adjustments are adding value by improving forecast accuracy.  Smart Demand Planner supports measurement of forecast value add by tracking every forecast considered and automating the forecast accuracy reports. You can select statistical forecasts, measure their errors, and compare them to the overridden ones.  By doing so, you inform the forecasting process so that better decisions can be made in the future. 

Multiple-level forecasts

Another common situation involves multiple-level forecasting, where there are multiple items being forecast as a group or there may even be multiple groups, with each group containing multiple items. We will generally call this type of forecasting Multilevel Forecasting. The prime example is product line forecasting, where each item is a member of a family of items, and the total of all the items in the family is a meaningful quantity.

For example, as in the following figure, you might have a line of tractors and want forecasts of sales for each type of tractor and for the entire tractor line.

The Methods of Forecasting 2

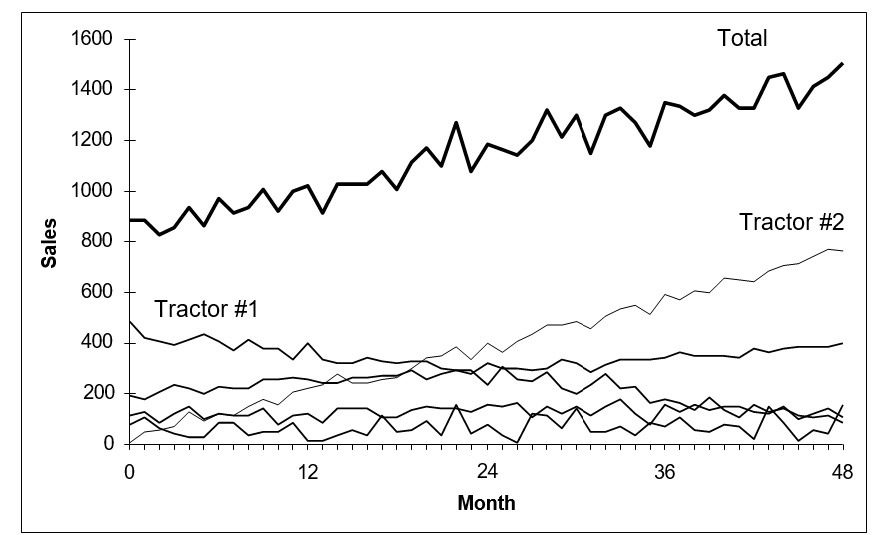
Illustrating multiple-level product forecasts

 Smart Demand Planner provides Roll Up/Roll Down Forecasting. This function is crucial for obtaining comprehensive forecasts of all product items and their group total. The Roll Down/Roll Up method within this feature offers two options for obtaining these forecasts:

Roll Up (Bottom-Up): This option initially forecasts each item individually and then aggregates the item-level forecasts to generate a family-level forecast.

Roll Down (Top-Down): Alternatively, the roll-down option starts by forming the historical total at the family level, forecasts it, and then proportionally allocates the total down to the item level.

When utilizing Roll Down/Roll Up, you have access to the full array of forecast methods provided by Smart Demand Planner at both the item and family levels. This ensures flexibility and accuracy in forecasting, catering to the specific needs of your business across different hierarchical levels.

Forecasting research has not established clear conditions favoring either the top-down or bottom-up approach to forecasting. However, the bottom-up approach seems preferable when item histories are stable, and the emphasis is on the trends and seasonal patterns of the individual items. Top-down is normally a better choice if some items have very noisy history or the emphasis is on forecasting at the group level. Since Smart Demand Planner makes it fast and easy to try both a bottom-up and a top- down approach, you should try both methods and compare the results.  You can use Smart Demand Planner’s “Hold back on Current”  feature in the “Forecast vs. Actual” to test both approaches on your own data and see which one yields a more accurate forecast for your business. 


Can Randomness be an Ally in the Forecasting Battle?

Feynman’s perspective illuminates our journey:  “In its efforts to learn as much as possible about nature, modern physics has found that certain things can never be “known” with certainty. Much of our knowledge must always remain uncertain. The most we can know is in terms of probabilities.” ― Richard Feynman, The Feynman Lectures on Physics.

When we try to understand the complex world of logistics, randomness plays a pivotal role. This introduces an interesting paradox: In a reality where precision and certainty are prized, could the unpredictable nature of supply and demand actually serve as a strategic ally?

The quest for accurate forecasts is not just an academic exercise; it’s a critical component of operational success across numerous industries. For demand planners who must anticipate product demand, the ramifications of getting it right—or wrong—are critical. Hence, recognizing and harnessing the power of randomness isn’t merely a theoretical exercise; it’s a necessity for resilience and adaptability in an ever-changing environment.

Embracing Uncertainty: Dynamic, Stochastic, and Monte Carlo Methods

Dynamic Modeling: The quest for absolute precision in forecasts ignores the intrinsic unpredictability of the world. Traditional forecasting methods, with their rigid frameworks, fall short in accommodating the dynamism of real-world phenomena. By embracing uncertainty, we can pivot towards more agile and dynamic models that incorporate randomness as a fundamental component. Unlike their rigid predecessors, these models are designed to evolve in response to new data, ensuring resilience and adaptability. This paradigm shift from a deterministic to a probabilistic approach enables organizations to navigate uncertainty with greater confidence, making informed decisions even in volatile environments.

Stochastic modeling guides forecasters through the fog of unpredictability with the principles of probability. Far from attempting to eliminate randomness, stochastic models embrace it. These models eschew the notion of a singular, predetermined future, presenting instead an array of possible outcomes, each with its estimated probability. This approach offers a more nuanced and realistic representation of the future, acknowledging the inherent variability of systems and processes. By mapping out a spectrum of potential futures, stochastic modeling equips decision-makers with a comprehensive understanding of uncertainty, enabling strategic planning that is both informed and flexible.

Named after the historical hub of chance and fortune, Monte Carlo simulations harness the power of randomness to explore the vast landscape of possible outcomes. This technique involves the generation of thousands, if not millions, of scenarios through random sampling, each scenario painting a different picture of the future based on the inherent uncertainties of the real world. Decision-makers, armed with insights from Monte Carlo simulations, can gauge the range of possible impacts of their decisions, making it an invaluable tool for risk assessment and strategic planning in uncertain environments.

Real-World Successes: Harnessing Randomness

The strategy of integrating randomness into forecasting has proven invaluable across diverse sectors. For instance, major investment firms and banks constantly rely on stochastic models to cope with the volatile behavior of the stock market. A notable example is how hedge funds employ these models to predict price movements and manage risk, leading to more strategic investment choices.

Similarly, in supply chain management, many companies rely on Monte Carlo simulations to tackle the unpredictability of demand, especially during peak seasons like the holidays. By simulating various scenarios, they can prepare for a range of outcomes, ensuring that they have adequate stock levels without overcommitting resources. This approach minimizes the risk of both stockouts and excess inventory.

These real-world successes highlight the value of integrating randomness into forecasting endeavors. Far from being the adversary it’s often perceived to be, randomness emerges as an indispensable ally in the intricate ballet of forecasting. By adopting methods that honor the inherent uncertainty of the future—bolstered by advanced tools like Smart IP&O—organizations can navigate the unpredictable with confidence and agility. Thus, in the grand scheme of forecasting, it may be wise to embrace the notion that while we cannot control the roll of the dice, we can certainly strategize around it.


The Forecasting Process for Decision-Makers

In almost every business and industry, decision-makers need reliable forecasts of critical variables, such as sales, revenues, product demand, inventory levels, market share, expenses, and industry trends.

Many kinds of people make these forecasts. Some are sophisticated technical analysts, such as business economists and statisticians. Many others regard forecasting as an important part of their overall work: general managers, production planners, inventory control specialists, financial analysts, strategic planners, market researchers, and product and sales managers. Still, others seldom think of themselves as forecasters but often have to make forecasts on an intuitive, judgmental basis.

Because of the way we designed Smart Demand Planner, it has something to offer all types of forecasters. This design grows out of several observations about the forecasting process. Because we designed Smart Demand Planner with these observations in mind, we believe it has a style and content uniquely suited for turning your browser into an effective forecasting and planning tool:

Forecasting is an art that requires a mix of professional judgment and objective, statistical analysis.

It is often effective to begin with an objective statistical forecast that automatically accounts for trends, seasonality, and other patterns.  Then, apply adjustments or forecast overrides based on your business judgment. Smart Demand Planner makes it easy to execute graphical and tabular adjustments to statistical forecasts.

The forecasting process is usually iterative.

You will likely decide to make several refinements of your initial forecast before you are satisfied. You may want to exclude older historical data that you find to no longer be relevant.  You could apply different weights to the forecast model that put varying emphases on the most recent data. You could apply trend dampening to increase or decrease aggressively trending statistical forecasts.  You could allow the Machine Learning models to fine-tune the forecast selection for you and select the winning model automatically.  Smart Demand Planner’s processing speed gives you plenty of time to make several passes and saves multiple versions of the forecasts as “snapshots” so you can compare forecast accuracy later.

Forecasting requires graphical support.

The patterns evident in data can be seen by a discerning eye. The credibility of your forecasts will often depend heavily on graphical comparisons other business stakeholders make when they assess the historical data and forecasts. Smart Demand Planner provides graphical displays of forecasts, history, and forecast vs. actuals reporting.

Forecasts are never exactly correct.

Because some error always creeps into even the best forecasting process, one of the most useful supplements to a forecast is an honest estimate of its margin of error.

Smart Demand Planner presents both graphical and tabular summaries of forecast accuracy based on the acid test of predicting data held back from development of the forecasting model. 

Forecast intervals or confidence intervals are also very useful.  They detail the likely range of possible demand that is expected to occur.  For example, if actual demand falls outside of the 90% confidence interval more than 10% of the time then there is reason to investigate further.  

Forecasting requires a match of method to data.

One of the major technical tasks in forecasting is to match the choice of forecasting technique to the nature of the data. Features of a data series like trend, seasonality or abrupt shifts in level suggest certain techniques instead of others.

Smart Demand Planner’ Automatic forecasting feature makes this match quickly, accurately and automatically.

Forecasting is often a part of a larger process of planning or control.

For example, forecasting can be a powerful complement to spreadsheet-based financial analysis, extending rows of figures off into the future. In addition, accurate sales and product demand forecasts are fundamental inputs to a manufacturer’s production planning and inventory control processes. An objective statistical forecast of future sales will always help identify when the budget (or sales plan) may be too unrealistic. Gap analysis enables the business to take corrective action to their demand and marketing plans to ensure they do not miss the budgeted plan.

Forecasts need to be integrated into ERP systems
Smart Demand Planner can quickly and easily transfer its results to other applications, such as spreadsheets, databases and planning systems including ERP applications.  Users are able to export forecasts in a variety of file formats either via download or to secure FTP file locations.  Smart Demand Planner includes API based integrations to a variety of ERP and EAM systems including Epicor Kinetic and Epicor Prophet 21, Sage X3 and Sage 300, Oracle NetSuite, and each of Microsoft’s Dynamics 365 ERP systems. API based integrations enable customers to push forecast results directly back to the ERP system on demand.

The result is more efficient sales planning, budgeting, production scheduling, ordering, and inventory planning.


The Objectives in Forecasting

A forecast is a prediction about the value of a time series variable at some time in the future. For instance, one might want to estimate next month’s sales or demand for a product item. A time series is a sequence of numbers recorded at equally spaced time intervals; for example, unit sales recorded every month.

The objectives you pursue when you forecast depend on the nature of your job and your business. Every forecast is uncertain; in fact, there is a range of possible values for any variable you forecast. Values near the middle of this range have a higher likelihood of actually occurring, while values at the extremes of the range are less likely to occur. The following figure illustrates a typical distribution of forecast values.

forecast distribution of forecast values

Illustrating a forecast distribution of forecast values


Point forecasts

The most common use of forecasts is to estimate a sequence of numbers representing the most likely future values of the variable of interest. For instance, suppose you are developing a sales and marketing plan for your company. You may need to fill in 12 cells in a financial spreadsheet with estimates of your company’s total revenues over the next 12 months. Such estimates are called point forecasts because you want a single number (data point) for each forecast period. Smart Demand Planner’ Automatic forecasting feature provides you with these point forecasts automatically.

Interval forecasts

Although point forecasts are convenient, you will often benefit more from interval forecasts. Interval forecasts show the most likely range (interval) of values that might arise in the future. These are usually more useful than point forecasts because they convey the amount of uncertainty or risk involved in a forecast. The forecast interval percentage can be specified in the various forecasting dialog boxes in the Demand Planning SoftwareEach of the many forecasting methods (automatic, moving average, exponential smoothing and so on) available in Smart Demand Planner allow you to set a forecast interval.

The default configuration in Smart Demand Planner provides 90% forecast intervals. Interpret these intervals as the range within which the actual values will fall 90% of the time. If the intervals are wide, then there is a great deal of uncertainty associated with the point forecasts. If the intervals are narrow, you can be more confident. If you are performing a planning function and want best case and worst case values for the variables of interest at several times in the future, you can use the upper and lower limits of the forecast intervals for that purpose, with the single point estimate providing the most likely value. In the previous figure, the 90% forecast interval extends from 3.36 to 6.64.

Upper percentiles

In inventory control, your goal may be to make good estimates of a high percentile of the demand for a product item. These estimates help you cope with the tradeoff between, on the one hand, minimizing the costs of holding and ordering stock, and, on the other hand, minimizing the number of lost or back-ordered sales due to a stock out. For this reason, you may wish to know the 99th percentile or service level of demand, since the chance of exceeding that level is only 1%.

When forecasting individual variables with features like Automatic forecasting, note that the upper limit of a 90% forecast interval represents the 95th percentile of the predicted distribution of the demand for that variable. (Subtracting the 5th percentile from the 95th percentile leaves an interval containing 95%-5% = 90% of the possible values.) This means you can estimate upper percentiles by changing the value of the forecast interval. In the figure, “Illustrating a forecast distribution”, the 95th percentile is 6.64.

To optimize stocking policies at the desired service level or to let the system recommend which stocking policy and service level generates the best return, consider using Smart Inventory Optimization.   It is designed to support what-if scenarios that show predicted tradeoffs of varying inventory polices including different service level targets.

Lower percentiles

Sometimes you may be concerned with the lower end of the predicted distribution for a variable. Such cases often arise in financial applications, where a low percentile of a revenue estimate represents a contingency requiring financial reserves. You can use Smart Demand Planner in this case in a way analogous to the case of forecasting upper percentiles. In the figure, “Illustrating a forecast distribution” , the 5th percentile is 3.36.

In conclusion, forecasting involves predicting future values, with point forecasts offering single estimates and interval forecasts providing likely value ranges. Smart Demand Planner automates point forecasts and allows users to set intervals, aiding in uncertainty assessment. For inventory control, the tool facilitates understanding upper (e.g., 99th percentile) and lower (e.g., 5th percentile) percentiles. To optimize stocking policies and service levels, Smart Inventory Optimization supports what-if scenarios, ensuring effective decision-making on how much to stock given the risk of stock out you are willing to accept.


Improve Forecast Accuracy by Managing Error

The Smart Forecaster

 Pursuing best practices in demand planning,

forecasting and inventory optimization

Improve Forecast Accuracy, Eliminate Excess Inventory, & Maximize Service Levels

In this video, Dr. Thomas Willemain, co-Founder and SVP Research, talks about improving Forecast Accuracy by Managing Error. This video is the first in our series on effective methods to Improve Forecast Accuracy.  We begin by looking at how forecast error causes pain and the consequential cost related to it. Then we will explain the three most common mistakes to avoid that can help us increase revenue and prevent excess inventory. Tom concludes by reviewing the methods to improve Forecast Accuracy, the importance of measuring forecast error, and the technological opportunities to improve it.


Forecast error can be consequential

Consider one item of many

  • Product X costs $100 to make and nets $50 profit per unit.
  • Sales of Product X will turn out to be 1,000/month over the next 12 months.
  • Consider one item of many

What is the cost of forecast error?

  • If the forecast is 10% high, end the year with $120,000 of excess inventory.
  • 100 extra/month x 12 months x $100/unit
  • If the forecast is 10% low, miss out on $60,000 of profit.
  • 100 too few/month x 12 months x $50/unit


Three mistakes to avoid

1. Ignoring error.

  • Unprofessional, dereliction of duty.
  • Wishing will not make it so.
  • Treat accuracy assessment as data science, not a blame game.

2. Tolerating more error than necessary.

  • Statistical forecasting methods can improve accuracy at scale.
  • Improving data inputs can help.
  • Collecting and analyzing forecast error metrics can identify weak spots.

3. Wasting time and money going too far trying to eliminate error.

  • Some product/market combinations are inherently more difficult to forecast. After a point, let them be (but be alert for new specialized forecasting methods).
  • Sometimes steps meant to reduce error can backfire (e.g., adjustment).
Leave a Comment

RECENT POSTS

Forecast-Based Inventory Management for Better Planning

Forecast-Based Inventory Management for Better Planning

Forecast-based inventory management, or MRP (Material Requirements Planning) logic, is a forward-planning method that helps businesses meet demand without overstocking or understocking. By anticipating demand and adjusting inventory levels, it maintains a balance between meeting customer needs and minimizing excess inventory costs. This approach optimizes operations, reduces waste, and enhances customer satisfaction.

Make AI-Driven Inventory Optimization an Ally for Your Organization

Make AI-Driven Inventory Optimization an Ally for Your Organization

In this blog, we will explore how organizations can achieve exceptional efficiency and accuracy with AI-driven inventory optimization. Traditional inventory management methods often fall short due to their reactive nature and reliance on manual processes. Maintaining optimal inventory levels is fundamental for meeting customer demand while minimizing costs. The introduction of AI-driven inventory optimization can significantly reduce the burden of manual processes, providing relief to supply chain managers from tedious tasks.

The Importance of Clear Service Level Definitions in Inventory Management

The Importance of Clear Service Level Definitions in Inventory Management

Inventory optimization software that supports what-if analysis will expose the tradeoff of stockouts vs. excess costs of varying service level targets. But first it is important to identify how “service levels” is interpreted, measured, and reported. This will avoid miscommunication and the false sense of security that can develop when less stringent definitions are used. Clearly defining how service level is calculated puts all stakeholders on the same page. This facilitates better decision-making.

Recent Posts

  • Forecast-Based Inventory Management for Better PlanningForecast-Based Inventory Management for Better Planning
    Forecast-based inventory management, or MRP (Material Requirements Planning) logic, is a forward-planning method that helps businesses meet demand without overstocking or understocking. By anticipating demand and adjusting inventory levels, it maintains a balance between meeting customer needs and minimizing excess inventory costs. This approach optimizes operations, reduces waste, and enhances customer satisfaction. […]
  • Make AI-Driven Inventory Optimization an Ally for Your OrganizationMake AI-Driven Inventory Optimization an Ally for Your Organization
    In this blog, we will explore how organizations can achieve exceptional efficiency and accuracy with AI-driven inventory optimization. Traditional inventory management methods often fall short due to their reactive nature and reliance on manual processes. Maintaining optimal inventory levels is fundamental for meeting customer demand while minimizing costs. The introduction of AI-driven inventory optimization can significantly reduce the burden of manual processes, providing relief to supply chain managers from tedious tasks. […]
  • The Importance of Clear Service Level Definitions in Inventory ManagementThe Importance of Clear Service Level Definitions in Inventory Management
    Inventory optimization software that supports what-if analysis will expose the tradeoff of stockouts vs. excess costs of varying service level targets. But first it is important to identify how “service levels” is interpreted, measured, and reported. This will avoid miscommunication and the false sense of security that can develop when less stringent definitions are used. Clearly defining how service level is calculated puts all stakeholders on the same page. This facilitates better decision-making. […]
  • Future-Proofing Utilities. Advanced Analytics for Supply Chain OptimizationFuture-Proofing Utilities: Advanced Analytics for Supply Chain Optimization
    Utilities in the electrical, natural gas, urban water, and telecommunications fields are all asset-intensive and reliant on physical infrastructure that must be properly maintained, updated, and upgraded over time. Maximizing asset uptime and the reliability of physical infrastructure demands effective inventory management, spare parts forecasting, and supplier management. A utility that executes these processes effectively will outperform its peers, provide better returns for its investors and higher service levels for its customers, while reducing its environmental impact. […]
  • The Cost of Doing nothing with your inventory Planning SystemsThe Cost of Spreadsheet Planning
    Companies that depend on spreadsheets for demand planning, forecasting, and inventory management are often constrained by the spreadsheet’s inherent limitations. This post examines the drawbacks of traditional inventory management approaches caused by spreadsheets and their associated costs, contrasting these with the significant benefits gained from embracing state-of-the-art planning technologies. […]

    Inventory Optimization for Manufacturers, Distributors, and MRO

    • Future-Proofing Utilities. Advanced Analytics for Supply Chain OptimizationFuture-Proofing Utilities: Advanced Analytics for Supply Chain Optimization
      Utilities in the electrical, natural gas, urban water, and telecommunications fields are all asset-intensive and reliant on physical infrastructure that must be properly maintained, updated, and upgraded over time. Maximizing asset uptime and the reliability of physical infrastructure demands effective inventory management, spare parts forecasting, and supplier management. A utility that executes these processes effectively will outperform its peers, provide better returns for its investors and higher service levels for its customers, while reducing its environmental impact. […]
    • Centering Act Spare Parts Timing Pricing and ReliabilityCentering Act: Spare Parts Timing, Pricing, and Reliability
      In this article, we'll walk you through the process of crafting a spare parts inventory plan that prioritizes availability metrics such as service levels and fill rates while ensuring cost efficiency. We'll focus on an approach to inventory planning called Service Level-Driven Inventory Optimization. Next, we'll discuss how to determine what parts you should include in your inventory and those that might not be necessary. Lastly, we'll explore ways to enhance your service-level-driven inventory plan consistently. […]
    • Why MRO Businesses Need Add-on Service Parts Planning & Inventory SoftwareWhy MRO Businesses Need Add-on Service Parts Planning & Inventory Software
      MRO organizations exist in a wide range of industries, including public transit, electrical utilities, wastewater, hydro power, aviation, and mining. To get their work done, MRO professionals use Enterprise Asset Management (EAM) and Enterprise Resource Planning (ERP) systems. These systems are designed to do a lot of jobs. Given their features, cost, and extensive implementation requirements, there is an assumption that EAM and ERP systems can do it all. In this post, we summarize the need for add-on software that addresses specialized analytics for inventory optimization, forecasting, and service parts planning. […]
    • 5 Steps to Improve the Financial Impact of Spare Parts Planning5 Steps to Improve the Financial Impact of Spare Parts Planning
      In today’s competitive business landscape, companies are constantly seeking ways to improve their operational efficiency and drive increased revenue. Optimizing service parts management is an often-overlooked aspect that can have a significant financial impact. Companies can improve overall efficiency and generate significant financial returns by effectively managing spare parts inventory. This article will explore the economic implications of optimized service parts management and how investing in Inventory Optimization and Demand Planning Software can provide a competitive advantage. […]