Smart Software VP of Research to Present at Business Analytics Conference, INFORMS 2022
Dr. Tom Willemain to lead INFORMS session “Dominating The Inventory Battlefield: Fighting Randomness With Randomness.”
Belmont, Mass., March 2022 – Smart Software, Inc., provider of industry-leading demand forecasting, planning, and inventory optimization solutions, today announced that Tom Willemain, Vice President for Research, will present at the INFORMS Business Analytics Conference, April 3-5, 2022, in Houston, TX.
Dr. Willemain will present a session on how next-generation analytics arms supply chain leaders in manufacturing, distribution, and MRO with tools to fight against randomness in demand and supply. During his session he will detail the following technologies:
(1) Regime change filtering to maintain data relevance against sudden shifts in the operating environment.
(2) Bootstrapping methods to generate large numbers of realistic demand and lead time scenarios to fuel models.
(3) Discrete event simulations to process the input scenarios and expose the links between management actions and key performance indicators.
(4) Stochastic optimization based on simulation experiments to tune each item for best results.
Without the analytics, inventory owners have two choices: sticking with rigid operating policies usually based on outdated and invalid rules of thumb or resorting to subjective, gut-feel guesswork that may not help and does not scale.
As the leading Business Analytics Conference, INFORMS provides the opportunity to interact with the world’s top forecasting researchers and practitioners. The attendance is large enough so that the best in the field are attracted, yet small enough that you can meet and discuss one-on-one. In addition, the conference features content from leading analytics professionals who share and showcase top analytics applications that save lives, save money, and solve problems.
About Dr. Thomas Willemain
Dr. Thomas Reed Willemain served as an Expert Statistical Consultant to the National Security Agency (NSA) at Ft. Meade, MD, and as a member of the Adjunct Research Staff at an affiliated think-tank, the Institute for Defense Analyses Center for Computing Sciences (IDA/CCS). He is Professor Emeritus of Industrial and Systems Engineering at Rensselaer Polytechnic Institute, having previously held faculty positions at Harvard’s Kennedy School of Government and Massachusetts Institute of Technology. He is also co-founder and Senior Vice President/Research at Smart Software, Inc. He is a member of the Association of Former Intelligence Officers, the Military Operations Research Society, the American Statistical Association, and several other professional organizations. Willemain received the BSE degree (summa cum laude, Phi Beta Kappa) from Princeton University and the MS and Ph.D. degrees from Massachusetts Institute of Technology. His other books include: Statistical Methods for Planners, Emergency Medical Systems Analysis (with R. C. Larson), and 80 articles in peer-reviewed journals on statistics, operations research, health care, and other topics. For more information, email: TomW@SmartCorp.com or visit www.TomWillemain.com.
About Smart Software, Inc.
Founded in 1981, Smart Software, Inc. is a leader in providing businesses with enterprise-wide demand forecasting, planning, and inventory optimization solutions. Smart Software’s demand forecasting and inventory optimization solutions have helped thousands of users worldwide, including customers at mid-market enterprises and Fortune 500 companies, such as Disney, Arizona Public Service, and Ameren. Smart Inventory Planning & Optimization gives demand planners the tools to handle sales seasonality, promotions, new and aging products, multi-dimensional hierarchies, and intermittently demanded service parts and capital goods items. It also provides inventory managers with accurate estimates of the optimal inventory and safety stock required to meet future orders and achieve desired service levels. Smart Software is headquartered in Belmont, Massachusetts, and can be found on the World Wide Web at www.smartcorp.com.
SmartForecasts and Smart IP&O have registered trademarks of Smart Software, Inc. All other trademarks are their respective owners’ property.
For more information, please contact Smart Software, Inc., Four Hill Road, Belmont, MA 02478.
Phone: 1-800-SMART-99 (800-762-7899); FAX: 1-617-489-2748; E-mail: info@smartcorp.com
Drive Operational Efficiency and Boost Operational Excellence
Smart Software is pleased to introduce our new series of educational webinars, offered exclusively for Epicor Users. Greg Hartunian, CEO at Smart Software, will lead 45-minute webinar focusing on specific approaches to demand forecasting and inventory planning that will enable you to increase profitability, improve service levels, and reduce inventory holding costs. The presentation will outline the challenges associated with traditional inventory planning and demand forecasting processes and how new probabilistic forecasting and optimization methods will make a big difference to your bottom line. Finally, the presentation will conclude by showing how to increase profitability with software-enhanced inventory planning processes in a Live Demo.
WEBINAR REGISTRATION FORM
Please register to attend the webinar. If you are interested but not cannot attend, please register anyway – we will record our session and will send you a link to the replay.
We hope you will be able to join us!
SmartForecasts and Smart IP&O are registered trademarks of Smart Software, Inc. All other trademarks are the property of their respective owners.
For more information, please contact Smart Software,Inc., Four Hill Road, Belmont, MA 02478.
Phone: 1-800-SMART-99 (800-762-7899); E-mail: info@smartcorp.com
January 2022: Maximize service levels and minimize inventory costs
Smart Software specializes in helping spares carrying operations companies optimize their inventory. For example, a leading Electric Utility customer implemented Smart IP&O in just 90 days and reduced inventory by $9,000,000 while maintaining service levels.
Our Smart IP&O platform includes a patented probabilistic forecasting core engineered specifically for intermittently demanded spare parts. Please join our webinar featuring Greg Hartunian, CEO of Smart Software, who will show how to plan optimal inventory levels and purchase quantities for thousands of items when demand is intermittent, constantly changing, or affected by unexpected events. This webinar is an excellent opportunity to learn how to reduce stock-outs and inventory costs by leveraging data-driven decisions that identify the financial trade-offs associated with changes in demand, lead times, service level targets, and costs.
WEBINAR REGISTRATION FORM
Please register to attend the webinar. If you are interested but not cannot attend, please register anyway – we will record our session and will send you a link to the replay.
We hope you will be able to join us!
SmartForecasts and Smart IP&O are registered trademarks of Smart Software, Inc. All other trademarks are the property of their respective owners.
For more information, please contact Smart Software,Inc., Four Hill Road, Belmont, MA 02478.
Phone: 1-800-SMART-99 (800-762-7899); E-mail: info@smartcorp.com
Increasing Revenue by Increasing Spare Part Availability
Let’s start by recognizing that increased revenue is a good thing for you, and that increasing the availability of the spare parts you provide is a good thing for your customers.
But let’s also recognize that increasing item availability will not necessarily lead to increased revenue. If you plan incorrectly and end up carrying excess inventory, the net effect may be good for your customers but will definitely be bad for you. There must be some right way to make this a win-win, if only it can be recognized.
To make the right decision here, you have to think systematically about the problem. That requires that you use probabilistic models of the inventory control process.
A Scenario
Let’s consider a specific, realistic scenario. Quite a number of factors have an influence on the results:
- The item: A specific low-volume spare part.
- Demand mean: Averaging 0.1 units per day (so, highly “intermittent”)
- Demand standard deviation: 0.35 units per day (so, highly variable or “overdispersed”).
- Supplier average lead time: 5 days.
- Unit cost: $100.
- Holding cost per year as % of unit cost: 10%.
- Ordering cost per PO cut: $25.
- Stockout consequences: Lost sales (so, a competitive market, no backorders).
- Shortage cost per lost sale: $100.
- Service level target: 85% (so, 15% chance of a stockout in any replenishment cycle).
- Inventory control policy: Periodic-review/Order-up-to (also called at (T,S) policy)
Inventory Control Policy
A word about the inventory control policy. The (T,S) policy is one of several that are common in practice. Though there are other more efficient policies (e.g., they don’t wait for T days to go by before making adjustment to stock), (T,S) is one of the simplest and so it is quite popular. It works this way: Every T days, you check how many units you have in stock, say X units. Then you order S-X units, which appear after the supplier lead time (in this case, 5 days). The T in (T,S) is the “order interval”, the number of days between orders; the S is the “order-up-to level”, the number of units you want to have on hand at the start of each replenishment cycle.
To get the most out of this policy, you must wisely pick values of T and S. Picking wisely means you cannot win by guessing or using simple rule-of-thumb guides like “Keep an average of 3 x average demand on hand.” Poor choices of T and S hurt both your customers and your bottom line. And sticking too long with choices that were once good can result in poor performance should any of the factors above change significantly, so the values of T and S should be recalculated now and then.
The smart way to pick the right values of T and S is to use probabilistic models encoded in advanced software. Using software is essential when you have to scale up and pick values of T and S that are right for not one item but hundreds or thousands.
Analysis of Scenario
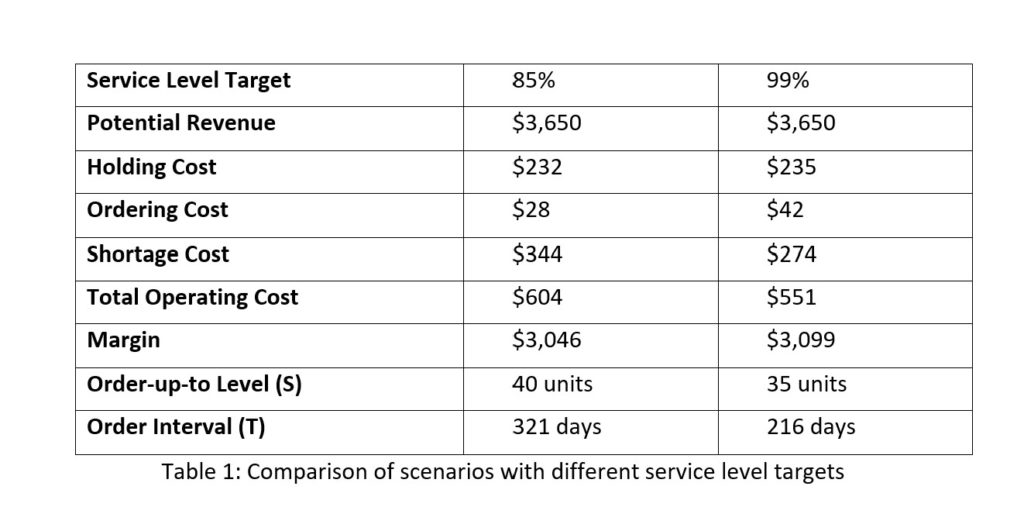
Let’s think about how to make money in this scenario. What’s the upside? If there were no expenses, this item could generate an average of $3,650 per year: 0.1 units/day x 365 days x $100/unit. Subtracted from that will be operating costs, comprised of holding, ordering and shortage costs. Each of those will depend on your choices of T and S.
The software provides specific numbers: Setting T = 321 days and S = 40 units will result in average annual operating costs of $604, giving an expected margin of $3,650 – $604 = $3,046. See Table 1, left column. This use of software is called “predictive analytics” because it translates system design inputs into estimates of a key performance indicator, margin.
Now think about whether you can do better. The service level target in this scenario is 85%, which is a somewhat relaxed standard that is not going to turn any heads. What if you could offer your customers a 99% service level? That sounds like a distinct competitive advantage, but would it reduce your margin? Not if you properly adjust the values of T and S.
Setting T = 216 days and S = 35 units will reduce average annual operating costs to $551 and increase expected margin to $3,650 – $551 = $3,099. See Table 1, right column. Here is the win-win we wanted: higher customer satisfaction and roughly 2% more revenue. This use of the software is called “sensitivity analysis” because it shows how sensitive the margin is to the choice of service level target.
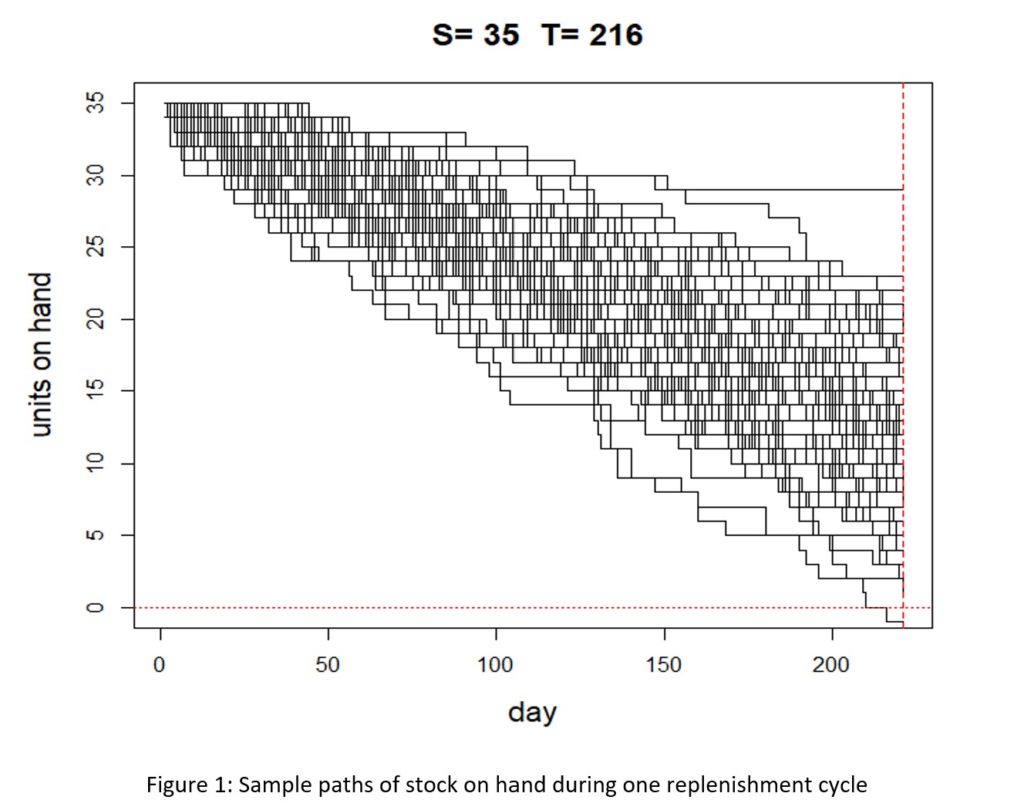
Software can also help you visualize the complex, random dynamics of inventory movements. A by-product of the analysis that populated Table 1 are graphs showing the random paths taken by stock as it decreases over a replenishment cycle. Figure 1 shows a selection of 100 random scenarios for the scenario in which the service level target is 99%. In the figure, only 1 of the 100 scenarios resulted in a stockout, confirming the accuracy of the choice of order-up-to-level.
Summary
Management of spare parts inventories is often done haphazardly using gut instinct, habit, or obsolete rule-of-thumb. Winging it this way is not a reliable and reproducible path to higher margin or higher customer satisfaction. Probability theory, distilled into probability models then encoded in advanced software, is the basis for coherent, efficient guidance about how to manage spare parts based on facts: demand characteristics, lead times, service level targets, costs and the other factors. The scenarios analyzed here illustrate that it is possible to achieve both higher service levels and higher margin. A multitude of scenarios not shown here offer ways to achieve higher service levels but lose margin. Use the software.


In this blog, we will explore how organizations can achieve exceptional efficiency and accuracy with AI-driven inventory optimization. Traditional inventory management methods often fall short due to their reactive nature and reliance on manual processes. Maintaining optimal inventory levels is fundamental for meeting customer demand while minimizing costs. The introduction of AI-driven inventory optimization can significantly reduce the burden of manual processes, providing relief to supply chain managers from tedious tasks.

In this Videoblog, we will explain how time series forecasting has emerged as a pivotal tool, particularly at the daily level, which Smart Software has been pioneering since its inception over forty years ago. The evolution of business practices from annual to more refined temporal increments like monthly and now daily data analysis illustrates a significant shift in operational strategies.

Those of you who track hot topics will be familiar with the term “digital twin.” Those who have been too busy with work may want to read on and catch up. While there are several definitions of digital twin, here’s one that works well: A digital twin is a dynamic virtual copy of a physical asset, process, system, or environment that looks like and behaves identically to its real-world counterpart. A digital twin ingests data and replicates processes so you can predict possible performance outcomes and issues that the real-world product might undergo.
Smart Software VP of Research to Present at Business Analytics Conference, INFORMS 2021
Dr. Tom Willemain to lead INFORMS session on Generation of Probabilistic Time-Series Scenarios
Belmont, Mass., March 2021 – Smart Software, Inc., provider of industry-leading demand forecasting, planning, and inventory optimization solutions, today announced that Tom Willemain, Vice President for Research, will present at the 2021 Virtual INFORMS Business Analytics Conference from April 12 – 14.
Dr. Willemain will present a session on Probabilistic Time-Series Scenarios, and how such scenarios are used, evaluated, and automatically generated using the statistical bootstrap. Frequently, OR models supporting business decisions are feed on massive numbers of probabilistic scenarios depicting future operating conditions. For example, with business operating at ever-lower levels of aggregation and ever-higher frequencies, demand planning and inventory optimization now use models fueled by scenarios representing the randomness of product demand at a daily scale. Dr. Willemain will discuss how even trivial decision tasks such as operator education benefit from large numbers of realistic training scenarios.
As the leading Business Analytics Conference, INFORMS provides the opportunity to interact with the world’s leading forecasting researchers and practitioners. The attendance is large enough so that the best in the field are attracted, yet small enough that you can meet and discuss one-on-one. The conference features content from leading analytics professionals, who share and showcase top analytics applications that save lives, save money, and solve problems.
Furthermore, to cutting-edge analytics content, the virtual analytics conference recognizes and prioritizes the need for quality “face-to-face” interactions, networking, and collaboration in a virtual setting.
About Dr. Thomas Willemain
Dr. Thomas Reed Willemain served as an Expert Statistical Consultant to the National Security Agency (NSA) at Ft. Meade, MD, and as a member of the Adjunct Research Staff at an affiliated think-tank, the Institute for Defense Analyses Center for Computing Sciences (IDA/CCS). He is Professor Emeritus of Industrial and Systems Engineering at Rensselaer Polytechnic Institute, having previously held faculty positions at Harvard’s Kennedy School of Government and Massachusetts Institute of Technology. He is also co-founder and Senior Vice President/Research at Smart Software, Inc. He is a member of the Association of Former Intelligence Officers, the Military Operations Research Society, the American Statistical Association, and several other professional organizations. Willemain received the BSE degree (summa cum laude, Phi Beta Kappa) from Princeton University and the MS and Ph.D. degrees from Massachusetts Institute of Technology. His other books include: Statistical Methods for Planners, Emergency Medical Systems Analysis (with R. C. Larson), and 80 articles in peer-reviewed journals on statistics, operations research, health care, and other topics. For more information, email: TomW@SmartCorp.com or visit www.TomWillemain.com.
About Smart Software, Inc.
Founded in 1981, Smart Software, Inc. is a leader in providing businesses with enterprise-wide demand forecasting, planning, and inventory optimization solutions. Smart Software’s demand forecasting and inventory optimization solutions have helped thousands of users worldwide, including customers at mid-market enterprises and Fortune 500 companies, such as Disney, Siemens, Metro Transit, APS, and The American Red Cross. Smart Inventory Planning & Optimization gives demand planners the tools to handle sales seasonality, promotions, new and aging products, multi-dimensional hierarchies, and intermittently demanded service parts and capital goods items. It also provides inventory managers with accurate estimates of the optimal inventory and safety stock required to meet future orders and achieve desired service levels. Smart Software is headquartered in Belmont, Massachusetts, and can be found on the World Wide Web at
www.smartcorp.com.
SmartForecasts and Smart IP&O have registered trademarks of Smart Software, Inc. All other trademarks are their respective owners’ property.
For more information, please contact Smart Software, Inc., Four Hill Road, Belmont, MA 02478.
Phone:
1-800-SMART-99 (800-762-7899); FAX: 1-617-489-2748; E-mail: info@smartcorp.com


