Increasing Revenue by Increasing Spare Part Availability

The Smart Forecaster

 Pursuing best practices in demand planning,

forecasting and inventory optimization

Let’s start by recognizing that increased revenue is a good thing for you, and that increasing the availability of the spare parts you provide is a good thing for your customers.

But let’s also recognize that increasing item availability will not necessarily lead to increased revenue. If you plan incorrectly and end up carrying excess inventory, the net effect may be good for your customers but will definitely be bad for you. There must be some right way to make this a win-win, if only it can be recognized.

To make the right decision here, you have to think systematically about the problem. That requires that you use probabilistic models of the inventory control process.


A Scenario

Let’s consider a specific, realistic scenario. Quite a number of factors have an influence on the results:

  • The item: A specific low-volume spare part.
  • Demand mean: Averaging 0.1 units per day (so, highly “intermittent”)
  • Demand standard deviation: 0.35 units per day (so, highly variable or “overdispersed”).
  • Supplier average lead time: 5 days.
  • Unit cost: $100.
  • Holding cost per year as % of unit cost: 10%.
  • Ordering cost per PO cut: $25.
  • Stockout consequences: Lost sales (so, a competitive market, no backorders).
  • Shortage cost per lost sale: $100.
  • Service level target: 85% (so, 15% chance of a stockout in any replenishment cycle).
  • Inventory control policy: Periodic-review/Order-up-to (also called at (T,S) policy)


Inventory Control Policy

A word about the inventory control policy. The (T,S) policy is one of several that are common in practice. Though there are other more efficient policies (e.g., they don’t wait for T days to go by before making adjustment to stock), (T,S) is one of the simplest and so it is quite popular. It works this way: Every T days, you check how many units you have in stock, say X units. Then you order S-X units, which appear after the supplier lead time (in this case, 5 days). The T in (T,S) is the “order interval”, the number of days between orders; the S is the “order-up-to level”, the number of units you want to have on hand at the start of each replenishment cycle.

To get the most out of this policy, you must wisely pick values of T and S. Picking wisely means you cannot win by guessing or using simple rule-of-thumb guides like “Keep an average of 3 x average demand on hand.”  Poor choices of T and S hurt both your customers and your bottom line. And sticking too long with choices that were once good can result in poor performance should any of the factors above change significantly, so the values of T and S should be recalculated now and then.

The smart way to pick the right values of T and S is to use probabilistic models encoded in advanced software. Using software is essential when you have to scale up and pick values of T and S that are right for not one item but hundreds or thousands.


Analysis of Scenario

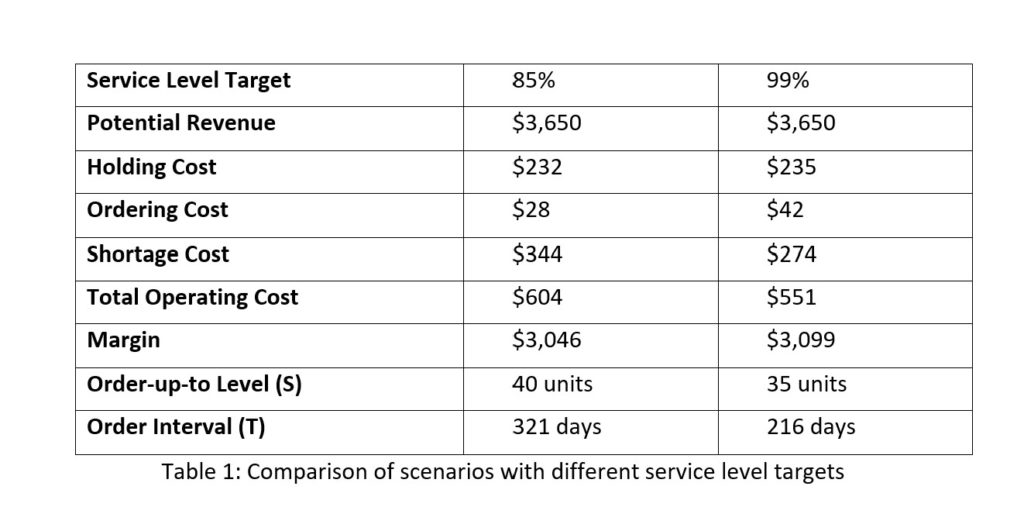
Let’s think about how to make money in this scenario. What’s the upside? If there were no expenses, this item could generate an average of $3,650 per year: 0.1 units/day x 365 days x $100/unit. Subtracted from that will be operating costs, comprised of holding, ordering and shortage costs. Each of those will depend on your choices of T and S.

The software provides specific numbers: Setting T = 321 days and S = 40 units will result in average annual operating costs of $604, giving an expected margin of $3,650 – $604 = $3,046. See Table 1, left column. This use of software is called “predictive analytics” because it translates system design inputs into estimates of a key performance indicator, margin.

Now think about whether you can do better. The service level target in this scenario is 85%, which is a somewhat relaxed standard that is not going to turn any heads. What if you could offer your customers a 99% service level? That sounds like a distinct competitive advantage, but would it reduce your margin? Not if you properly adjust the values of T and S.

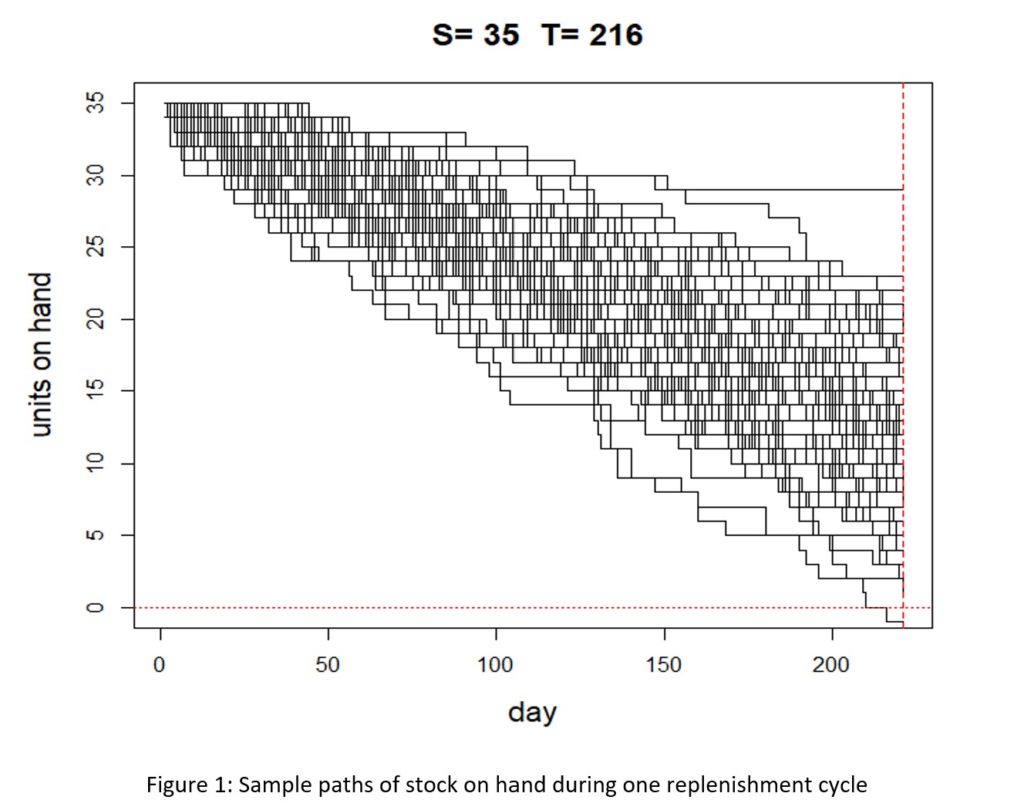
Setting T = 216 days and S = 35 units will reduce average annual operating costs to $551 and increase expected margin to $3,650 – $551 = $3,099. See Table 1, right column. Here is the win-win we wanted: higher customer satisfaction and roughly 2% more revenue. This use of the software is called “sensitivity analysis” because it shows how sensitive the margin is to the choice of service level target.

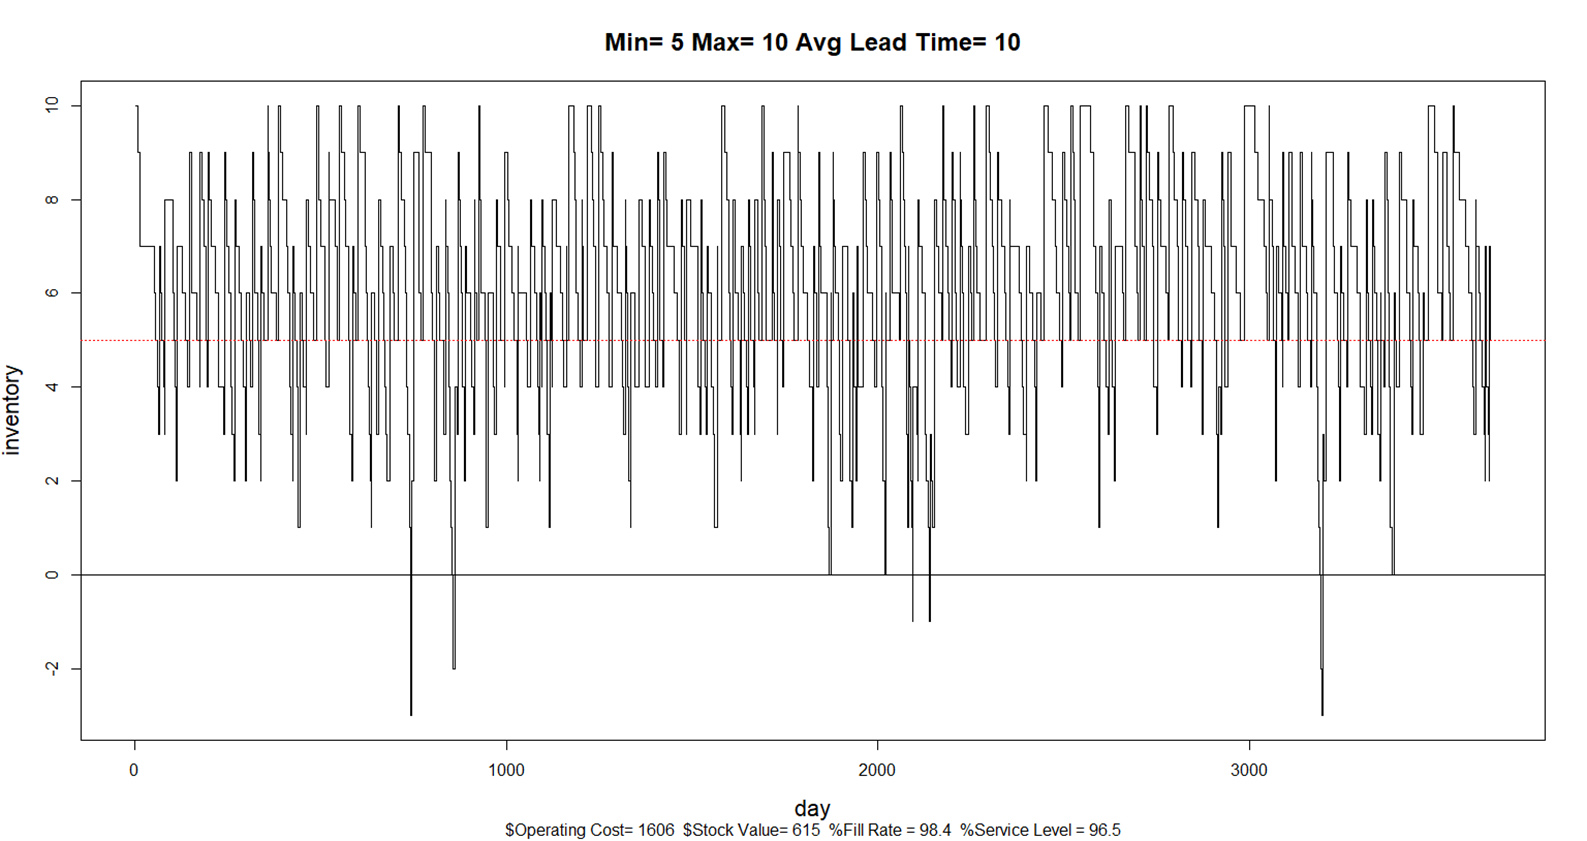
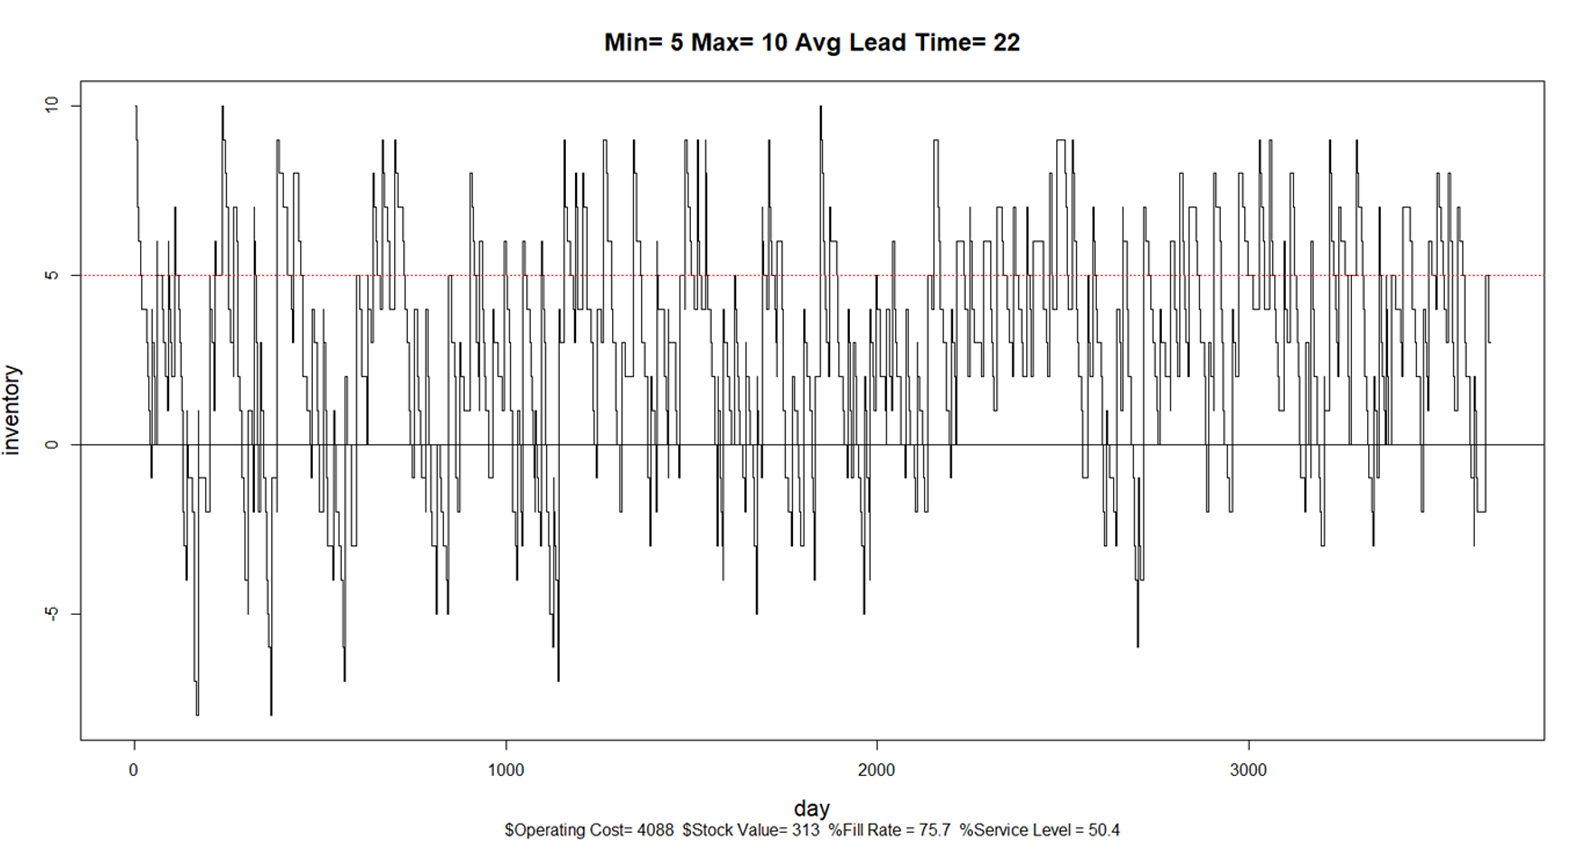
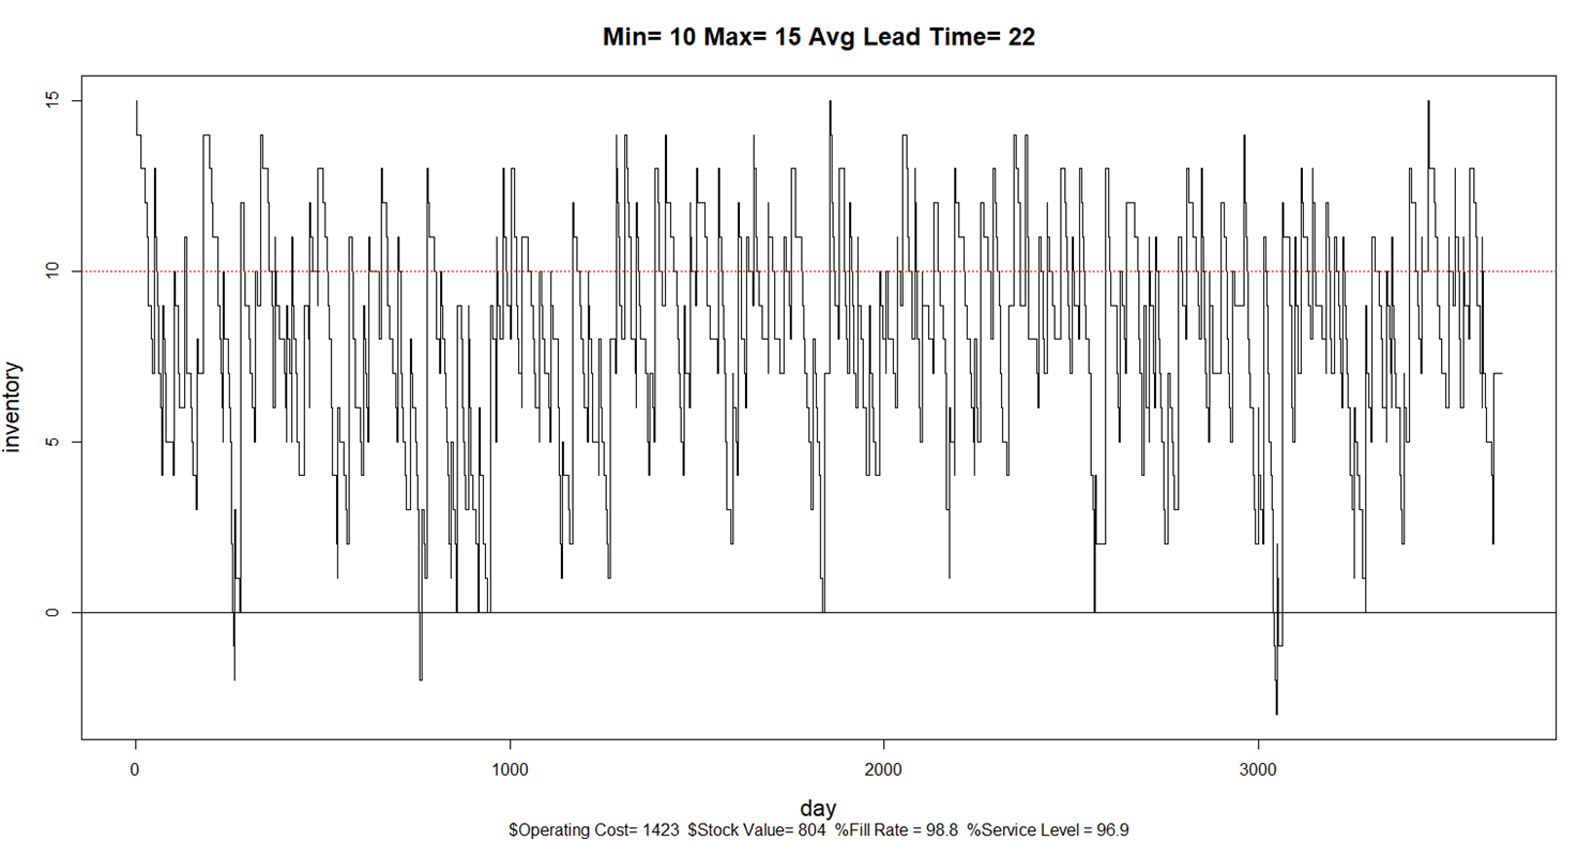
Software can also help you visualize the complex, random dynamics of inventory movements. A by-product of the analysis that populated Table 1 are graphs showing the random paths taken by stock as it decreases over a replenishment cycle. Figure 1 shows a selection of 100 random scenarios for the scenario in which the service level target is 99%. In the figure, only 1 of the 100 scenarios resulted in a stockout, confirming the accuracy of the choice of order-up-to-level.


Summary

Management of spare parts inventories is often done haphazardly using gut instinct, habit, or obsolete rule-of-thumb. Winging it this way is not a reliable and reproducible path to higher margin or higher customer satisfaction. Probability theory, distilled into probability models then encoded in advanced software, is the basis for coherent, efficient guidance about how to manage spare parts based on facts: demand characteristics, lead times, service level targets, costs and the other factors. The scenarios analyzed here illustrate that it is possible to achieve both higher service levels and higher margin. A multitude of scenarios not shown here offer ways to achieve higher service levels but lose margin. Use the software.

Scenarios with different service level targets

Stock on hand during one replenishment cycle


Leave a Comment

Related Posts

Constructive Play with Digital Twins

Constructive Play with Digital Twins

Those of you who track hot topics will be familiar with the term “digital twin.” Those who have been too busy with work may want to read on and catch up. While there are several definitions of digital twin, here’s one that works well: A digital twin is a dynamic virtual copy of a physical asset, process, system, or environment that looks like and behaves identically to its real-world counterpart. A digital twin ingests data and replicates processes so you can predict possible performance outcomes and issues that the real-world product might undergo.

Direct to the Brain of the Boss – Inventory Analytics and Reporting

Direct to the Brain of the Boss – Inventory Analytics and Reporting

In this blog, the spotlight is cast on the software that creates reports for management, the silent hero that translates the beauty of furious calculations into actionable reports. Watch as the calculations, intricately guided by planners utilizing our software, seamlessly converge into Smart Operational Analytics (SOA) reports, dividing five key areas: inventory analysis, inventory performance, inventory trending, supplier performance, and demand anomalies.

How Are We Doing? KPI’s and KPP’s

How Are We Doing? KPI’s and KPP’s

Dealing with the day-to-day of inventory management can keep you busy. But you know you have to get your head up now and then to see where you’re heading. For that, your inventory software should show you metrics – and not just one, but a full set of metrics or KPI’s – Key Performance Indicators.

Recent Posts

  • Looking for Trouble in Your Inventory DataLooking for Trouble in Your Inventory Data
    In this video blog, the spotlight is on a critical aspect of inventory management: the analysis and interpretation of inventory data. The focus is specifically on a dataset from a public transit agency detailing spare parts for buses. […]
  • BAF Case Study SIOP planning Distribution CenterBig Ass Fans Turns to Smart Software as Demand Heats Up
    Big Ass Fans is the best-selling big fan manufacturer in the world, delivering comfort to spaces where comfort seems impossible. BAF had a problem: how to reliably plan production to meet demand. BAF was experiencing a gap between bookings forecasts vs. shipments, and this was impacting revenue and customer satisfaction BAF turned to Smart Software for help. […]
  • The Cost of Doing nothing with your inventory Planning SystemsThe Cost of Spreadsheet Planning
    Companies that depend on spreadsheets for demand planning, forecasting, and inventory management are often constrained by the spreadsheet’s inherent limitations. This post examines the drawbacks of traditional inventory management approaches caused by spreadsheets and their associated costs, contrasting these with the significant benefits gained from embracing state-of-the-art planning technologies. […]
  • Randomness can be an Ally in the Forecasting BattleCan Randomness be an Ally in the Forecasting Battle?
    When we try to understand the complex world of logistics, randomness plays a pivotal role. This introduces an interesting paradox: In a reality where precision and certainty are prized, could the unpredictable nature of supply and demand actually serve as a strategic ally? The quest for accurate forecasts is not just an academic exercise; it's a critical component of operational success across numerous industries. For demand planners who must anticipate product demand, the ramifications of getting it right—or wrong—are critical. Hence, recognizing and harnessing the power of randomness isn't merely a theoretical exercise; it’s a necessity for resilience and adaptability in an ever-changing environment. […]
  • Finding Your Spot on the Inventory Tradeoff CurveFinding Your Spot on the Inventory Tradeoff Curve
    This video blog holds essential insights for those working with the complexities of inventory management. The session focuses on striking the right balance within the inventory tradeoff curve, inviting viewers to understand the deep-seated importance of this equilibrium. […]

    Inventory Optimization for Manufacturers, Distributors, and MRO

    • Why MRO Businesses Need Add-on Service Parts Planning & Inventory SoftwareWhy MRO Businesses Need Add-on Service Parts Planning & Inventory Software
      MRO organizations exist in a wide range of industries, including public transit, electrical utilities, wastewater, hydro power, aviation, and mining. To get their work done, MRO professionals use Enterprise Asset Management (EAM) and Enterprise Resource Planning (ERP) systems. These systems are designed to do a lot of jobs. Given their features, cost, and extensive implementation requirements, there is an assumption that EAM and ERP systems can do it all. In this post, we summarize the need for add-on software that addresses specialized analytics for inventory optimization, forecasting, and service parts planning. […]
    • Spare-parts-demand-forecasting-a-different-perspective-for-planning-service-partsThe Forecast Matters, but Maybe Not the Way You Think
      True or false: The forecast doesn't matter to spare parts inventory management. At first glance, this statement seems obviously false. After all, forecasts are crucial for planning stock levels, right? It depends on what you mean by a “forecast”. If you mean an old-school single-number forecast (“demand for item CX218b will be 3 units next week and 6 units the week after”), then no. If you broaden the meaning of forecast to include a probability distribution taking account of uncertainties in both demand and supply, then yes. […]
    • Whyt MRO Businesses Should Care about Excess InventoryWhy MRO Businesses Should Care About Excess Inventory
      Do MRO companies genuinely prioritize reducing excess spare parts inventory? From an organizational standpoint, our experience suggests not necessarily. Boardroom discussions typically revolve around expanding fleets, acquiring new customers, meeting service level agreements (SLAs), modernizing infrastructure, and maximizing uptime. In industries where assets supported by spare parts cost hundreds of millions or generate significant revenue (e.g., mining or oil & gas), the value of the inventory just doesn’t raise any eyebrows, and organizations tend to overlook massive amounts of excessive inventory. […]
    • Top Differences between Inventory Planning for Finished Goods and for MRO and Spare PartsTop Differences Between Inventory Planning for Finished Goods and for MRO and Spare Parts
      In today’s competitive business landscape, companies are constantly seeking ways to improve their operational efficiency and drive increased revenue. Optimizing service parts management is an often-overlooked aspect that can have a significant financial impact. Companies can improve overall efficiency and generate significant financial returns by effectively managing spare parts inventory. This article will explore the economic implications of optimized service parts management and how investing in Inventory Optimization and Demand Planning Software can provide a competitive advantage. […]

      Maximize Machine Uptime with Probabilistic Modeling

      The Smart Forecaster

       Pursuing best practices in demand planning,

      forecasting and inventory optimization

      Two Inventory Problems

      If you both make and sell things, you own two inventory problems. Companies that sell things must focus relentlessly on having enough product inventory to meet customer demand.  Manufacturers and asset intensive industries such as power generation, public transportation, mining, and refining, have an additional inventory concern:  having enough spare parts to keep their machines running. This technical brief reviews the basics of two probabilistic models of machine breakdown. It also relates machine uptime to the adequacy of spare parts inventory.


      Modeling the failure of a machine treated as a “black box”

      Just as product demand is inherently random, so is the timing of machine breakdowns. Likewise, just as probabilistic modeling is the right way to deal with random demand, it is also the right way to deal with random breakdowns.

      Models of machine breakdown have two components. The first deals with the random duration of uptime. The second deals with the random duration of downtime.

      The field of reliability theory offers several standard probability models describing the random time until failure of a machine without regard for the reason for the failure. The simplest model of uptime is the exponential distribution. This model says that the hazard rate, i.e., the chance of failing in the next instant of time, is constant no matter how long the system has been operating. The exponential model does a good job at modeling certain types of systems, especially electronics, but it is not universally applicable.


      Download the Whitepaper


      The next step up in model complexity is the Weibull model (pronounced “WHY-bull”). The Weibull distribution allows the risk of failure to change over time, either decreasing after a burn in period or, more often, increasing as wear and tear accumulate. The exponential distribution is a special case of the Weibull distribution in which the hazard rate is neither increasing nor decreasing.

      Weibull Reliability Plot

      Figure 1: Three different Weibull survival curves

      Figure 1 illustrates the Weibull model’s probability that a machine is still running as a function of how long it has been running. There are three curves corresponding to constant, decreasing and increasing hazard rates. For obvious reasons, these are called survival curves because they plot the probability of surviving for various amounts of time (but they are also called reliability curves). The black curve that starts high and sinks fast (β=3) depicts a machine that wears out with age. The lightest curve in the middle fast (β=1) shows the exponential distribution. The medium-dark curve (β=0.5)  is one that has a high early hazard rate but gets better with age.

      Of course, there is another phenomenon that needs to be included in the analysis: downtime. Modeling downtime is where inventory theory enters the picture. Downtime is modeled by a mixture of two different distributions. If a spare part is available to replace the failed part, then the downtime can be very brief, say one day. But if there is no spare in stock, then the downtime can be quite long. Even if the spare can be obtained on an expedited basis, it may be several days or a week before the machine can be repaired. If the spare must be fabricated by a far-away supplier and shipped by sea then by rail then trucked to your plant, the downtime could be weeks or months. This all means that keeping a proper inventory of spares is very important to keeping production humming along.

      In this aggregated type of analysis, the machine is treated as a black box that is either working or not. Though ignoring the details of which part failed and when, such a model is useful for sizing the pool of machines needed to maintain some minimum level of production capacity with high probability.

      The binomial distribution is the probability model relevant to this problem. The binomial is the same model that describes, for example, the distribution of the number of “heads” resulting from twenty tosses of a coin. In the machine reliability problem, the machines correspond to coins, and an outcome of heads corresponds to having a working machine.

      As an example, if

      • the chance that any given machine is running on any particular day is 90%
      • machine failures are independent (e.g., no flood or tornado to wipe them all out at once)
      • you require at least a 95% chance that at least 5 machines are running on any given day

      then the binomial model prescribes seven machines to achieve your goal.


      Modeling machine failures based on component failures

      Maximize Machine Uptime with Probabilistic Modeling

      The Weibull model can also be used to describe the failure of a single part. However, any realistically complex production machine will have multiple parts and therefore have multiple failure modes. This means that calculating the time until the machine fails requires analysis of a “race to failure”, with each part vying for the “honor” of being the first to fail.

      If we make the reasonable assumption that parts fail independently, standard probability theory points the way to combining the models of individual part failure into an overall model of machine failure. The time until the first of many parts fails has a poly-Weibull distribution. At this point, though, the analysis can get quite complicated, and the best move may be to switch from analysis-by-equation to analysis-by-simulation.


      Simulating machine failure from the details of part failures

      Simulation analysis got its modern start as a spinoff of the Manhattan Project to build the first atomic bomb. The method is also commonly called Monte Carlo simulation after the biggest gambling center on earth back in the day (today it would be “Macau simulation”).

      A simulation model converts the logic of the sequence of random events into corresponding computer code. Then it uses computer-generated (pseudo-)random numbers as fuel to drive the simulation model. For example, each component’s failure time is created by drawing from its particular Weibull failure time distribution. Then the soonest of those failure times begins the next episode of machine downtime.

      simulation of machine uptime over one year of operation

      Figure 2: A simulation of machine uptime over one year of operation

      Figure 2 shows the results of a simulation of the uptime of a single machine. Machines cycle through alternating periods of uptime and downtime. In this simulation, uptime is assumed to have an exponential distribution with an average duration (MTBF = Mean Time Before Failure) of 30 days. Downtime has a 50:50 split between 1 day if a spare is available and 30 days if not. In the simulation shown in Figure 2, the machine is working during 85% of the days in one year of operation.


      An approximate formula for machine uptime

      Although Monte Carlo simulation can provide more exact results, a simpler algebraic model does well as an approximation and makes it easier to see how the key variables relate.

      Define the following key variables:

      • MTBF = Mean Time Before Failure (days)
      • Pa = Probability that there is a spare part available when needed
      • MDTshort = Mean Down Time if there is a spare available when needed
      • MDTlong = Mean Down Time if there is no spare available when needed
      • Uptime = Percentage of days in which the machine is up and running.

      Then there is a simple approximation for the Uptime:

      Uptime ≈ 100 x MTBF/(MTBF + MDTshort x Pa + MDTlong x (1-Pa)).    (Equation 1)

      Equation 1 tells us that the uptime depends on the availability of a spare. If there is always a spare (Pa=1), then uptime achieves a peak value of about 100 x MTBF/(MTBF + MDTshort). If there is never a spare available (Pa=0), then uptime achieve its lowest value of about 100 x MTBF/(MTBF + MDTlong). When the repair time is about as long as the typical time between failures, uptime sinks to an unacceptable level near 50%. If a spare is always available, uptime can approach 100%.

      Relating machine downtime to spare parts inventory

      Minimizing downtime requires a multi-pronged initiative involving intensive operator training, use of quality raw materials, effective preventive maintenance – and adequate spare parts. The first three set the conditions for good results. The last deals with contingencies.

      Inventory Planning for Manufacturers MRO SAAS

      Once a machine is down, money is flying out the door and there is a premium on getting it back up pronto. This scene could play out in two ways. The good one has a spare part ready to go, so the downtime can be kept to a minimum. The bad one has no available spare, so there is a scramble to expedite delivery of the needed part. In this case, the manufacturer must bear both the cost of lost production and the cost of expedited shipping, if that is even an option.

      If the inventory system is properly designed, spare parts availability will not be a major impediment to machine uptime. By the design of an inventory system, I mean the results of several choices: whether the shortage policy is a backorder policy or a loss policy, whether the inventory review cycle is periodic or continuous, and what reorder points and order quantities are established.

      When inventory policies for products are designed, they are evaluated using several criteria. Service Level is the percentage of replenishment periods that pass without a stockout. Fill Rate is the percentage of units ordered that is supplied immediately from stock. Average Inventory Level is the typical number of units on hand.

      None of these is exactly the metric needed for spare parts stocking, though they all are related. The needed metric is Item Availability, which is the percentage of days in which there is at least one spare ready for use. Higher Service Levels, Fill Rates, and Inventory Levels all imply high Item Availability, and there are ways to convert from one to the other. (When dealing with multiple machines sharing the same stock of spares, Inventory Availability gets replaced by the probability distribution of the number of spares on any given day. We leave that more complex problem for another day.)

      Clearly, keeping a good supply of spares reduces the costs of machine downtime. Of course, keeping a good supply of spares creates its own inventory holding and ordering costs. This is the manufacturer’s second inventory problem. As with any decision involving inventory, the key is to strike the right balance between these two competing cost centers. See this article on probabilistic forecasting for intermittent demand for guidance on striking that balance.


      Leave a Comment

      Related Posts

      Constructive Play with Digital Twins

      Constructive Play with Digital Twins

      Those of you who track hot topics will be familiar with the term “digital twin.” Those who have been too busy with work may want to read on and catch up. While there are several definitions of digital twin, here’s one that works well: A digital twin is a dynamic virtual copy of a physical asset, process, system, or environment that looks like and behaves identically to its real-world counterpart. A digital twin ingests data and replicates processes so you can predict possible performance outcomes and issues that the real-world product might undergo.

      Direct to the Brain of the Boss – Inventory Analytics and Reporting

      Direct to the Brain of the Boss – Inventory Analytics and Reporting

      In this blog, the spotlight is cast on the software that creates reports for management, the silent hero that translates the beauty of furious calculations into actionable reports. Watch as the calculations, intricately guided by planners utilizing our software, seamlessly converge into Smart Operational Analytics (SOA) reports, dividing five key areas: inventory analysis, inventory performance, inventory trending, supplier performance, and demand anomalies.

      How Are We Doing? KPI’s and KPP’s

      How Are We Doing? KPI’s and KPP’s

      Dealing with the day-to-day of inventory management can keep you busy. But you know you have to get your head up now and then to see where you’re heading. For that, your inventory software should show you metrics – and not just one, but a full set of metrics or KPI’s – Key Performance Indicators.

      Recent Posts

      • Looking for Trouble in Your Inventory DataLooking for Trouble in Your Inventory Data
        In this video blog, the spotlight is on a critical aspect of inventory management: the analysis and interpretation of inventory data. The focus is specifically on a dataset from a public transit agency detailing spare parts for buses. […]
      • BAF Case Study SIOP planning Distribution CenterBig Ass Fans Turns to Smart Software as Demand Heats Up
        Big Ass Fans is the best-selling big fan manufacturer in the world, delivering comfort to spaces where comfort seems impossible. BAF had a problem: how to reliably plan production to meet demand. BAF was experiencing a gap between bookings forecasts vs. shipments, and this was impacting revenue and customer satisfaction BAF turned to Smart Software for help. […]
      • The Cost of Doing nothing with your inventory Planning SystemsThe Cost of Spreadsheet Planning
        Companies that depend on spreadsheets for demand planning, forecasting, and inventory management are often constrained by the spreadsheet’s inherent limitations. This post examines the drawbacks of traditional inventory management approaches caused by spreadsheets and their associated costs, contrasting these with the significant benefits gained from embracing state-of-the-art planning technologies. […]
      • Randomness can be an Ally in the Forecasting BattleCan Randomness be an Ally in the Forecasting Battle?
        When we try to understand the complex world of logistics, randomness plays a pivotal role. This introduces an interesting paradox: In a reality where precision and certainty are prized, could the unpredictable nature of supply and demand actually serve as a strategic ally? The quest for accurate forecasts is not just an academic exercise; it's a critical component of operational success across numerous industries. For demand planners who must anticipate product demand, the ramifications of getting it right—or wrong—are critical. Hence, recognizing and harnessing the power of randomness isn't merely a theoretical exercise; it’s a necessity for resilience and adaptability in an ever-changing environment. […]
      • Finding Your Spot on the Inventory Tradeoff CurveFinding Your Spot on the Inventory Tradeoff Curve
        This video blog holds essential insights for those working with the complexities of inventory management. The session focuses on striking the right balance within the inventory tradeoff curve, inviting viewers to understand the deep-seated importance of this equilibrium. […]

        Inventory Optimization for Manufacturers, Distributors, and MRO

        • Why MRO Businesses Need Add-on Service Parts Planning & Inventory SoftwareWhy MRO Businesses Need Add-on Service Parts Planning & Inventory Software
          MRO organizations exist in a wide range of industries, including public transit, electrical utilities, wastewater, hydro power, aviation, and mining. To get their work done, MRO professionals use Enterprise Asset Management (EAM) and Enterprise Resource Planning (ERP) systems. These systems are designed to do a lot of jobs. Given their features, cost, and extensive implementation requirements, there is an assumption that EAM and ERP systems can do it all. In this post, we summarize the need for add-on software that addresses specialized analytics for inventory optimization, forecasting, and service parts planning. […]
        • Spare-parts-demand-forecasting-a-different-perspective-for-planning-service-partsThe Forecast Matters, but Maybe Not the Way You Think
          True or false: The forecast doesn't matter to spare parts inventory management. At first glance, this statement seems obviously false. After all, forecasts are crucial for planning stock levels, right? It depends on what you mean by a “forecast”. If you mean an old-school single-number forecast (“demand for item CX218b will be 3 units next week and 6 units the week after”), then no. If you broaden the meaning of forecast to include a probability distribution taking account of uncertainties in both demand and supply, then yes. […]
        • Whyt MRO Businesses Should Care about Excess InventoryWhy MRO Businesses Should Care About Excess Inventory
          Do MRO companies genuinely prioritize reducing excess spare parts inventory? From an organizational standpoint, our experience suggests not necessarily. Boardroom discussions typically revolve around expanding fleets, acquiring new customers, meeting service level agreements (SLAs), modernizing infrastructure, and maximizing uptime. In industries where assets supported by spare parts cost hundreds of millions or generate significant revenue (e.g., mining or oil & gas), the value of the inventory just doesn’t raise any eyebrows, and organizations tend to overlook massive amounts of excessive inventory. […]
        • Top Differences between Inventory Planning for Finished Goods and for MRO and Spare PartsTop Differences Between Inventory Planning for Finished Goods and for MRO and Spare Parts
          In today’s competitive business landscape, companies are constantly seeking ways to improve their operational efficiency and drive increased revenue. Optimizing service parts management is an often-overlooked aspect that can have a significant financial impact. Companies can improve overall efficiency and generate significant financial returns by effectively managing spare parts inventory. This article will explore the economic implications of optimized service parts management and how investing in Inventory Optimization and Demand Planning Software can provide a competitive advantage. […]

          Want to Optimize Inventory? Follow These 4 Steps

          The Smart Forecaster

           Pursuing best practices in demand planning,

          forecasting and inventory optimization

          Service Level Driven Planning (SLDP) is an approach to inventory planning. It prescribes optimal service level targets continually identifies and communicates trade-offs between service and cost that are at the root of all wise inventory decisions. When an organization understands this relationship, they can communicate where they are at risk, where they are not, and effectively wield their inventory assets.  SLDP helps expose inventory imbalances and enables informed decisions on how best to correct them.  To implement SLDP, you’ll need to look beyond traditional planning approaches such as arbitrary service level targeting (all of my A items should get 99% service level, B items 95%, C items 80%, etc.) and demand forecasting that unrealistically attempts to predict exactly what will happen and when. SLDP unfolds in 4 steps: Benchmark, Collaborate, Plan, and Track.


          Step 1. Benchmark Performance


          All participants in the inventory planning and investment process must hold a common understanding of how current policy is performing across an agreed upon set of inventory metrics. Metrics should include historically achieved service levels and fill rates, delivery time to customers, supplier lead time performance, inventory turns, and inventory investment. Once these metrics have been benchmarked and can be reported on daily, the organization will have the information it needs to begin prioritize planning efforts. For example, if inventory has increased but service levels have not, this would indicate that the inventory is not being properly allocated across SKUs.  Reports should be generated within mouse-clicks enabling planners to focus on analysis instead of time intensive report generation.   Past performance isn’t a guarantee of future performance since demand variability, costs, priorities, and lead times are always changing. So SLDP enables predictive benchmarking that estimates what performance is likely to be in the future. Inventory optimization software utilizing probability forecasting can be used to estimate a realistic range of potential demands and replenishment cycles stress testing your planning parameters helping uncover how often and which items to expect stockouts and excess.


          Step 2. “What if” Planning & Collaboration


          “What if” inventory modeling and collaboration is at the heart of SLDP. The historical and predictive benchmarks should first be shared with all relevant stakeholders including sales, finance, and operations. Efforts should be placed on answering the following questions:

          – Are both the current performance and investment acceptable?
          – If not, how should they be improved?
          – Which SKUs are likely to be demanded next and in what quantities?
          – Where are we willing to take more stock out risk?
          – Where must stock-out risk be minimized?
          – What are the specific stock out costs?
          – What business rules and constraints must we adhere to (customer service level agreements, inventory thresholds, etc.)

          Once the above questions are answered, new inventory planning policies can be developed.  Inventory Optimization software can reconcile all costs associated with managing inventory including stockout costs to generate the right set of planning parameters (min/max, safety stock, reorder points, etc.) and prescribed service levels.  The optimal policy can be compared to the current policy and modified based on constraints and business rules. For example, certain items might be targeted at a target service level in order to conform to a customer service level agreement.   Various “what if” inventory planning scenarios can be developed and shared with key stakeholders. For example, you might model how shorter lead times impacts inventory costs. Once consensus has been achieved and the risks and costs are clearly communicated,  the modified policies can be uploaded to the ERP system to drive inventory replenishment.


          Step 3. Continually Plan and Manage by Exception

          SLDP continually reforecasts optimized planning parameters based on changing demands, lead times, costs, and other factors. This means that service levels and inventory value have the potential to change.  For example, the prescribed service level target of 95% might increase to 99% the next planning period if the stock-out costs on that item increased suddenly. This is also true if opting to arbitrarily target a given service level or fix planning parameters to a specific unit quantity. For example, a target service level of 95% might require $1,000 in inventory today but $2,000 next month if lead times spiked.  Similarly, a reorder point of 10 units might get 95% service today and only 85% service next month in response to increased demand variability. Inventory Optimization software will identify which items are forecasted to have significant changes in service level and/or inventory value and which items aren’t being ordered according to the consensus plan. Exception lists are automatically produced making it easy for you to review these items and decide how to manage them moving forward. Prescriptive Analytics can help identify whether the root cause of the change is a demand anomaly, change in overall demand variability, change in lead time, or change in cost helping you fine tune the policy accordingly.


          Step 4. Track Ongoing Performance


          SLDP processes regularly measure historical and current operational performance.   Results must be monitored to ensure that service levels are improving and inventory levels are decreasing when compared to the historical benchmarks determined in Step 1.  Track metrics such as turns, aggregate and item specific service levels, fill rates, out-of-stocks, and supplier lead time performance.  Share results across the organization and identify root causes to operational inefficiencies.  SLDP processes makes performance tracking easy by providing tools that automatically generate the necessary reports rather than placing this burden on planners to manage in Excel. Doing so enables the organization to uncover operational issues impacting performance and provide feedback on what is working and what should be improved.

          Conclusion

          The SLDP framework is a way to rationalize the inventory planning process and generate a significant economic return. Its organizing principle is that customer service levels and inventory costs associated with the chosen policy should be understood, tracked, and continually refined. Utilizing inventory optimization software helps ensure that you are able to identify the least-cost service level.  This creates a coherent, company-wide effort that combines visibility into current operations with scientific assessments of future risks and conditions. It is realized by a combination of executive vision, staff subject matter expertise, and the power of modern inventory planning and optimization software.

          See how Smart Inventory Optimization Supports Service Level Driven Planning and download the product sheet here: https://smartcorp.com/inventory-optimization/

          Leave a Comment

          Related Posts

          Constructive Play with Digital Twins

          Constructive Play with Digital Twins

          Those of you who track hot topics will be familiar with the term “digital twin.” Those who have been too busy with work may want to read on and catch up. While there are several definitions of digital twin, here’s one that works well: A digital twin is a dynamic virtual copy of a physical asset, process, system, or environment that looks like and behaves identically to its real-world counterpart. A digital twin ingests data and replicates processes so you can predict possible performance outcomes and issues that the real-world product might undergo.

          Direct to the Brain of the Boss – Inventory Analytics and Reporting

          Direct to the Brain of the Boss – Inventory Analytics and Reporting

          In this blog, the spotlight is cast on the software that creates reports for management, the silent hero that translates the beauty of furious calculations into actionable reports. Watch as the calculations, intricately guided by planners utilizing our software, seamlessly converge into Smart Operational Analytics (SOA) reports, dividing five key areas: inventory analysis, inventory performance, inventory trending, supplier performance, and demand anomalies.

          How Are We Doing? KPI’s and KPP’s

          How Are We Doing? KPI’s and KPP’s

          Dealing with the day-to-day of inventory management can keep you busy. But you know you have to get your head up now and then to see where you’re heading. For that, your inventory software should show you metrics – and not just one, but a full set of metrics or KPI’s – Key Performance Indicators.

          Recent Posts

          • Looking for Trouble in Your Inventory DataLooking for Trouble in Your Inventory Data
            In this video blog, the spotlight is on a critical aspect of inventory management: the analysis and interpretation of inventory data. The focus is specifically on a dataset from a public transit agency detailing spare parts for buses. […]
          • BAF Case Study SIOP planning Distribution CenterBig Ass Fans Turns to Smart Software as Demand Heats Up
            Big Ass Fans is the best-selling big fan manufacturer in the world, delivering comfort to spaces where comfort seems impossible. BAF had a problem: how to reliably plan production to meet demand. BAF was experiencing a gap between bookings forecasts vs. shipments, and this was impacting revenue and customer satisfaction BAF turned to Smart Software for help. […]
          • The Cost of Doing nothing with your inventory Planning SystemsThe Cost of Spreadsheet Planning
            Companies that depend on spreadsheets for demand planning, forecasting, and inventory management are often constrained by the spreadsheet’s inherent limitations. This post examines the drawbacks of traditional inventory management approaches caused by spreadsheets and their associated costs, contrasting these with the significant benefits gained from embracing state-of-the-art planning technologies. […]
          • Randomness can be an Ally in the Forecasting BattleCan Randomness be an Ally in the Forecasting Battle?
            When we try to understand the complex world of logistics, randomness plays a pivotal role. This introduces an interesting paradox: In a reality where precision and certainty are prized, could the unpredictable nature of supply and demand actually serve as a strategic ally? The quest for accurate forecasts is not just an academic exercise; it's a critical component of operational success across numerous industries. For demand planners who must anticipate product demand, the ramifications of getting it right—or wrong—are critical. Hence, recognizing and harnessing the power of randomness isn't merely a theoretical exercise; it’s a necessity for resilience and adaptability in an ever-changing environment. […]
          • Finding Your Spot on the Inventory Tradeoff CurveFinding Your Spot on the Inventory Tradeoff Curve
            This video blog holds essential insights for those working with the complexities of inventory management. The session focuses on striking the right balance within the inventory tradeoff curve, inviting viewers to understand the deep-seated importance of this equilibrium. […]

            Inventory Optimization for Manufacturers, Distributors, and MRO

            • Why MRO Businesses Need Add-on Service Parts Planning & Inventory SoftwareWhy MRO Businesses Need Add-on Service Parts Planning & Inventory Software
              MRO organizations exist in a wide range of industries, including public transit, electrical utilities, wastewater, hydro power, aviation, and mining. To get their work done, MRO professionals use Enterprise Asset Management (EAM) and Enterprise Resource Planning (ERP) systems. These systems are designed to do a lot of jobs. Given their features, cost, and extensive implementation requirements, there is an assumption that EAM and ERP systems can do it all. In this post, we summarize the need for add-on software that addresses specialized analytics for inventory optimization, forecasting, and service parts planning. […]
            • Spare-parts-demand-forecasting-a-different-perspective-for-planning-service-partsThe Forecast Matters, but Maybe Not the Way You Think
              True or false: The forecast doesn't matter to spare parts inventory management. At first glance, this statement seems obviously false. After all, forecasts are crucial for planning stock levels, right? It depends on what you mean by a “forecast”. If you mean an old-school single-number forecast (“demand for item CX218b will be 3 units next week and 6 units the week after”), then no. If you broaden the meaning of forecast to include a probability distribution taking account of uncertainties in both demand and supply, then yes. […]
            • Whyt MRO Businesses Should Care about Excess InventoryWhy MRO Businesses Should Care About Excess Inventory
              Do MRO companies genuinely prioritize reducing excess spare parts inventory? From an organizational standpoint, our experience suggests not necessarily. Boardroom discussions typically revolve around expanding fleets, acquiring new customers, meeting service level agreements (SLAs), modernizing infrastructure, and maximizing uptime. In industries where assets supported by spare parts cost hundreds of millions or generate significant revenue (e.g., mining or oil & gas), the value of the inventory just doesn’t raise any eyebrows, and organizations tend to overlook massive amounts of excessive inventory. […]
            • Top Differences between Inventory Planning for Finished Goods and for MRO and Spare PartsTop Differences Between Inventory Planning for Finished Goods and for MRO and Spare Parts
              In today’s competitive business landscape, companies are constantly seeking ways to improve their operational efficiency and drive increased revenue. Optimizing service parts management is an often-overlooked aspect that can have a significant financial impact. Companies can improve overall efficiency and generate significant financial returns by effectively managing spare parts inventory. This article will explore the economic implications of optimized service parts management and how investing in Inventory Optimization and Demand Planning Software can provide a competitive advantage. […]

              Backing into Safety Stock is the Safe Play

              The Smart Forecaster

               Pursuing best practices in demand planning,

              forecasting and inventory optimization

              We frequently encounter confusion about the process of setting safety stock levels. This blog hopes to clarify the issue.

              Safety stock is a critical component in any system of inventory management. Indeed, some inventory software treats safety stock as the key decision variable in the quest to balance inventory cost against item availability. Unfortunately, that approach is not the best way to strike the balance.

              First, realize that safety stock is part of a general equation:

              Inventory Target = Average Lead Time Demand + Safety Stock.

              Average Lead Time Demand is defined as the average units demanded multiplied by the average replenishment lead time. Example: If daily demand averages 2 units and the average lead time is 7 days, then the average lead time demand is 2 x 7= 14 units. Keeping 14 units on hand suffices to handle typical demand.

              But we all know that demand is random, so keeping enough stock on hand to cover the average lead time demand invites stockouts. As we like to say, “The average is not the answer.” The smart answer is to add in some safety stock to accommodate any random spikes in demand. But how much?

              There’s the problem. If you try to guesstimate a number for the safety stock, you are on thin ice. How do you know what the “right” number is?  You may think that you don’t have to worry about that because you have a good-enough answer now, but that answer has a sell-by date. Lead times change. So do demand patterns. So do company priorities. That means today’s good answer may become tomorrow’s blunder.

              Some companies try to wing it using a crude rule of thumb approach. For instance, they may say something like “Set safety stock at an additional two weeks of average demand.” This approach is seductive: It only needs simple math, and it is clear.  But for the reasons listed in the previous paragraph, it’s foolish. Better to get a good answer than a convenient answer.

              You need a principled, objective way to answer the question that takes account of the mathematics of randomness.  More than that, you need an answer that is linked to the key performance indicators (KPI’s) of the system: inventory cost and item availability.

              Simple logic gives you some sense of the answer, but it doesn’t provide the number you need. You know that more safety stock increases both cost and availability, while less safety stock decreases both. But without knowing how much those metrics will change if you change the safety stock, you have no way to align the safety stock decision with management’s intent for striking the balance between cost and availability.

              Rather than flying blind, you can back into the choice of safety stock by first finding the right choice for inventory target. Once you’ve done that, the safety stock pops out by a simple subtraction:

               Safety Stock = Inventory Target – Average Lead Time Demand.

              Manager In Warehouse With ClipboardOften times, companies will state that they don’t carry safety stock because the safety stock field in their ERP system is blank. Nearly always, safety stock is built into the targeted inventory level they have established.  So, using the above formula to “back out” how much safety stock you are building into the plan is quite helpful.  The key is not just to know how much safety stock you are carrying but the link between your inventory target, safety stocks, and its corresponding KPI’s.

              For instance, suppose you can tolerate only a 5% chance of stocking out while waiting for replenishment (inventory texts call this interval the “period of risk.”). Software can examine the demand history of each item and work out the odds of stockout based on the thousands of different demand scenarios that can occur during the lead time. Then the right answer for the inventory target is the choice that leads to no more than a 5% stockout risk. Given that target and knowing the average lead time demand, the appropriate safety stock value falls right out by subtraction. You also get to know the average holding, ordering and shortage costs.

              That’s what we mean by “backing into the safety stock.” Start with company objectives, determine the appropriate inventory target, then derive the safety stock as the last step. Don’t start with a guess about safety stock and hope for the best.

              Leave a Comment

              Related Posts

              The Cost of Spreadsheet Planning

              The Cost of Spreadsheet Planning

              Companies that depend on spreadsheets for demand planning, forecasting, and inventory management are often constrained by the spreadsheet’s inherent limitations. This post examines the drawbacks of traditional inventory management approaches caused by spreadsheets and their associated costs, contrasting these with the significant benefits gained from embracing state-of-the-art planning technologies.

              Finding Your Spot on the Inventory Tradeoff Curve

              Finding Your Spot on the Inventory Tradeoff Curve

              This video blog holds essential insights for those working with the complexities of inventory management. The session focuses on striking the right balance within the inventory tradeoff curve, inviting viewers to understand the deep-seated importance of this equilibrium.

              Why MRO Businesses Need Add-on Service Parts Planning & Inventory Software

              Why MRO Businesses Need Add-on Service Parts Planning & Inventory Software

              MRO organizations exist in a wide range of industries, including public transit, electrical utilities, wastewater, hydro power, aviation, and mining. To get their work done, MRO professionals use Enterprise Asset Management (EAM) and Enterprise Resource Planning (ERP) systems. These systems are designed to do a lot of jobs. Given their features, cost, and extensive implementation requirements, there is an assumption that EAM and ERP systems can do it all. In this post, we summarize the need for add-on software that addresses specialized analytics for inventory optimization, forecasting, and service parts planning.

              Recent Posts

              • Looking for Trouble in Your Inventory DataLooking for Trouble in Your Inventory Data
                In this video blog, the spotlight is on a critical aspect of inventory management: the analysis and interpretation of inventory data. The focus is specifically on a dataset from a public transit agency detailing spare parts for buses. […]
              • BAF Case Study SIOP planning Distribution CenterBig Ass Fans Turns to Smart Software as Demand Heats Up
                Big Ass Fans is the best-selling big fan manufacturer in the world, delivering comfort to spaces where comfort seems impossible. BAF had a problem: how to reliably plan production to meet demand. BAF was experiencing a gap between bookings forecasts vs. shipments, and this was impacting revenue and customer satisfaction BAF turned to Smart Software for help. […]
              • The Cost of Doing nothing with your inventory Planning SystemsThe Cost of Spreadsheet Planning
                Companies that depend on spreadsheets for demand planning, forecasting, and inventory management are often constrained by the spreadsheet’s inherent limitations. This post examines the drawbacks of traditional inventory management approaches caused by spreadsheets and their associated costs, contrasting these with the significant benefits gained from embracing state-of-the-art planning technologies. […]
              • Randomness can be an Ally in the Forecasting BattleCan Randomness be an Ally in the Forecasting Battle?
                When we try to understand the complex world of logistics, randomness plays a pivotal role. This introduces an interesting paradox: In a reality where precision and certainty are prized, could the unpredictable nature of supply and demand actually serve as a strategic ally? The quest for accurate forecasts is not just an academic exercise; it's a critical component of operational success across numerous industries. For demand planners who must anticipate product demand, the ramifications of getting it right—or wrong—are critical. Hence, recognizing and harnessing the power of randomness isn't merely a theoretical exercise; it’s a necessity for resilience and adaptability in an ever-changing environment. […]
              • Finding Your Spot on the Inventory Tradeoff CurveFinding Your Spot on the Inventory Tradeoff Curve
                This video blog holds essential insights for those working with the complexities of inventory management. The session focuses on striking the right balance within the inventory tradeoff curve, inviting viewers to understand the deep-seated importance of this equilibrium. […]

                Inventory Optimization for Manufacturers, Distributors, and MRO

                • Why MRO Businesses Need Add-on Service Parts Planning & Inventory SoftwareWhy MRO Businesses Need Add-on Service Parts Planning & Inventory Software
                  MRO organizations exist in a wide range of industries, including public transit, electrical utilities, wastewater, hydro power, aviation, and mining. To get their work done, MRO professionals use Enterprise Asset Management (EAM) and Enterprise Resource Planning (ERP) systems. These systems are designed to do a lot of jobs. Given their features, cost, and extensive implementation requirements, there is an assumption that EAM and ERP systems can do it all. In this post, we summarize the need for add-on software that addresses specialized analytics for inventory optimization, forecasting, and service parts planning. […]
                • Spare-parts-demand-forecasting-a-different-perspective-for-planning-service-partsThe Forecast Matters, but Maybe Not the Way You Think
                  True or false: The forecast doesn't matter to spare parts inventory management. At first glance, this statement seems obviously false. After all, forecasts are crucial for planning stock levels, right? It depends on what you mean by a “forecast”. If you mean an old-school single-number forecast (“demand for item CX218b will be 3 units next week and 6 units the week after”), then no. If you broaden the meaning of forecast to include a probability distribution taking account of uncertainties in both demand and supply, then yes. […]
                • Whyt MRO Businesses Should Care about Excess InventoryWhy MRO Businesses Should Care About Excess Inventory
                  Do MRO companies genuinely prioritize reducing excess spare parts inventory? From an organizational standpoint, our experience suggests not necessarily. Boardroom discussions typically revolve around expanding fleets, acquiring new customers, meeting service level agreements (SLAs), modernizing infrastructure, and maximizing uptime. In industries where assets supported by spare parts cost hundreds of millions or generate significant revenue (e.g., mining or oil & gas), the value of the inventory just doesn’t raise any eyebrows, and organizations tend to overlook massive amounts of excessive inventory. […]
                • Top Differences between Inventory Planning for Finished Goods and for MRO and Spare PartsTop Differences Between Inventory Planning for Finished Goods and for MRO and Spare Parts
                  In today’s competitive business landscape, companies are constantly seeking ways to improve their operational efficiency and drive increased revenue. Optimizing service parts management is an often-overlooked aspect that can have a significant financial impact. Companies can improve overall efficiency and generate significant financial returns by effectively managing spare parts inventory. This article will explore the economic implications of optimized service parts management and how investing in Inventory Optimization and Demand Planning Software can provide a competitive advantage. […]

                  Gaming Out Your Logistical Response to the Corona Virus

                  The Smart Forecaster

                   Pursuing best practices in demand planning,

                  forecasting and inventory optimization

                  ​As the world holds its breathe to see how the new corona virus (2019-nCOV) will play out, we cross our fingers for all those currently in quarantine or under treatment and pray that health authorities around the world will soon get the upper hand.

                  This short note is about one way your business can develop a plan to adjust to one of the likely fallouts from the virus: sudden increases in the time it takes to get inventory replenishment from suppliers. Supply chains around the world are being disrupted. If this happens to you, how can you react in a systematic way?

                  Reacting to Longer Lead Times

                  This is a problem that can be solved using advanced supply chain analytics. Presumably, you may have already used this technology to make good choices for the control parameters used in managing all your inventory items, e.g., values for Min and Max or Reorder Point and Order Quantity. The specific technical question addressed here is how to convert an increase in replenishment lead time to changes in those control parameters.

                  In general, longer lead times require fatter inventories if you want to maintain a high level of customer service. This general rule translates into larger values of Min and/or Max. How much larger depends critically on what new, longer lead time values will appear and their probabilities of occurring.

                  While many planning software systems assume a fixed lead time, the reality is that almost all lead times have some degree of randomness. Typically, ignoring that randomness increases stockout risk, so having a good estimate of the probability distribution of lead times is important. In normal times, your transactional data can be used to estimate that relationship. But sudden disruptions like 2019-nCOV create unprecedented situations in which you have to make educated guesses about what new delays you will see and how likely they are. We will assume here that you can imagine some such scenarios and want to figure out how to best respond to them.

                  An Example using Advanced Software

                  To illustrate this type of prospective planning, consider a hypothetical example. One item, a spare part, has an established pattern of replenishment lead times, with delays of 5, 10 and 15 days occurring with 15%, 70% and 15% probabilities, respectively. Given this distribution and a random demand averaging one unit every 5 days, values of Min = 5 and Max = 10 do a good job. Figure 1 shows a simulation of 10 years of daily operation under this scenario. Fill rate and service level are high, and stockouts are infrequent.

                  Now suppose that disruptions in the supply chain create a less favorable distribution of lead time, with a 50:50 mix of 15 and 30 days. Figure 2 shows how badly the current values of Min and Max perform in this new scenario. Fill rate and service level plummet due to frequent stockouts. Operating costs more than triple due to penalties for backorders. Only inventory investment (the average dollar value of stock on the shelf) seems to get better, but this happens only because so often there are backorders with nothing left on the shelf. The shift to longer lead times clearly requires new higher values of Min and Max.

                  Figure 3 shows how the system performs when the Min is increased from 5 to 10 and the Max from 10 to 15. This change compensates for the longer lead times, restoring the previous high levels of fill rate and service level. Inventory investment is necessarily greater, but operating costs are actually lower than before.

                  Summary

                  Changes in normal operating conditions require adjustments in the way inventory items are managed. One such change looming large on this date is the potential impact of the 2019-nCOV Corona virus on supply chains, with anticipated increases in replenishment lead times.

                  Changes in lead times require changes in inventory control parameters such as Min’s and Max’s. These changes are difficult to make with any confidence using pure guesswork. But with some estimate of the increase in lead times, you can use advanced software to learn how to make these adjustments with some confidence.

                  This note illustrates this point using simulations of the daily operation of an inventory control system.

                  Figure 1 Simulation of normal operations using current replenishment lead times, Min and Max

                  Figure 2 Simulation of abnormal operations using longer lead times and current Min and Max

                  Figure 3 Simulation of abnormal operations using longer lead times and revised Min and Max

                  Leave a Comment

                  Related Posts

                  The Cost of Spreadsheet Planning

                  The Cost of Spreadsheet Planning

                  Companies that depend on spreadsheets for demand planning, forecasting, and inventory management are often constrained by the spreadsheet’s inherent limitations. This post examines the drawbacks of traditional inventory management approaches caused by spreadsheets and their associated costs, contrasting these with the significant benefits gained from embracing state-of-the-art planning technologies.

                  Finding Your Spot on the Inventory Tradeoff Curve

                  Finding Your Spot on the Inventory Tradeoff Curve

                  This video blog holds essential insights for those working with the complexities of inventory management. The session focuses on striking the right balance within the inventory tradeoff curve, inviting viewers to understand the deep-seated importance of this equilibrium.

                  Why MRO Businesses Need Add-on Service Parts Planning & Inventory Software

                  Why MRO Businesses Need Add-on Service Parts Planning & Inventory Software

                  MRO organizations exist in a wide range of industries, including public transit, electrical utilities, wastewater, hydro power, aviation, and mining. To get their work done, MRO professionals use Enterprise Asset Management (EAM) and Enterprise Resource Planning (ERP) systems. These systems are designed to do a lot of jobs. Given their features, cost, and extensive implementation requirements, there is an assumption that EAM and ERP systems can do it all. In this post, we summarize the need for add-on software that addresses specialized analytics for inventory optimization, forecasting, and service parts planning.

                  Recent Posts

                  • Looking for Trouble in Your Inventory DataLooking for Trouble in Your Inventory Data
                    In this video blog, the spotlight is on a critical aspect of inventory management: the analysis and interpretation of inventory data. The focus is specifically on a dataset from a public transit agency detailing spare parts for buses. […]
                  • BAF Case Study SIOP planning Distribution CenterBig Ass Fans Turns to Smart Software as Demand Heats Up
                    Big Ass Fans is the best-selling big fan manufacturer in the world, delivering comfort to spaces where comfort seems impossible. BAF had a problem: how to reliably plan production to meet demand. BAF was experiencing a gap between bookings forecasts vs. shipments, and this was impacting revenue and customer satisfaction BAF turned to Smart Software for help. […]
                  • The Cost of Doing nothing with your inventory Planning SystemsThe Cost of Spreadsheet Planning
                    Companies that depend on spreadsheets for demand planning, forecasting, and inventory management are often constrained by the spreadsheet’s inherent limitations. This post examines the drawbacks of traditional inventory management approaches caused by spreadsheets and their associated costs, contrasting these with the significant benefits gained from embracing state-of-the-art planning technologies. […]
                  • Randomness can be an Ally in the Forecasting BattleCan Randomness be an Ally in the Forecasting Battle?
                    When we try to understand the complex world of logistics, randomness plays a pivotal role. This introduces an interesting paradox: In a reality where precision and certainty are prized, could the unpredictable nature of supply and demand actually serve as a strategic ally? The quest for accurate forecasts is not just an academic exercise; it's a critical component of operational success across numerous industries. For demand planners who must anticipate product demand, the ramifications of getting it right—or wrong—are critical. Hence, recognizing and harnessing the power of randomness isn't merely a theoretical exercise; it’s a necessity for resilience and adaptability in an ever-changing environment. […]
                  • Finding Your Spot on the Inventory Tradeoff CurveFinding Your Spot on the Inventory Tradeoff Curve
                    This video blog holds essential insights for those working with the complexities of inventory management. The session focuses on striking the right balance within the inventory tradeoff curve, inviting viewers to understand the deep-seated importance of this equilibrium. […]

                    Inventory Optimization for Manufacturers, Distributors, and MRO

                    • Why MRO Businesses Need Add-on Service Parts Planning & Inventory SoftwareWhy MRO Businesses Need Add-on Service Parts Planning & Inventory Software
                      MRO organizations exist in a wide range of industries, including public transit, electrical utilities, wastewater, hydro power, aviation, and mining. To get their work done, MRO professionals use Enterprise Asset Management (EAM) and Enterprise Resource Planning (ERP) systems. These systems are designed to do a lot of jobs. Given their features, cost, and extensive implementation requirements, there is an assumption that EAM and ERP systems can do it all. In this post, we summarize the need for add-on software that addresses specialized analytics for inventory optimization, forecasting, and service parts planning. […]
                    • Spare-parts-demand-forecasting-a-different-perspective-for-planning-service-partsThe Forecast Matters, but Maybe Not the Way You Think
                      True or false: The forecast doesn't matter to spare parts inventory management. At first glance, this statement seems obviously false. After all, forecasts are crucial for planning stock levels, right? It depends on what you mean by a “forecast”. If you mean an old-school single-number forecast (“demand for item CX218b will be 3 units next week and 6 units the week after”), then no. If you broaden the meaning of forecast to include a probability distribution taking account of uncertainties in both demand and supply, then yes. […]
                    • Whyt MRO Businesses Should Care about Excess InventoryWhy MRO Businesses Should Care About Excess Inventory
                      Do MRO companies genuinely prioritize reducing excess spare parts inventory? From an organizational standpoint, our experience suggests not necessarily. Boardroom discussions typically revolve around expanding fleets, acquiring new customers, meeting service level agreements (SLAs), modernizing infrastructure, and maximizing uptime. In industries where assets supported by spare parts cost hundreds of millions or generate significant revenue (e.g., mining or oil & gas), the value of the inventory just doesn’t raise any eyebrows, and organizations tend to overlook massive amounts of excessive inventory. […]
                    • Top Differences between Inventory Planning for Finished Goods and for MRO and Spare PartsTop Differences Between Inventory Planning for Finished Goods and for MRO and Spare Parts
                      In today’s competitive business landscape, companies are constantly seeking ways to improve their operational efficiency and drive increased revenue. Optimizing service parts management is an often-overlooked aspect that can have a significant financial impact. Companies can improve overall efficiency and generate significant financial returns by effectively managing spare parts inventory. This article will explore the economic implications of optimized service parts management and how investing in Inventory Optimization and Demand Planning Software can provide a competitive advantage. […]

                      There is a way your business can develop a plan to adjust increasing Demand. Cloud computing companies with unique server and hardware parts, e-commerce, online retailers, home and office supply companies, onsite furniture, power utilities, intensive assets maintenance or warehousing for water supply companies have increased their activity during the pandemic.Delivery service companies, cleaning services, liquor stores and canned or jarred goods warehouses, home improvement stores, gardening suppliers, yard care companies, hardware, kitchen and baking supplies stores, home furniture suppliers with high demand are facing stockouts, long lead times, inventory shortage costs, higher operating costs and ordering costs. Garages selling car parts and truck parts, pharmaceuticals, healthcare or medical supply manufacturers and safety product suppliers are dealing with increasing demand.