Many of our customers that saw demand dry up during the pandemic are now seeing demand return. Some are seeing a significant demand surge. Other customers in critical industries like plastics, biotech, semiconductors and electronics saw demand surges starting as far back as last April. For suggestions about how to cope with these situations, please read on.
Surging demand usually creates two problems: inability to fill orders and inability to get replenishment due to supplier overload. This situation requires changes in the way you use your advanced planning software. Here are three tips to help you cope.
Tip #1: Narrow your temporal focus
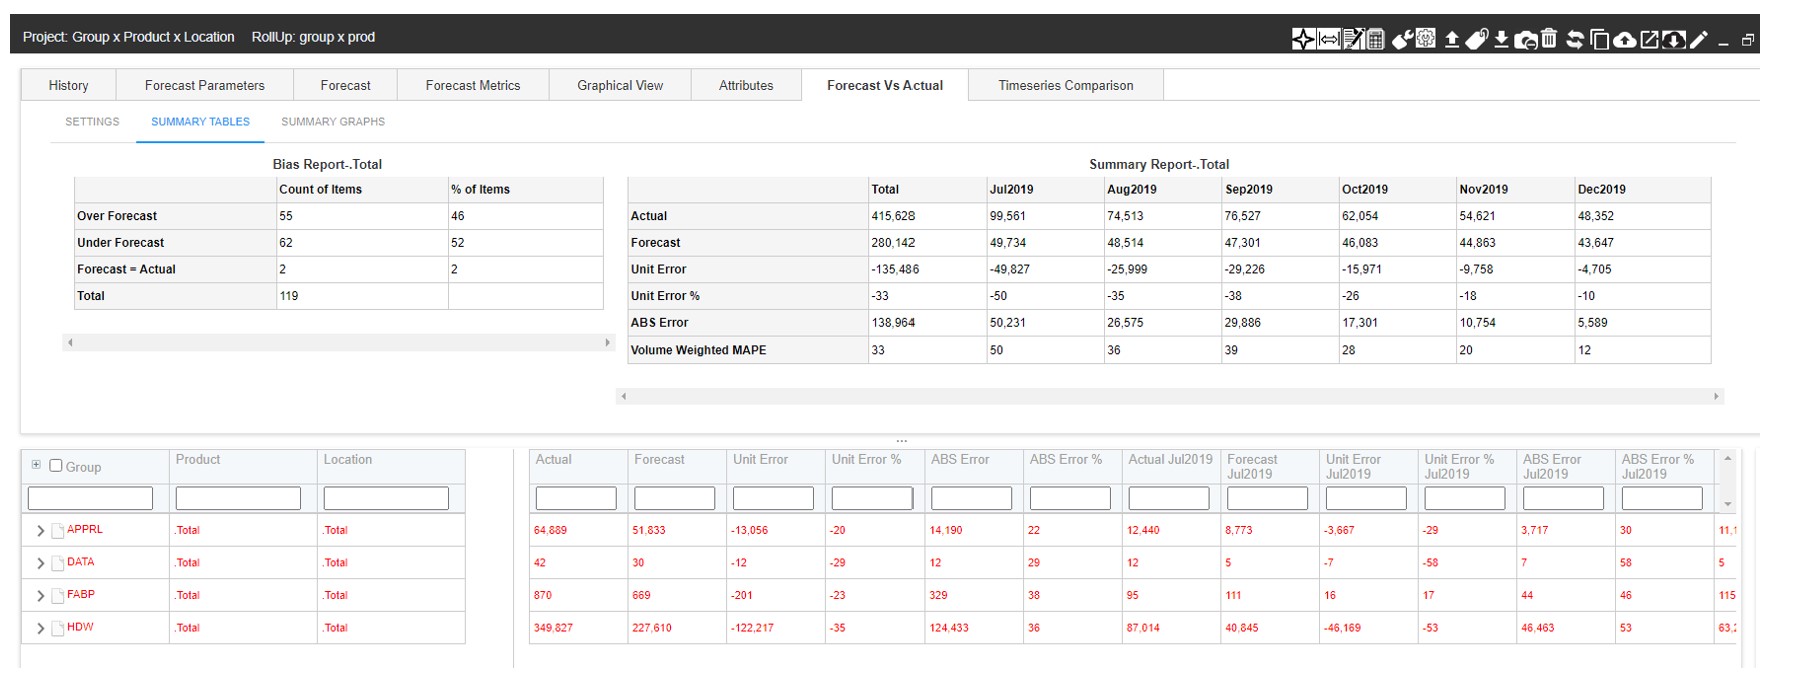
In normal times (remember those?), more data implied better results. Nowadays, old data poison your calculations, since they represent conditions that no longer apply. You should base forecasts and other calculations on data from the current situation. Where to cut off past data may be obvious from a plot of the data, or you may decide to set a “reasonable” cutoff date based on a consensus of colleagues. Smart Software has developed machine learning algorithms that automatically identify how much historical data should be optimally fed to the forecast model. Be on the lookout for these enhancements to the software that will be rolling out soon. In the meantime, conduct accuracy tests using held-out actuals using different historical start dates. Smart’s forecast vs. actual feature will support this automatically.
Tip #2: Increase your planning tempo
When operations are stable, you can set your inventory policies and trust them to be appropriate for a long time. When times are turbulent, it is important to increase the frequency of your planning cycles to keep old policy settings from drifting too far away from optimality. More frequent recalibration of your stocking policies and forecasts means that you’ll be quicker to catch trends that will surprise your competition and always keep you steps ahead. With software capable of automatically selecting optimal values, all that work can be done in one shot by the software. You should review those changes and possibly tweak them, but it makes sense to let the software do the bulk of the work.
Tip #3: Do more What-If planning
In turbulent times, you might expect even more turbulence in the future. Using your software for what-if planning helps you prepare for changes that may be coming. For example, suppose you’ve been in touch with a key supplier who hints that they may be raising prices or may have to slip their delivery schedules. By feeding the software different inputs, you can do contingency planning. If prices go up, you can see how responding by changing order quantities would impact your inventory operating costs and inventory investment. If lead times go up, you can see what the impact would be on item availability. This foreknowledge helps you figure out what your counter-moves would be before the crisis hits.
If there ever was a time when we could cruise on automatic pilot, it’s in the rear-view mirror. Your organization, coping with explosive growth, has many challenges. Old answers are obsolete; new answers have to come from somewhere, fast. Advanced software that leverages probabilistic forecasting can help, along with changes in planning processes.

Related Posts

Make AI-Driven Inventory Optimization an Ally for Your Organization
In this blog, we will explore how organizations can achieve exceptional efficiency and accuracy with AI-driven inventory optimization. Traditional inventory management methods often fall short due to their reactive nature and reliance on manual processes. Maintaining optimal inventory levels is fundamental for meeting customer demand while minimizing costs. The introduction of AI-driven inventory optimization can significantly reduce the burden of manual processes, providing relief to supply chain managers from tedious tasks.

Daily Demand Scenarios
In this Videoblog, we will explain how time series forecasting has emerged as a pivotal tool, particularly at the daily level, which Smart Software has been pioneering since its inception over forty years ago. The evolution of business practices from annual to more refined temporal increments like monthly and now daily data analysis illustrates a significant shift in operational strategies.

Constructive Play with Digital Twins
Those of you who track hot topics will be familiar with the term “digital twin.” Those who have been too busy with work may want to read on and catch up. While there are several definitions of digital twin, here’s one that works well: A digital twin is a dynamic virtual copy of a physical asset, process, system, or environment that looks like and behaves identically to its real-world counterpart. A digital twin ingests data and replicates processes so you can predict possible performance outcomes and issues that the real-world product might undergo.
Recent Posts
 Forecast-Based Inventory Management for Better PlanningForecast-based inventory management, or MRP (Material Requirements Planning) logic, is a forward-planning method that helps businesses meet demand without overstocking or understocking. By anticipating demand and adjusting inventory levels, it maintains a balance between meeting customer needs and minimizing excess inventory costs. This approach optimizes operations, reduces waste, and enhances customer satisfaction. […]
 Make AI-Driven Inventory Optimization an Ally for Your OrganizationIn this blog, we will explore how organizations can achieve exceptional efficiency and accuracy with AI-driven inventory optimization. Traditional inventory management methods often fall short due to their reactive nature and reliance on manual processes. Maintaining optimal inventory levels is fundamental for meeting customer demand while minimizing costs. The introduction of AI-driven inventory optimization can significantly reduce the burden of manual processes, providing relief to supply chain managers from tedious tasks. […]
 The Importance of Clear Service Level Definitions in Inventory ManagementInventory optimization software that supports what-if analysis will expose the tradeoff of stockouts vs. excess costs of varying service level targets. But first it is important to identify how “service levels” is interpreted, measured, and reported. This will avoid miscommunication and the false sense of security that can develop when less stringent definitions are used. Clearly defining how service level is calculated puts all stakeholders on the same page. This facilitates better decision-making. […]
 Future-Proofing Utilities: Advanced Analytics for Supply Chain OptimizationUtilities in the electrical, natural gas, urban water, and telecommunications fields are all asset-intensive and reliant on physical infrastructure that must be properly maintained, updated, and upgraded over time. Maximizing asset uptime and the reliability of physical infrastructure demands effective inventory management, spare parts forecasting, and supplier management. A utility that executes these processes effectively will outperform its peers, provide better returns for its investors and higher service levels for its customers, while reducing its environmental impact. […]
 The Cost of Spreadsheet PlanningCompanies that depend on spreadsheets for demand planning, forecasting, and inventory management are often constrained by the spreadsheet’s inherent limitations. This post examines the drawbacks of traditional inventory management approaches caused by spreadsheets and their associated costs, contrasting these with the significant benefits gained from embracing state-of-the-art planning technologies. […]

Inventory Optimization for Manufacturers, Distributors, and MRO
- Future-Proofing Utilities: Advanced Analytics for Supply Chain OptimizationUtilities in the electrical, natural gas, urban water, and telecommunications fields are all asset-intensive and reliant on physical infrastructure that must be properly maintained, updated, and upgraded over time. Maximizing asset uptime and the reliability of physical infrastructure demands effective inventory management, spare parts forecasting, and supplier management. A utility that executes these processes effectively will outperform its peers, provide better returns for its investors and higher service levels for its customers, while reducing its environmental impact. […]
 Centering Act: Spare Parts Timing, Pricing, and ReliabilityIn this article, we'll walk you through the process of crafting a spare parts inventory plan that prioritizes availability metrics such as service levels and fill rates while ensuring cost efficiency. We'll focus on an approach to inventory planning called Service Level-Driven Inventory Optimization. Next, we'll discuss how to determine what parts you should include in your inventory and those that might not be necessary. Lastly, we'll explore ways to enhance your service-level-driven inventory plan consistently. […]
 Why MRO Businesses Need Add-on Service Parts Planning & Inventory SoftwareMRO organizations exist in a wide range of industries, including public transit, electrical utilities, wastewater, hydro power, aviation, and mining. To get their work done, MRO professionals use Enterprise Asset Management (EAM) and Enterprise Resource Planning (ERP) systems. These systems are designed to do a lot of jobs. Given their features, cost, and extensive implementation requirements, there is an assumption that EAM and ERP systems can do it all. In this post, we summarize the need for add-on software that addresses specialized analytics for inventory optimization, forecasting, and service parts planning. […]
 5 Steps to Improve the Financial Impact of Spare Parts PlanningIn today’s competitive business landscape, companies are constantly seeking ways to improve their operational efficiency and drive increased revenue. Optimizing service parts management is an often-overlooked aspect that can have a significant financial impact. Companies can improve overall efficiency and generate significant financial returns by effectively managing spare parts inventory. This article will explore the economic implications of optimized service parts management and how investing in Inventory Optimization and Demand Planning Software can provide a competitive advantage. […]