Managing Demand Variability

The Smart Forecaster

 Pursuing best practices in demand planning,

forecasting and inventory optimization

Anybody doing the job knows that managing inventory can be stressful. Common stressors include: Customers with “special” requests, IT departments with other priorities, balky ERP systems running on inaccurate data, raw material shortages, suppliers with long lead times in far-away countries where production often stops for various reasons and more. This note will address one particular and ever-present source of stress: demand variability.

Everybody Has a Forecasting Problem


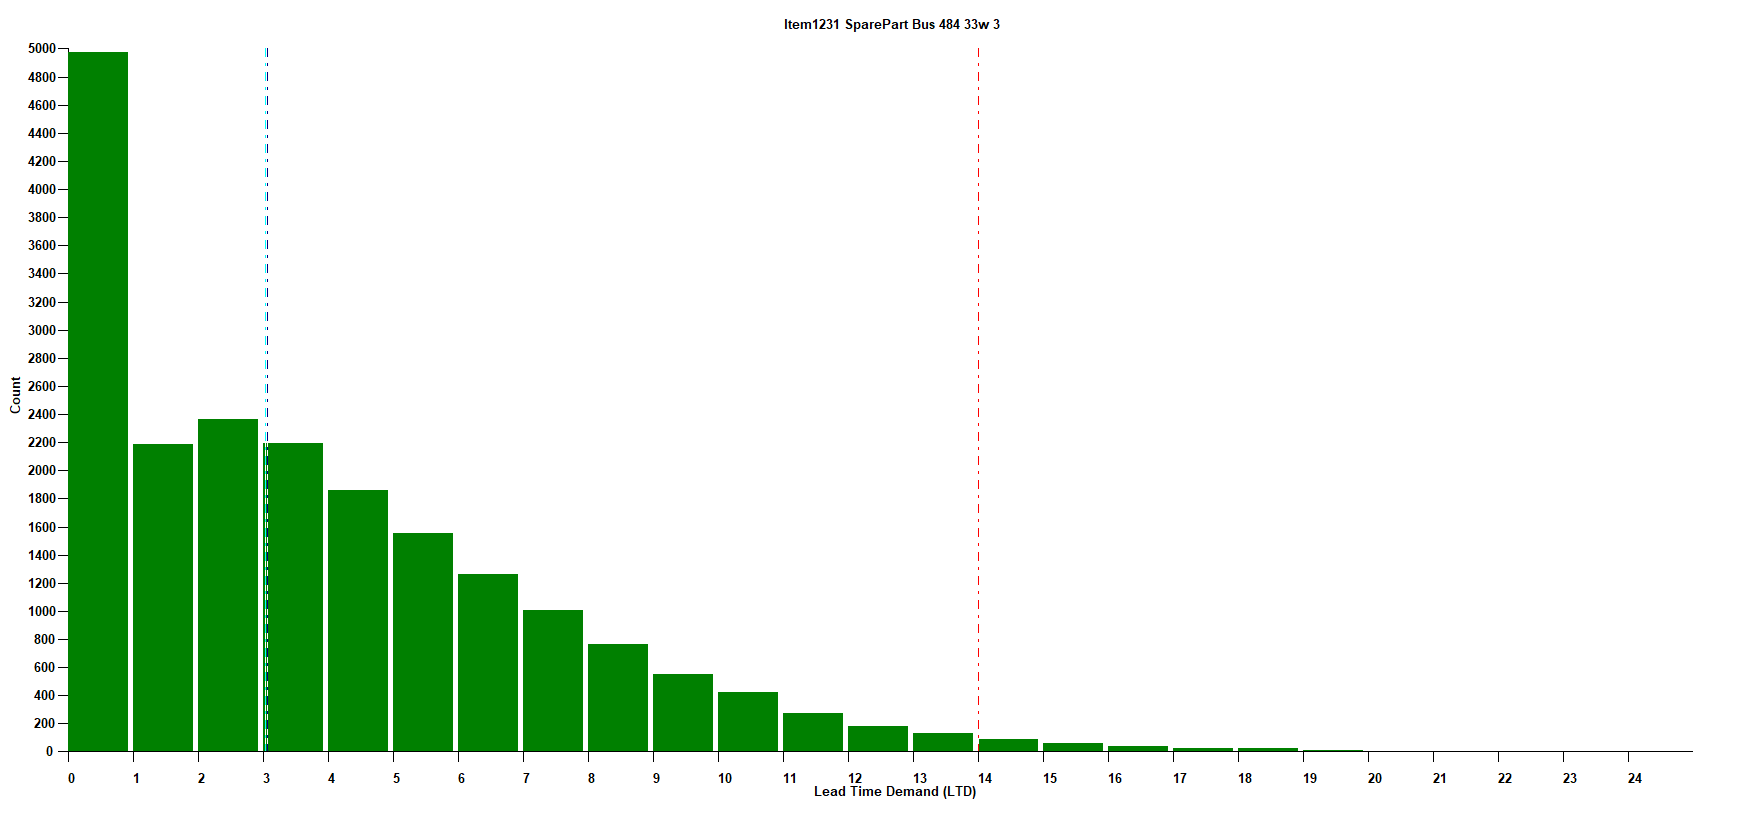
Suppose you manage a large fleet of spare parts. These might be surgical equipment for your hospital, or repair parts for your power station. Your mission is to maximize up time. Your enemy is down time. But because breakdowns hit at random, you are constantly in reactive mode. You might hope for rescue from forecasting technologies. But forecasts are inevitably imperfect to some degree: the element of surprise is always present.  You might wait for Internet of Things (IOT) tech to be deployed on your equipment to monitor and detect impending failures, helping you schedule repairs well in advance. But you know you can’t meter up the thousands of small things that can fail and disable a big thing.

So, you decide to combine forecasting with inventory management and build buffers or safety stock to protect against surprise spikes in demand. Now you have to work out how much safety stock to maintain, knowing that too little means vulnerability and too much means bloat.

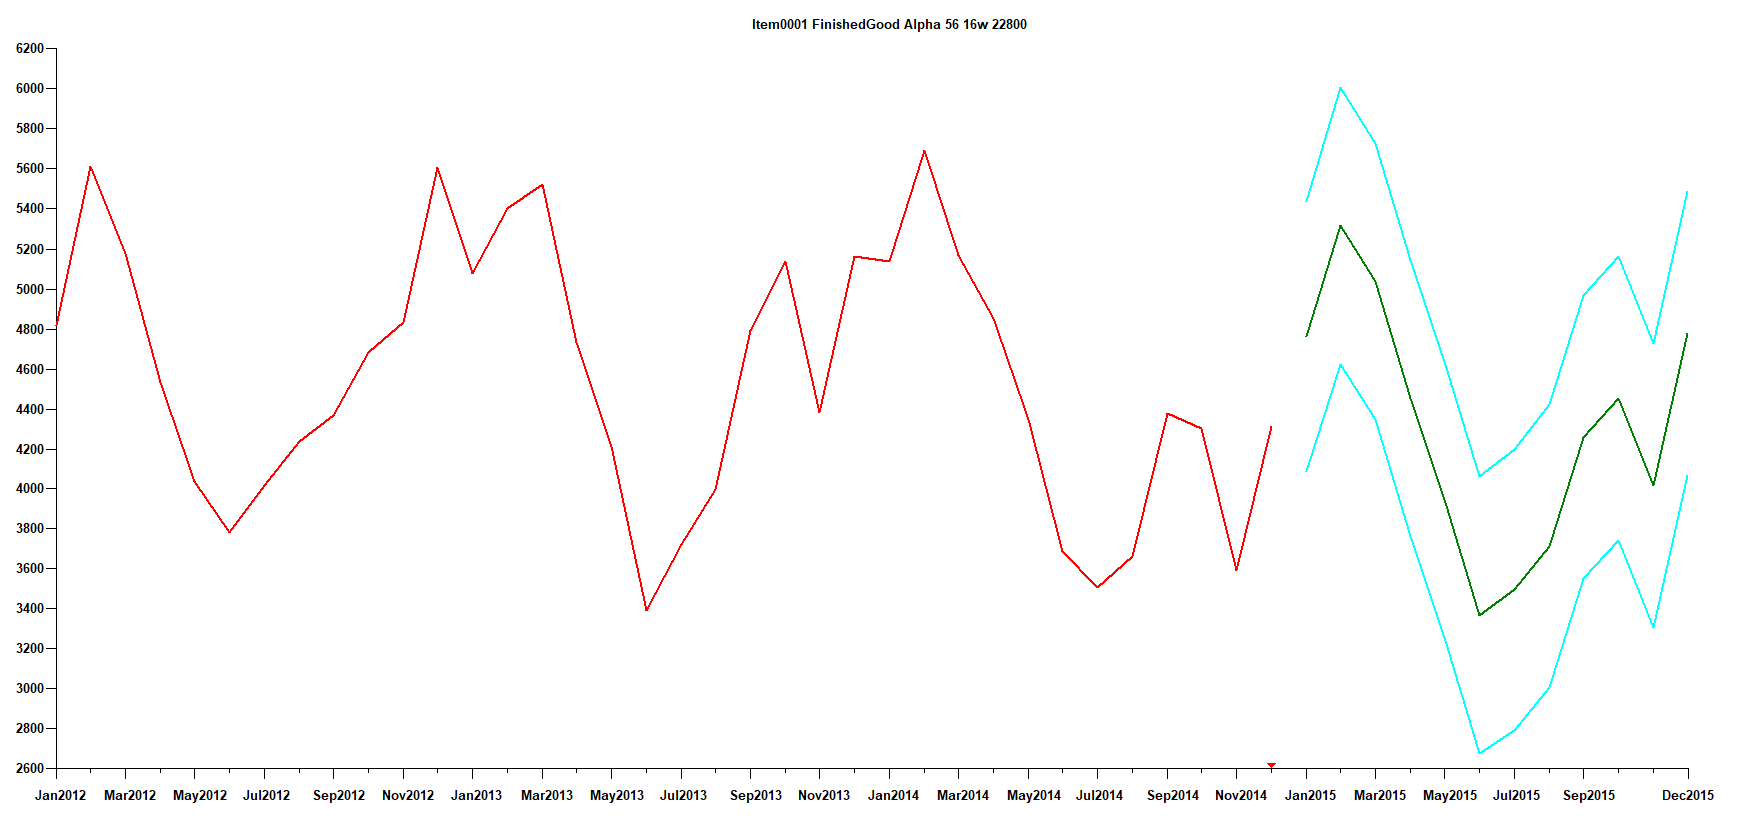
Suppose you handle finished goods inventories for a make-to-stock company. Your problem is essentially the same as in managing service parts: You have external customers and uncertain demand. But you may also have additional problems in terms of synchronizing multiple suppliers of components that you assemble into finished goods. The suppliers want you to tell them how much of their stuff to make so you can make your stuff, but you don’t know how much of your own stuff you’ll need to make.

Finally, suppose you handle finished goods in a build-to-order company. You might think that you no longer have a forecasting problem, since you don’t build until you are paid to build. But you do have a forecasting problem. Since your finished goods might be assembled from a mixture of components and sub-assemblies, you have to translate some forecast of finished goods demand to work out a forecast of those components. Otherwise, you will go to make your finished goods and discover that you don’t have a required component and have to wait until you can re-actively assemble everything you need. And your customers might not be willing to wait.

So, everybody has a forecasting problem.

What Makes Forecasting Difficult


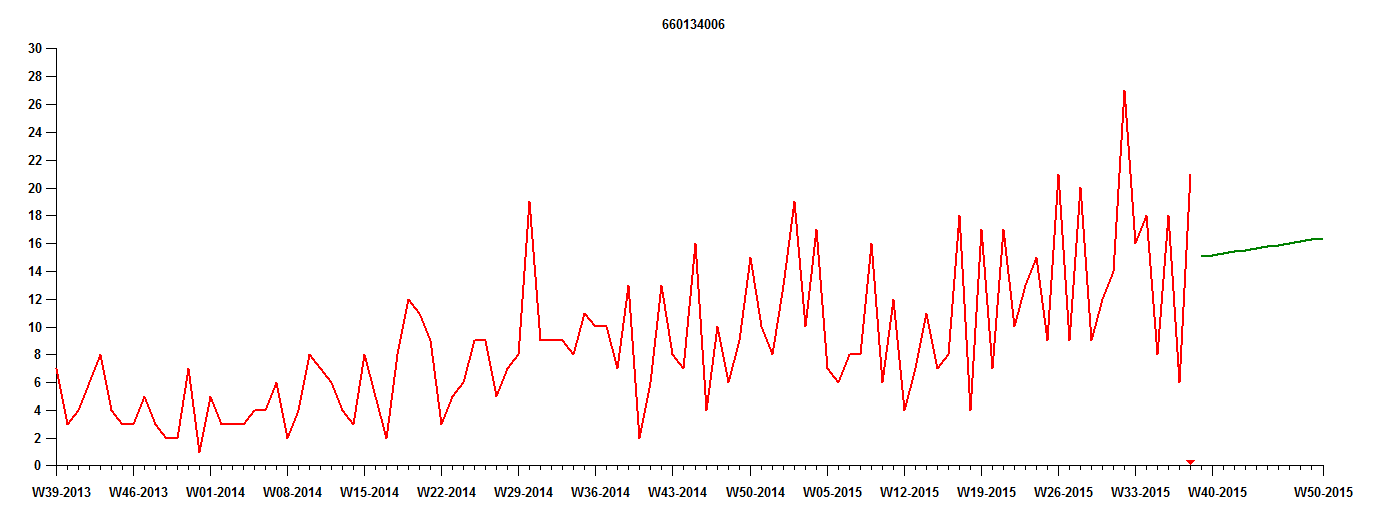
Forecasting can be quick, easy and dead accurate – as long as the world is simple. If demand for your product is 10 units every week, month after month, you can make very accurate forecasts. But life is not quite like that. If you’re lucky and life is almost like that – maybe weekly demand is more like {10, 9, 10, 8, 12, 10, 10…} — you can still make very accurate forecast and just make minor adjustments around the edges. But if life is as it more often is – maybe weekly demand looks like {0, 0, 7, 0, 0, 0, 23, 0 …} – demand forecasting is difficult indeed. The key distinction is demand variability: it’s the zigging and zagging that creates the pain.

Safety Stock Takes Over Where Forecasting Leaves Off


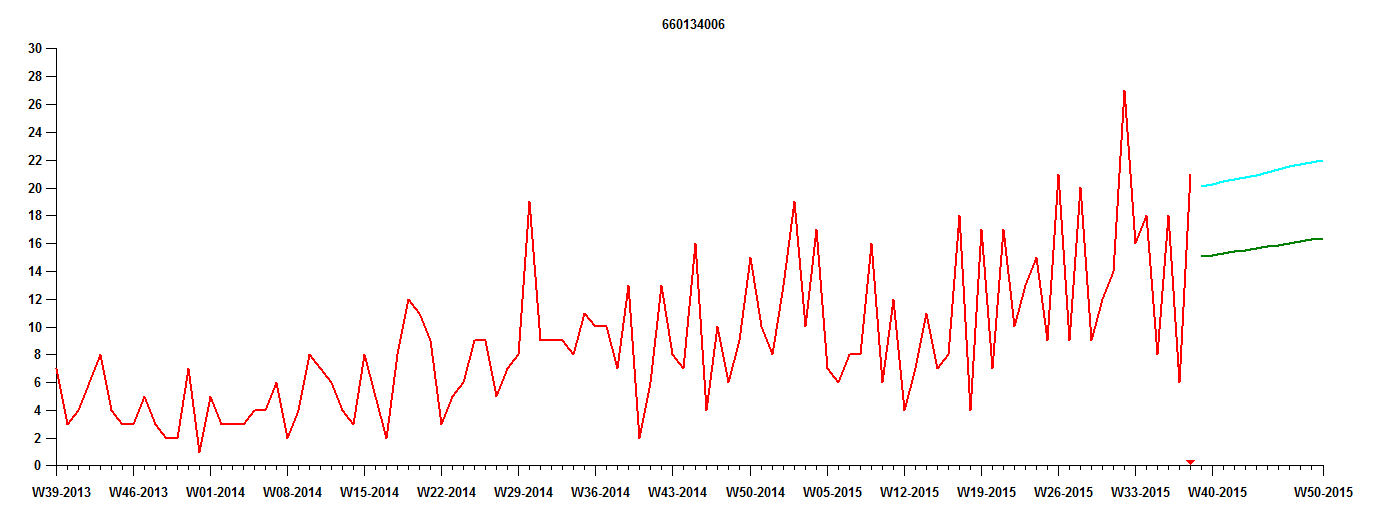
Statistical forecasting methods are an important part of the solution. They let you squeeze as much advantage as possible from the historical patterns of demand your company has recorded for each item. The job of forecasts is to describe what is typical, which provides the base on which to cope with randomness in demand. Statistical forecasting techniques work by finding “big picture” features in demand records, such as trend and seasonality, then projecting those into the future. They all implicitly assume that whatever patterns exist now will persist, so 5% growth will continue, and July demand will always be 20% higher than February demand. To get to that point, statistical forecasting methods use some form of averaging to smother the “noise” in the demand history.

But then the rest of the job falls on inventory management, because the atypical, random component of future demand will still be a hassle in the future. This inevitable level of uncertainty has to be handled by the “shock-absorber” called safety stock.

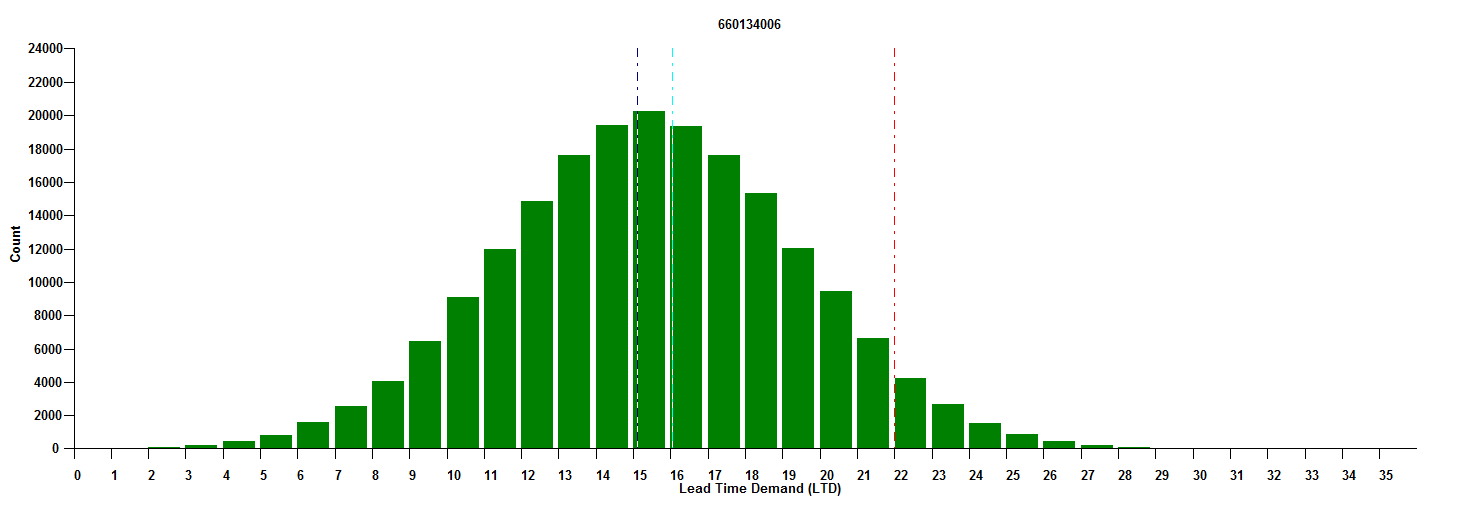
The same methods that produce forecasts of trend and/or seasonality can be used to estimate the amount of forecast error. This has to be done carefully using a method called “holdout analysis”.  It works like this. Suppose you have 365 observations of daily demand for Item X, which has a replenishment lead time of 10 days. You want to know how many units will be demanded over some future 10-day period. You might input the first 305 days of demand history into the forecasting technique and get forecasts for the next 10 days, days 306-315.

The answer gives you one estimate of the 10-day total demand. Importantly, it also gives you one estimate of the variability around that forecast, i.e., the forecast error, the difference between what actually happened in days 306-315 and what was forecasted. Now you can repeat the process, this time using the first 306 days to forecast the next 10, the first 307 days to forecast the next 10, etc. You end up with 52 honest estimates of the variability of total demand over a 10-day lead time. Suppose 95% of those estimates are less than 28 units. Then 28 units would be a pretty safe safety stock to add to the forecast, since you will run into shortages only 5% of the time.

Modern statistical software does these calculations automatically. It can ease at least one of the chronic headaches of inventory management by helping you cope with demand variability.

Leave a Comment

Related Posts

Constructive Play with Digital Twins

Constructive Play with Digital Twins

Those of you who track hot topics will be familiar with the term “digital twin.” Those who have been too busy with work may want to read on and catch up. While there are several definitions of digital twin, here’s one that works well: A digital twin is a dynamic virtual copy of a physical asset, process, system, or environment that looks like and behaves identically to its real-world counterpart. A digital twin ingests data and replicates processes so you can predict possible performance outcomes and issues that the real-world product might undergo.

Direct to the Brain of the Boss – Inventory Analytics and Reporting

Direct to the Brain of the Boss – Inventory Analytics and Reporting

In this blog, the spotlight is cast on the software that creates reports for management, the silent hero that translates the beauty of furious calculations into actionable reports. Watch as the calculations, intricately guided by planners utilizing our software, seamlessly converge into Smart Operational Analytics (SOA) reports, dividing five key areas: inventory analysis, inventory performance, inventory trending, supplier performance, and demand anomalies.

How Are We Doing? KPI’s and KPP’s

How Are We Doing? KPI’s and KPP’s

Dealing with the day-to-day of inventory management can keep you busy. But you know you have to get your head up now and then to see where you’re heading. For that, your inventory software should show you metrics – and not just one, but a full set of metrics or KPI’s – Key Performance Indicators.

Recent Posts

  • Smart Software is in the process of adapting our products to help you cope with your own irregular opsIrregular Operations
    This blog is about “irregular operations.” Smart Software is in the process of adapting our products to help you cope with your own irregular ops. This is a preview. […]
  • Epicor AI Forecasting and Inventory Technology Combined with Planner Knowledge for InsightsSmart Software to Present at Epicor Insights 2024
    Smart Software will present at this year's Epicor Insights event in Nashville. If you plan to attend this year, please join us at booth #13 or #501, and learn more about Epicor Smart Inventory Planning and Optimization. . […]
  • Looking for Trouble in Your Inventory DataLooking for Trouble in Your Inventory Data
    In this video blog, the spotlight is on a critical aspect of inventory management: the analysis and interpretation of inventory data. The focus is specifically on a dataset from a public transit agency detailing spare parts for buses. […]
  • BAF Case Study SIOP planning Distribution CenterBig Ass Fans Turns to Smart Software as Demand Heats Up
    Big Ass Fans is the best-selling big fan manufacturer in the world, delivering comfort to spaces where comfort seems impossible. BAF had a problem: how to reliably plan production to meet demand. BAF was experiencing a gap between bookings forecasts vs. shipments, and this was impacting revenue and customer satisfaction BAF turned to Smart Software for help. […]
  • The Cost of Doing nothing with your inventory Planning SystemsThe Cost of Spreadsheet Planning
    Companies that depend on spreadsheets for demand planning, forecasting, and inventory management are often constrained by the spreadsheet’s inherent limitations. This post examines the drawbacks of traditional inventory management approaches caused by spreadsheets and their associated costs, contrasting these with the significant benefits gained from embracing state-of-the-art planning technologies. […]

    Inventory Optimization for Manufacturers, Distributors, and MRO

    • Why MRO Businesses Need Add-on Service Parts Planning & Inventory SoftwareWhy MRO Businesses Need Add-on Service Parts Planning & Inventory Software
      MRO organizations exist in a wide range of industries, including public transit, electrical utilities, wastewater, hydro power, aviation, and mining. To get their work done, MRO professionals use Enterprise Asset Management (EAM) and Enterprise Resource Planning (ERP) systems. These systems are designed to do a lot of jobs. Given their features, cost, and extensive implementation requirements, there is an assumption that EAM and ERP systems can do it all. In this post, we summarize the need for add-on software that addresses specialized analytics for inventory optimization, forecasting, and service parts planning. […]
    • Spare-parts-demand-forecasting-a-different-perspective-for-planning-service-partsThe Forecast Matters, but Maybe Not the Way You Think
      True or false: The forecast doesn't matter to spare parts inventory management. At first glance, this statement seems obviously false. After all, forecasts are crucial for planning stock levels, right? It depends on what you mean by a “forecast”. If you mean an old-school single-number forecast (“demand for item CX218b will be 3 units next week and 6 units the week after”), then no. If you broaden the meaning of forecast to include a probability distribution taking account of uncertainties in both demand and supply, then yes. […]
    • Whyt MRO Businesses Should Care about Excess InventoryWhy MRO Businesses Should Care About Excess Inventory
      Do MRO companies genuinely prioritize reducing excess spare parts inventory? From an organizational standpoint, our experience suggests not necessarily. Boardroom discussions typically revolve around expanding fleets, acquiring new customers, meeting service level agreements (SLAs), modernizing infrastructure, and maximizing uptime. In industries where assets supported by spare parts cost hundreds of millions or generate significant revenue (e.g., mining or oil & gas), the value of the inventory just doesn’t raise any eyebrows, and organizations tend to overlook massive amounts of excessive inventory. […]
    • Top Differences between Inventory Planning for Finished Goods and for MRO and Spare PartsTop Differences Between Inventory Planning for Finished Goods and for MRO and Spare Parts
      In today’s competitive business landscape, companies are constantly seeking ways to improve their operational efficiency and drive increased revenue. Optimizing service parts management is an often-overlooked aspect that can have a significant financial impact. Companies can improve overall efficiency and generate significant financial returns by effectively managing spare parts inventory. This article will explore the economic implications of optimized service parts management and how investing in Inventory Optimization and Demand Planning Software can provide a competitive advantage. […]

      Inaccurate data, raw material shortages, suppliers with long lead times in far-away countries can affect Demand. Cloud computing companies with unique server and hardware parts, e-commerce, online retailers, home and office supply companies, onsite furniture, power utilities, intensive assets maintenance or warehousing for water supply companies have increased their activity during the pandemic. Garages selling car parts and truck parts, pharmaceuticals, healthcare or medical supply manufacturers and safety product suppliers are dealing with increasing demand. Delivery service companies, cleaning services, liquor stores and canned or jarred goods warehouses, home improvement stores, gardening suppliers, yard care companies, hardware, kitchen and baking supplies stores, home furniture suppliers with high demand are facing stockouts, long lead times, inventory shortage costs, higher operating costs and ordering costs.

      The 3 levels of forecasting: Point forecasts, Interval forecasts, Probability forecasts
      }

      The Smart Forecaster

       Pursuing best practices in demand planning,

      forecasting and inventory optimization

      Most demand forecasts are partial or incomplete: They provide only one single number: the most likely value of future demand. This is called a point forecast. Usually, the point forecast estimates the average value of future demand.  Interval forecasts provide an estimate of the possible future range of demand (i.e. demand has a 90% chance of being between 50 – 100 units).  Probabilistic forecasts take it a step further and provide additional information.  Knowing more is always better than knowing less and the probabilistic forecast provides that extra information so crucial for inventory management. This video blog by Dr. Thomas Willemain explains each type of forecast and the advantages of probabilistic forecasting.


      [inbound_button font_size=”20″ color=”#00a429″ text_color=”#ffffff” icon=”” url=”http://www.screencast.com/t/Ut4I5dOY8″ width=”” target=”_blank”]Watch Now[/inbound_button]


      Point forecast (green) shows what is most likely to happen.  The Interval Forecast shows the range (blue) of possibilities.


      Probability Forecast shows the probability of each value occurring


      Leave a Comment

      Related Posts

      Constructive Play with Digital Twins

      Constructive Play with Digital Twins

      Those of you who track hot topics will be familiar with the term “digital twin.” Those who have been too busy with work may want to read on and catch up. While there are several definitions of digital twin, here’s one that works well: A digital twin is a dynamic virtual copy of a physical asset, process, system, or environment that looks like and behaves identically to its real-world counterpart. A digital twin ingests data and replicates processes so you can predict possible performance outcomes and issues that the real-world product might undergo.

      Direct to the Brain of the Boss – Inventory Analytics and Reporting

      Direct to the Brain of the Boss – Inventory Analytics and Reporting

      In this blog, the spotlight is cast on the software that creates reports for management, the silent hero that translates the beauty of furious calculations into actionable reports. Watch as the calculations, intricately guided by planners utilizing our software, seamlessly converge into Smart Operational Analytics (SOA) reports, dividing five key areas: inventory analysis, inventory performance, inventory trending, supplier performance, and demand anomalies.

      How Are We Doing? KPI’s and KPP’s

      How Are We Doing? KPI’s and KPP’s

      Dealing with the day-to-day of inventory management can keep you busy. But you know you have to get your head up now and then to see where you’re heading. For that, your inventory software should show you metrics – and not just one, but a full set of metrics or KPI’s – Key Performance Indicators.

      Recent Posts

      • Smart Software is in the process of adapting our products to help you cope with your own irregular opsIrregular Operations
        This blog is about “irregular operations.” Smart Software is in the process of adapting our products to help you cope with your own irregular ops. This is a preview. […]
      • Epicor AI Forecasting and Inventory Technology Combined with Planner Knowledge for InsightsSmart Software to Present at Epicor Insights 2024
        Smart Software will present at this year's Epicor Insights event in Nashville. If you plan to attend this year, please join us at booth #13 or #501, and learn more about Epicor Smart Inventory Planning and Optimization. . […]
      • Looking for Trouble in Your Inventory DataLooking for Trouble in Your Inventory Data
        In this video blog, the spotlight is on a critical aspect of inventory management: the analysis and interpretation of inventory data. The focus is specifically on a dataset from a public transit agency detailing spare parts for buses. […]
      • BAF Case Study SIOP planning Distribution CenterBig Ass Fans Turns to Smart Software as Demand Heats Up
        Big Ass Fans is the best-selling big fan manufacturer in the world, delivering comfort to spaces where comfort seems impossible. BAF had a problem: how to reliably plan production to meet demand. BAF was experiencing a gap between bookings forecasts vs. shipments, and this was impacting revenue and customer satisfaction BAF turned to Smart Software for help. […]
      • The Cost of Doing nothing with your inventory Planning SystemsThe Cost of Spreadsheet Planning
        Companies that depend on spreadsheets for demand planning, forecasting, and inventory management are often constrained by the spreadsheet’s inherent limitations. This post examines the drawbacks of traditional inventory management approaches caused by spreadsheets and their associated costs, contrasting these with the significant benefits gained from embracing state-of-the-art planning technologies. […]

        Inventory Optimization for Manufacturers, Distributors, and MRO

        • Why MRO Businesses Need Add-on Service Parts Planning & Inventory SoftwareWhy MRO Businesses Need Add-on Service Parts Planning & Inventory Software
          MRO organizations exist in a wide range of industries, including public transit, electrical utilities, wastewater, hydro power, aviation, and mining. To get their work done, MRO professionals use Enterprise Asset Management (EAM) and Enterprise Resource Planning (ERP) systems. These systems are designed to do a lot of jobs. Given their features, cost, and extensive implementation requirements, there is an assumption that EAM and ERP systems can do it all. In this post, we summarize the need for add-on software that addresses specialized analytics for inventory optimization, forecasting, and service parts planning. […]
        • Spare-parts-demand-forecasting-a-different-perspective-for-planning-service-partsThe Forecast Matters, but Maybe Not the Way You Think
          True or false: The forecast doesn't matter to spare parts inventory management. At first glance, this statement seems obviously false. After all, forecasts are crucial for planning stock levels, right? It depends on what you mean by a “forecast”. If you mean an old-school single-number forecast (“demand for item CX218b will be 3 units next week and 6 units the week after”), then no. If you broaden the meaning of forecast to include a probability distribution taking account of uncertainties in both demand and supply, then yes. […]
        • Whyt MRO Businesses Should Care about Excess InventoryWhy MRO Businesses Should Care About Excess Inventory
          Do MRO companies genuinely prioritize reducing excess spare parts inventory? From an organizational standpoint, our experience suggests not necessarily. Boardroom discussions typically revolve around expanding fleets, acquiring new customers, meeting service level agreements (SLAs), modernizing infrastructure, and maximizing uptime. In industries where assets supported by spare parts cost hundreds of millions or generate significant revenue (e.g., mining or oil & gas), the value of the inventory just doesn’t raise any eyebrows, and organizations tend to overlook massive amounts of excessive inventory. […]
        • Top Differences between Inventory Planning for Finished Goods and for MRO and Spare PartsTop Differences Between Inventory Planning for Finished Goods and for MRO and Spare Parts
          In today’s competitive business landscape, companies are constantly seeking ways to improve their operational efficiency and drive increased revenue. Optimizing service parts management is an often-overlooked aspect that can have a significant financial impact. Companies can improve overall efficiency and generate significant financial returns by effectively managing spare parts inventory. This article will explore the economic implications of optimized service parts management and how investing in Inventory Optimization and Demand Planning Software can provide a competitive advantage. […]

          The Advantages of Probability Forecasting

          }

          The Smart Forecaster

           Pursuing best practices in demand planning,

          forecasting and inventory optimization

          Most demand forecasts are partial or incomplete: They provide only one single number: the most likely value of future demand. This is called a point forecast. Usually, the point forecast estimates the average value of future demand.

          Much more useful is a forecast of full probability distribution of demand at any future time. This is more commonly referred to as probability forecasting and is much more useful.

          The Average is Not the Answer


          The one advantage of a point forecast is its simplicity. If your ERP system is also simple, the point forecast fills in the one number needed by the ERP system to do workforce scheduling or raw material purchases.

          The disadvantage of a point forecast is that it is too simple. It ignores additional information in an item’s demand history that can give you a more complete picture of how demand might unfold: a probability forecast.

          Going Beyond the Average: Probability Forecasting


          While the point forecast provides limited information, e.g., “The most likely demand next month is 15 units”, the probability forecast adds crucial information, e.g., “There is a 20% chance that demand will exceed 28 units and a 10% chance that it will be less than 5 units”.

          This information lets you do risk assessment and contingency planning. Contingency planning is necessary because the point forecast usually has only a small chance of actually being correct. A probability forecast may also say “The chance of demand being 15 units is only 10%, even though it is the single most likely value.” In other words, there is a 90% chance that the point forecast is wrong. This kind of error is not a mistake in the forecasting calculations: it is the reality of dealing with demand volatility. It might better be called an “uncertainty” than an “error”.

          An operations manager can use the extra information in a probability forecast in both informal and formal ways. Informally, even if an ERP system requires a single-number forecast as input, a wise manager will want to have some clue about the risks associated with that point forecast, i.e., its margin of error. So a forecast of 15 ± 1 unit is a lot safer than a forecast of 15 ± 10. The ± part is a compression of a probabilistic forecast. Figure 1 below shows an item’s demand history (red line), point forecasts for the next 12 months (green line) and their margins of error (cyan lines). The lowest forecast of about 3,300 units occurs in June, but the actual demand might be as much as 800 units higher or lower.

          Bonus: Application to Inventory Management


          Inventory management requires that you balance item availability against the inventory cost. It turns out that knowing the full probability distribution of demand over a replenishment lead time is essential for setting reorder points (also called mins) on a rational, scientific basis. Figure 2 shows a probability forecast of total demand during the 33 week replenishment lead time for a certain spare part. While the average lead time demand is 3 units, the most likely demand is zero, and a reorder point of 14 is needed to insure that the chance of stocking out is only 1%. Once again, the average is not the answer.

          Knowing more is always better than knowing less and the probability forecast provides that extra bit of crucial information. Software has been able to supply a point forecast for over 40 years, but modern software can do better and provide the whole picture.


          Figure 1: The red line shows the demand history of a finished good. The green line shows the point forecasts for the next 12 months. The blue lines indicate the margins of error in the 12 point forecasts.


          Figure 2: A probabilistic forecast of demand for a spare part over a 33 week replenishment lead time. The most likely demand is zero, the average demand is 3, but a reorder point of 14 units is required to have only a 1% chance of stock out.

          Leave a Comment

          Related Posts

          Constructive Play with Digital Twins

          Constructive Play with Digital Twins

          Those of you who track hot topics will be familiar with the term “digital twin.” Those who have been too busy with work may want to read on and catch up. While there are several definitions of digital twin, here’s one that works well: A digital twin is a dynamic virtual copy of a physical asset, process, system, or environment that looks like and behaves identically to its real-world counterpart. A digital twin ingests data and replicates processes so you can predict possible performance outcomes and issues that the real-world product might undergo.

          Direct to the Brain of the Boss – Inventory Analytics and Reporting

          Direct to the Brain of the Boss – Inventory Analytics and Reporting

          In this blog, the spotlight is cast on the software that creates reports for management, the silent hero that translates the beauty of furious calculations into actionable reports. Watch as the calculations, intricately guided by planners utilizing our software, seamlessly converge into Smart Operational Analytics (SOA) reports, dividing five key areas: inventory analysis, inventory performance, inventory trending, supplier performance, and demand anomalies.

          How Are We Doing? KPI’s and KPP’s

          How Are We Doing? KPI’s and KPP’s

          Dealing with the day-to-day of inventory management can keep you busy. But you know you have to get your head up now and then to see where you’re heading. For that, your inventory software should show you metrics – and not just one, but a full set of metrics or KPI’s – Key Performance Indicators.

          Recent Posts

          • Smart Software is in the process of adapting our products to help you cope with your own irregular opsIrregular Operations
            This blog is about “irregular operations.” Smart Software is in the process of adapting our products to help you cope with your own irregular ops. This is a preview. […]
          • Epicor AI Forecasting and Inventory Technology Combined with Planner Knowledge for InsightsSmart Software to Present at Epicor Insights 2024
            Smart Software will present at this year's Epicor Insights event in Nashville. If you plan to attend this year, please join us at booth #13 or #501, and learn more about Epicor Smart Inventory Planning and Optimization. . […]
          • Looking for Trouble in Your Inventory DataLooking for Trouble in Your Inventory Data
            In this video blog, the spotlight is on a critical aspect of inventory management: the analysis and interpretation of inventory data. The focus is specifically on a dataset from a public transit agency detailing spare parts for buses. […]
          • BAF Case Study SIOP planning Distribution CenterBig Ass Fans Turns to Smart Software as Demand Heats Up
            Big Ass Fans is the best-selling big fan manufacturer in the world, delivering comfort to spaces where comfort seems impossible. BAF had a problem: how to reliably plan production to meet demand. BAF was experiencing a gap between bookings forecasts vs. shipments, and this was impacting revenue and customer satisfaction BAF turned to Smart Software for help. […]
          • The Cost of Doing nothing with your inventory Planning SystemsThe Cost of Spreadsheet Planning
            Companies that depend on spreadsheets for demand planning, forecasting, and inventory management are often constrained by the spreadsheet’s inherent limitations. This post examines the drawbacks of traditional inventory management approaches caused by spreadsheets and their associated costs, contrasting these with the significant benefits gained from embracing state-of-the-art planning technologies. […]

            Inventory Optimization for Manufacturers, Distributors, and MRO

            • Why MRO Businesses Need Add-on Service Parts Planning & Inventory SoftwareWhy MRO Businesses Need Add-on Service Parts Planning & Inventory Software
              MRO organizations exist in a wide range of industries, including public transit, electrical utilities, wastewater, hydro power, aviation, and mining. To get their work done, MRO professionals use Enterprise Asset Management (EAM) and Enterprise Resource Planning (ERP) systems. These systems are designed to do a lot of jobs. Given their features, cost, and extensive implementation requirements, there is an assumption that EAM and ERP systems can do it all. In this post, we summarize the need for add-on software that addresses specialized analytics for inventory optimization, forecasting, and service parts planning. […]
            • Spare-parts-demand-forecasting-a-different-perspective-for-planning-service-partsThe Forecast Matters, but Maybe Not the Way You Think
              True or false: The forecast doesn't matter to spare parts inventory management. At first glance, this statement seems obviously false. After all, forecasts are crucial for planning stock levels, right? It depends on what you mean by a “forecast”. If you mean an old-school single-number forecast (“demand for item CX218b will be 3 units next week and 6 units the week after”), then no. If you broaden the meaning of forecast to include a probability distribution taking account of uncertainties in both demand and supply, then yes. […]
            • Whyt MRO Businesses Should Care about Excess InventoryWhy MRO Businesses Should Care About Excess Inventory
              Do MRO companies genuinely prioritize reducing excess spare parts inventory? From an organizational standpoint, our experience suggests not necessarily. Boardroom discussions typically revolve around expanding fleets, acquiring new customers, meeting service level agreements (SLAs), modernizing infrastructure, and maximizing uptime. In industries where assets supported by spare parts cost hundreds of millions or generate significant revenue (e.g., mining or oil & gas), the value of the inventory just doesn’t raise any eyebrows, and organizations tend to overlook massive amounts of excessive inventory. […]
            • Top Differences between Inventory Planning for Finished Goods and for MRO and Spare PartsTop Differences Between Inventory Planning for Finished Goods and for MRO and Spare Parts
              In today’s competitive business landscape, companies are constantly seeking ways to improve their operational efficiency and drive increased revenue. Optimizing service parts management is an often-overlooked aspect that can have a significant financial impact. Companies can improve overall efficiency and generate significant financial returns by effectively managing spare parts inventory. This article will explore the economic implications of optimized service parts management and how investing in Inventory Optimization and Demand Planning Software can provide a competitive advantage. […]

              Getting “Halfway There” with Demand Planning

              The Smart Forecaster

               Pursuing best practices in demand planning,

              forecasting and inventory optimization

              Demand planning takes time and effort. It’s worth the effort to the extent that it actually helps you make what you need when you need it.

              But the job can be done well or poorly. We see many manufacturers stopping at the first level when they could easily go to the second level. And with a little more effort, they could go all the way to the third level, utilizing probabilistic modeling to convert demand planning results into an inventory optimization process.

              The First Level


              The first level is making a demand forecast using statistical methods. Figure 1 shows a first level effort: an item’s demand history (red line) and its expected 12-month forecast (green line).


               The first level: A forecast of expected demand over the next 12 months


              The forecast is bare bones. It only projects expected demand ignoring that demand is volatile and will inevitably create forecast error. (This is another example of an important maxim: “The Average is Not the Answer”). The forecast is as likely to be too high as it is to be too low, and there is no indication of forecast uncertainty accompanying the forecast. This means the planner has no estimate of the risk associated with committing to the forecast. Still, this forecast does provide a rational basis for production planning, personal scheduling, and raw materials purchase. So, it’s much better than guessing.

              The Second Level


              The second level takes explicit account of forecast uncertainty. Figure 2 shows a second level effort, known as a “percentile forecast”.

              Now we see an explicit indication of forecast uncertainty. The cyan line above the green forecast line represents the projected 90th percentile of monthly demand. That is, the demand in each future month has a 90% chance of falling at or below the cyan line. Put another way, there is a 10% chance of demand exceeding the cyan line in each month.

              This analysis is much more useful because it supports risk management. If it is important to assure sufficient supply of this item, then it makes sense to produce to the 90th percentile instead of to the expected forecast. After all, it’s a coin flip as to whether the expected forecast will result in enough production to meet monthly demand. This second level forecast is, in effect, a rough substitute for a careful inventory management process.


              A percentile forecast, where the cyan line estimates the 90th percentiles of monthly demand.


              Figure 2. A percentile forecast, where the cyan line estimates the 90th percentiles of monthly demand.

              Going All the Way to the Third Level


              Best practice is the Third Level, which uses demand planning as a foundation for completing a second task: explicit inventory optimization. Figure 3 shows the fundamental plot for the efficient management of our finished good, assuming it has a 1 month production lead time.


              Distribution of demand for finished good over its 1-month lead time


              Figure 3 shows the utilization of probabilistic forecasting and how much draw-down in finished good inventory might take place over a one month production lead time. The uncertainty in demand is apparent in the spread of the possible demand, from a low of 0 to a high of 35, with 15 units being the most likely value. The vertical red line at 22 indicates the “reorder point“ (or “min” or “trigger value”) corresponding to keeping the chance of stocking out while waiting for replenishment to a low 5%. When inventory drops to 22 or below, it is time to order more. The Third Level uses probabilistic demand forecasting with full exposure of forecast uncertainty to efficiently manage the stock of the finished product.

              To Sum Up


              Forecasting the most likely demand for an item is a useful first step. It gets you halfway to where you want to be. But it provides an incomplete guide to planning because it ignores demand volatility and the forecast uncertainty that it creates. Adding a cushion to the demand forecast gets you further along, because it lessen the risk that a jump in demand will leave you short of product. This cushion can be calculated by probabilistic forecasting approaches that forecasts a high percentile of the distribution of future demand. And if you want to take one step further, you can feed forecasts of the demand distribution over a lead time to calculate reorder points (mins) to ensure that you have an acceptably low level of stock-out risk.

              Given what modern forecasting technology can do for you, why would you want to stop halfway to your goal?

              Leave a Comment

              Related Posts

              Constructive Play with Digital Twins

              Constructive Play with Digital Twins

              Those of you who track hot topics will be familiar with the term “digital twin.” Those who have been too busy with work may want to read on and catch up. While there are several definitions of digital twin, here’s one that works well: A digital twin is a dynamic virtual copy of a physical asset, process, system, or environment that looks like and behaves identically to its real-world counterpart. A digital twin ingests data and replicates processes so you can predict possible performance outcomes and issues that the real-world product might undergo.

              Direct to the Brain of the Boss – Inventory Analytics and Reporting

              Direct to the Brain of the Boss – Inventory Analytics and Reporting

              In this blog, the spotlight is cast on the software that creates reports for management, the silent hero that translates the beauty of furious calculations into actionable reports. Watch as the calculations, intricately guided by planners utilizing our software, seamlessly converge into Smart Operational Analytics (SOA) reports, dividing five key areas: inventory analysis, inventory performance, inventory trending, supplier performance, and demand anomalies.

              How Are We Doing? KPI’s and KPP’s

              How Are We Doing? KPI’s and KPP’s

              Dealing with the day-to-day of inventory management can keep you busy. But you know you have to get your head up now and then to see where you’re heading. For that, your inventory software should show you metrics – and not just one, but a full set of metrics or KPI’s – Key Performance Indicators.

              Recent Posts

              • Smart Software is in the process of adapting our products to help you cope with your own irregular opsIrregular Operations
                This blog is about “irregular operations.” Smart Software is in the process of adapting our products to help you cope with your own irregular ops. This is a preview. […]
              • Epicor AI Forecasting and Inventory Technology Combined with Planner Knowledge for InsightsSmart Software to Present at Epicor Insights 2024
                Smart Software will present at this year's Epicor Insights event in Nashville. If you plan to attend this year, please join us at booth #13 or #501, and learn more about Epicor Smart Inventory Planning and Optimization. . […]
              • Looking for Trouble in Your Inventory DataLooking for Trouble in Your Inventory Data
                In this video blog, the spotlight is on a critical aspect of inventory management: the analysis and interpretation of inventory data. The focus is specifically on a dataset from a public transit agency detailing spare parts for buses. […]
              • BAF Case Study SIOP planning Distribution CenterBig Ass Fans Turns to Smart Software as Demand Heats Up
                Big Ass Fans is the best-selling big fan manufacturer in the world, delivering comfort to spaces where comfort seems impossible. BAF had a problem: how to reliably plan production to meet demand. BAF was experiencing a gap between bookings forecasts vs. shipments, and this was impacting revenue and customer satisfaction BAF turned to Smart Software for help. […]
              • The Cost of Doing nothing with your inventory Planning SystemsThe Cost of Spreadsheet Planning
                Companies that depend on spreadsheets for demand planning, forecasting, and inventory management are often constrained by the spreadsheet’s inherent limitations. This post examines the drawbacks of traditional inventory management approaches caused by spreadsheets and their associated costs, contrasting these with the significant benefits gained from embracing state-of-the-art planning technologies. […]

                Inventory Optimization for Manufacturers, Distributors, and MRO

                • Why MRO Businesses Need Add-on Service Parts Planning & Inventory SoftwareWhy MRO Businesses Need Add-on Service Parts Planning & Inventory Software
                  MRO organizations exist in a wide range of industries, including public transit, electrical utilities, wastewater, hydro power, aviation, and mining. To get their work done, MRO professionals use Enterprise Asset Management (EAM) and Enterprise Resource Planning (ERP) systems. These systems are designed to do a lot of jobs. Given their features, cost, and extensive implementation requirements, there is an assumption that EAM and ERP systems can do it all. In this post, we summarize the need for add-on software that addresses specialized analytics for inventory optimization, forecasting, and service parts planning. […]
                • Spare-parts-demand-forecasting-a-different-perspective-for-planning-service-partsThe Forecast Matters, but Maybe Not the Way You Think
                  True or false: The forecast doesn't matter to spare parts inventory management. At first glance, this statement seems obviously false. After all, forecasts are crucial for planning stock levels, right? It depends on what you mean by a “forecast”. If you mean an old-school single-number forecast (“demand for item CX218b will be 3 units next week and 6 units the week after”), then no. If you broaden the meaning of forecast to include a probability distribution taking account of uncertainties in both demand and supply, then yes. […]
                • Whyt MRO Businesses Should Care about Excess InventoryWhy MRO Businesses Should Care About Excess Inventory
                  Do MRO companies genuinely prioritize reducing excess spare parts inventory? From an organizational standpoint, our experience suggests not necessarily. Boardroom discussions typically revolve around expanding fleets, acquiring new customers, meeting service level agreements (SLAs), modernizing infrastructure, and maximizing uptime. In industries where assets supported by spare parts cost hundreds of millions or generate significant revenue (e.g., mining or oil & gas), the value of the inventory just doesn’t raise any eyebrows, and organizations tend to overlook massive amounts of excessive inventory. […]
                • Top Differences between Inventory Planning for Finished Goods and for MRO and Spare PartsTop Differences Between Inventory Planning for Finished Goods and for MRO and Spare Parts
                  In today’s competitive business landscape, companies are constantly seeking ways to improve their operational efficiency and drive increased revenue. Optimizing service parts management is an often-overlooked aspect that can have a significant financial impact. Companies can improve overall efficiency and generate significant financial returns by effectively managing spare parts inventory. This article will explore the economic implications of optimized service parts management and how investing in Inventory Optimization and Demand Planning Software can provide a competitive advantage. […]

                  Smart Software Awarded National Science Foundation Innovation Research Grant

                  New research to improve service and spare parts planning for the multi-billion dollar aerospace, automotive, high tech, and utilities markets

                  Belmont, Mass., November 28, 2012 – Smart Software, Inc., provider of industry-leading demand forecasting, planning, and inventory optimization solutions, today announced that it has been awarded a Phase I Small Business Innovation Research (SBIR) grant from the National Science Foundation (NSF).  Smart Software will investigate new statistical methods to forecast intermittent demand, with the ultimate objective of helping enterprises worldwide reduce inventories by tens of billions of dollars.

                  The new research will build upon Smart Software’s patented solution for forecasting slow-moving or intermittent demand, developed with the support of a previous NSF grant.  The current method, commercialized as part of the company’s flagship product, SmartForecasts®, evaluates historical demand for each item and establishes the optimum level of inventory that will be required to achieve service level objectives.  The new research seeks to extend demand forecasting beyond individual products and parts, identifying and interpreting interactions across clusters of items whose demands fluctuate together.

                  The new forecasting capabilities will benefit customers in several significant ways:

                  • A more dynamic statistical model of parts will enable forecasts to better reflect a variety of external factors that include part usage by itself or in combination with other products, as well as the impact of macroeconomic and environmental factors.
                  • Research results will provide planners with a dynamic model of item usage, enabling planners to develop functional maps of the interrelationships of large numbers of parts. Knowing which parts have demands that co-vary can be useful in at least two ways. First, item managers can be assigned to work with coherent clusters rather than arbitrary collections of miscellaneous parts, and second, parts can be co-located in warehouses for more efficient storage and retrieval.
                  • Another benefit from this new approach will be improved forecasts of “aggregates” where intermittent demand is present, such as all items in a product line, or all items at a particular warehouse. Better forecasts of aggregate demand across groups of parts will also be useful for raw materials purchasing, as well as for financial planning when parts are a source of revenue.

                  According to Nelson Hartunian, president of Smart Software, “Any organization that builds or supports capital equipment experiences intermittent demand for some portion of its inventory. This grant is a terrific opportunity to impact one of the biggest forecasting challenges facing these organizations – accurately forecasting parts and optimizing inventories. Ultimately, the goal is to have the right part at the right place at the right time. The research we are undertaking will make this goal more achievable.”

                  The Small Business Innovation Research grant program from the National Science Foundation is extremely competitive. More than a thousand companies compete in a two-stage screening: one for intellectual merit, and the other for commercial potential. This Phase 1 grant is the third Smart Software has received.

                  About Smart Software, Inc.
                  Founded in 1981, Smart Software, Inc. is a leader in providing businesses with enterprise-wide demand forecasting, planning and inventory optimization solutions.  Smart Software’s flagship product, SmartForecasts, has thousands of users worldwide, including customers at mid-market enterprises and Fortune 500 companies, such as Abbott Laboratories, Mitsubishi, Siemens, Disney, Nestle, GE and The Coca-Cola Company.  SmartForecasts gives demand planners the tools to handle sales seasonality, promotions, new and aging products, multi-dimensional hierarchies, and intermittently demanded service parts and capital goods items.  It also provides inventory managers with accurate estimates of the optimal inventory and safety stock required to meet future orders and achieve desired service levels.  Smart Software is headquartered in Belmont, Massachusetts and can be found on the World Wide Web at www.smartsoftware.wpengine.com.

                  SmartForecasts is a registered trademark of Smart Software, Inc.  All other trademarks are the property of their respective owners.


                  For more information, please contact Smart Software, Inc., Four Hill Road, Belmont, MA 02478.
                  Phone: 1-800-SMART-99 (800-762-7899); FAX: 1-617-489-2748; E-mail: info@smartsoftware.wpengine.com