
Probabilistic scenarios are sequences of data points generated to represent potential real-world situations. Unlike scenarios in war games or other simulations, these are synthetic time series used as inputs to system models or as intuition-builders for decision-makers.
For instance, scenarios of future item demand can be fed into Monte Carlo simulation models of inventory control systems, thereby creating a virtual laboratory in which to explore the consequences of management decisions, such as changing reorder points and/or order quantities. In addition, plots of metrics like on-hand inventory or stockouts can help inventory planners deepen their “feel” for the randomness inherent in their operations.
Figure 1 shows daily demand scenarios generated from a single observed demand series recorded over one year. Note that the same data generating process can “look quite different” in detail from sample to sample. This mimics real life.
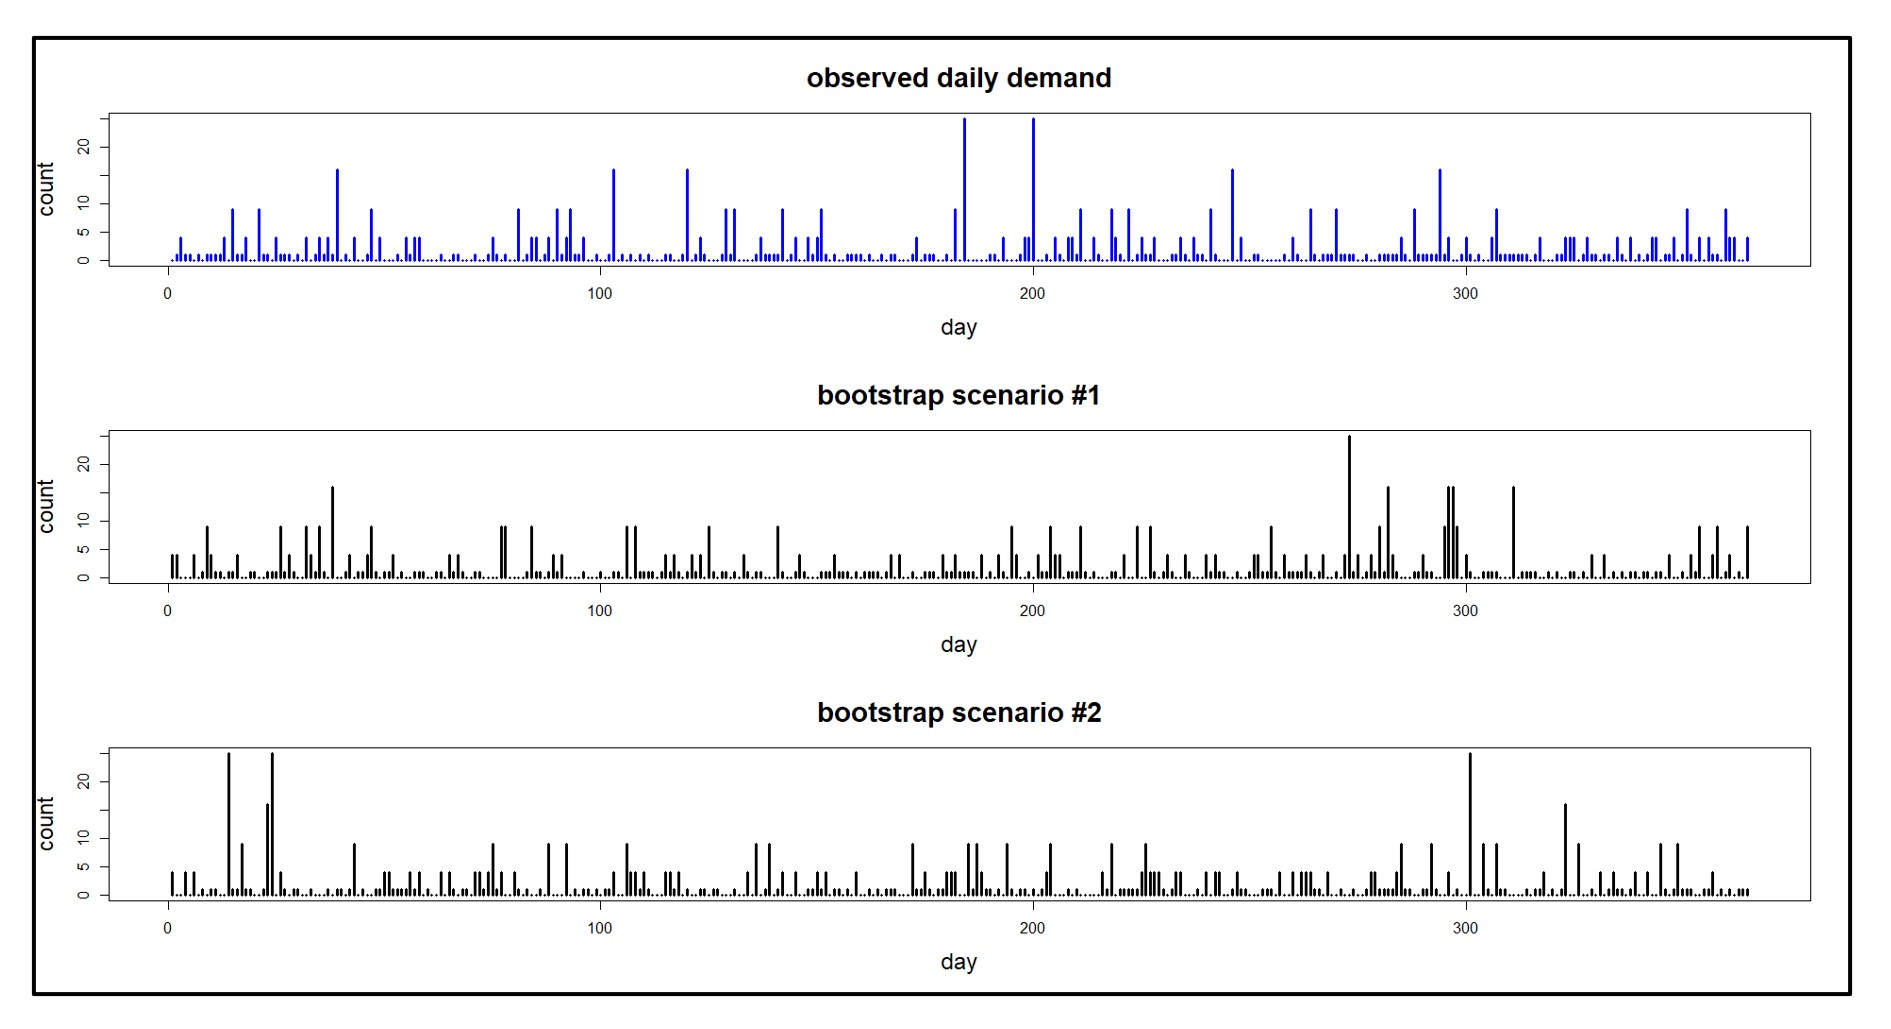
Figure 1: An observed demand sequence and demand scenarios derived from it.
Figure 2 shows two demand scenarios and their consequences for stock on hand in a particular inventory control system. The difference between the two inventory plots illustrates the degree to which randomness in demand dominates the problem. The top plot shows two episodes of stockout, while the bottom plot shows nine. Averaging over many scenarios will clarify the typical values of Key Performance Metrics (KPIs) such as the average number of stockouts associated with any choice of Reorder Point and Order Quantity (which are 10 and 25, respectively, in Figure 2.)
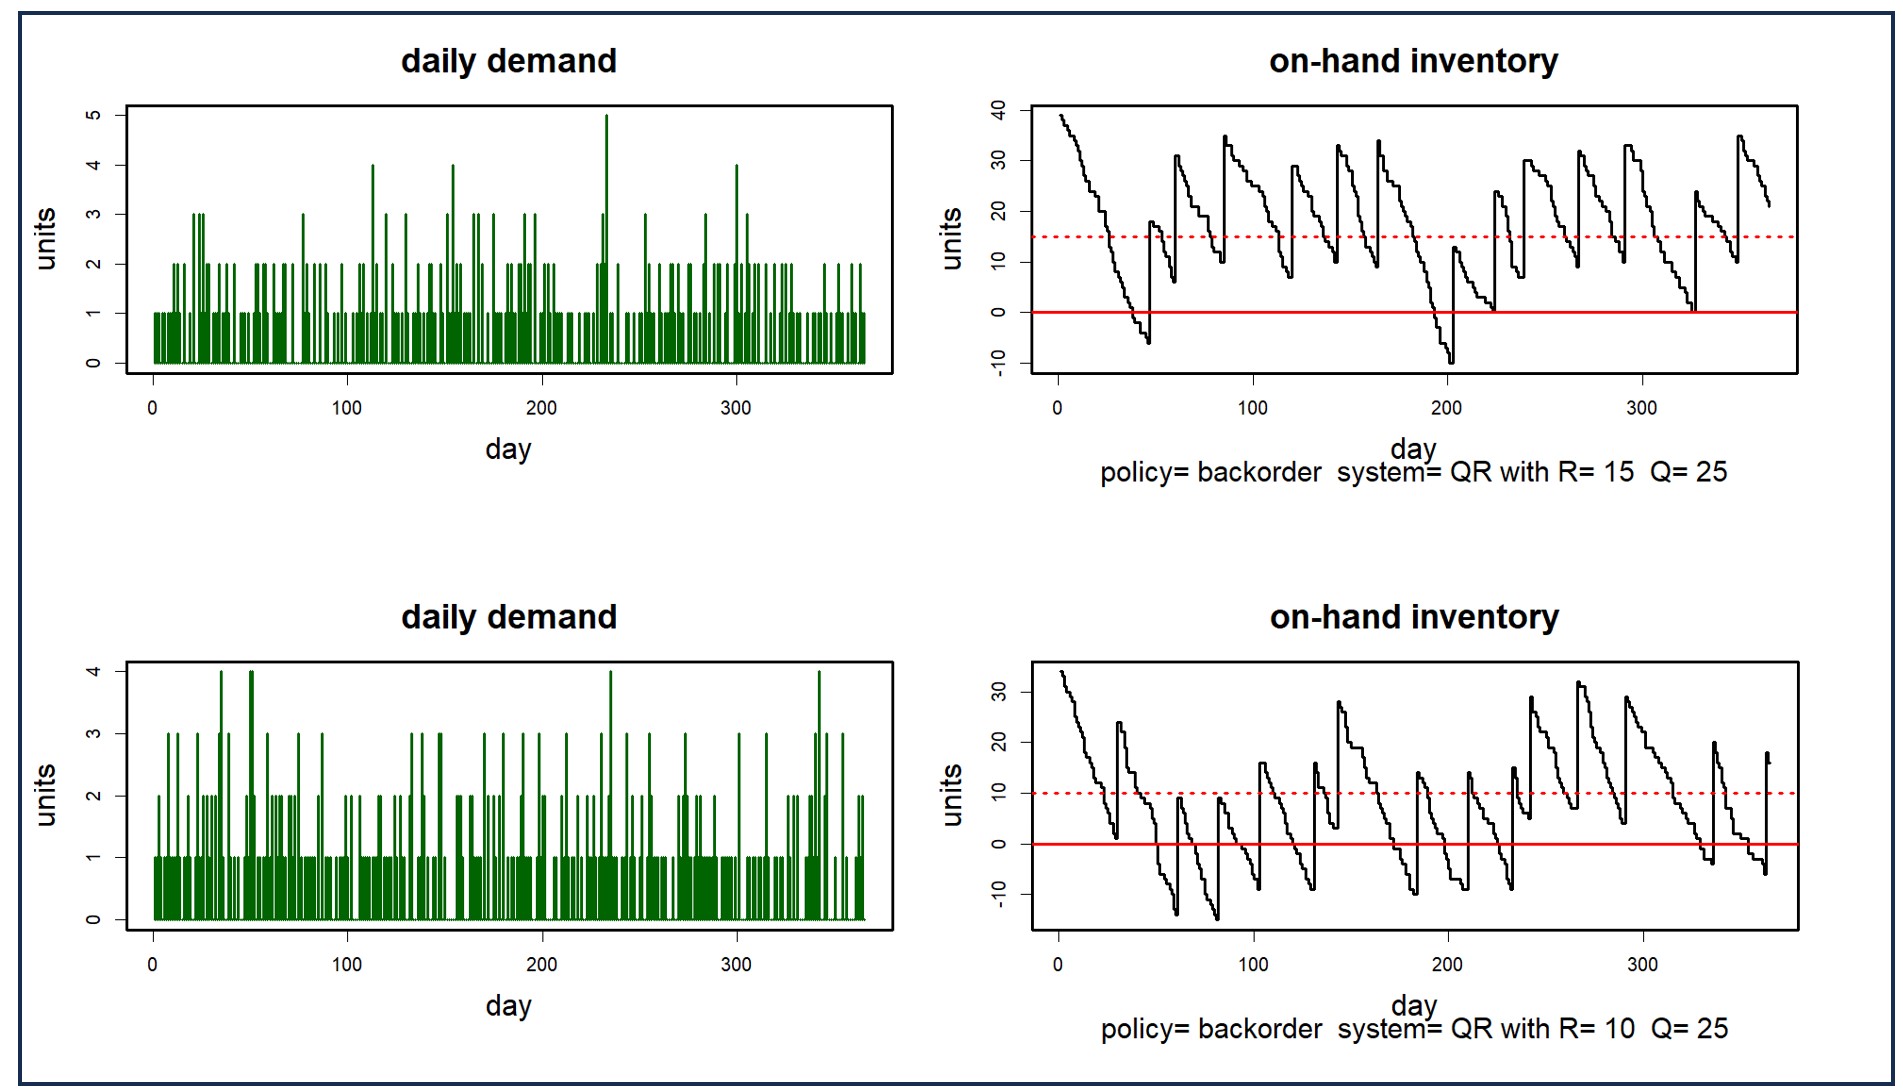
Figure 2: Two demand scenarios and their consequences for on-hand inventory
In this note, we’ll describe techniques for creating scenarios and list criteria for evaluating scenario generators.
Criteria for Scenarios
As we’ll see below, there are several ways to create scenarios. No matter the source, what criteria define a “good” scenario? There are four main criteria: fidelity, variety, quantity, and cost. Fidelity summarizes how accurately a scenario imitates real-world situations. High fidelity means the scenarios mirror actual events closely, providing a solid foundation for analysis and decision-making. Variety describes the diversity of scenarios a generator can create. A versatile generator can simulate a wide range of potential situations, allowing for a thorough exploration of possibilities and risks. Quantity refers to how many scenarios a generator can produce. A generator that can create a large number of scenarios provides ample data for analysis. Cost considers both the computational and human resources required to produce the scenarios. An efficient scenario generator balances quality with resource usage, ensuring the effort is justified by the value and accuracy of the outcomes.
Scenario Generation
Again, think of a scenario as a time series. How are scenarios created?
- Geppetto’s Workshop: This approach involves hand-crafting scenarios manually by experts. While it can yield high fidelity (realism), it is very resource-intensive and cannot easily generate variety, which requires a large number of scenarios.
- Groundhog Day: This method involves repeatedly using a single real-world situation as input. While it’s realistic by definition and cost-effective (no resources are used beyond recording the data), this approach lacks variety and so cannot accurately reflect the diversity of real-world scenarios.
- Parametric Models: Examples of parametric models are the classics studied in Statistics 101 classes: the Normal, exponential, Poisson, etc. The demand plots in Figure 2 are generated parametrically, being the squares of Poisson random variables. These models generate an unlimited number of low cost scenarios having good variety, but they may not always capture the complexity of real-world data, potentially compromising fidelity. When reality is more complicated, these models generate over-simplified scenarios.
- Non-Parametric Time Series Bootstraps: This approach can score well on all criteria: fidelity, variety, quantity, and cost. It’s a versatile method that excels in creating massive numbers of realistic scenarios. The synthetic demand histories in Figure 1 are simple bootstrap samples based on the observed values in the top graph. (For some nitty-gritty details about generating scenarios, see the links below.)
Exploiting Scenarios
Scenarios prove their worth in two ways: As inputs to decision making and as intuition-builders. For instance, when demand scenarios are used as inputs to simulation models, they enable stress testing and performance estimation for system design. Scenarios can also serve as intuition-builders for decision-makers or system operators. Their visual representation aids in developing insight into and appreciation for the risks involved in making operational decisions, be they for demand forecasting or inventory management.
Scenario-based analysis is very computer intensive, especially when the scenarios are generated by bootstrapping. At Smart Software, computation happens in the cloud. Imagine the computational load involved in determining reorder points and order quantities for each of tens of thousands of inventory items using hundreds or thousands of demand simulations for each item. Further imagine the software not only evaluating a specific proposed reorder point/order quantity pair but roaming over the entire “design space” of pairs to find the best pair of control parameters for each item. To make this practical, we take advantage of the parallel processing power of the cloud. Essentially, each inventory item is assigned its own computer to use in the calculations, so that all that computing can happen simultaneously rather than sequentially. Now we can cut loose and really get you the results you need.
Learning More
Those interested in further technical details and references can find more information here.
What Makes a Probabilistic Forecast?
Probabilistic Forecasting for Intermittent Demand