Leveraging ERP Planning BOMs with Smart IP&O to Forecast the Unforecastable

​In a highly configurable manufacturing environment, forecasting finished goods can become a complex and daunting task. The number of possible finished products will skyrocket when many components are interchangeable. A traditional MRP would force us to forecast every single finished product which can be unrealistic or even impossible. Several leading ERP solutions introduce the concept of the “Planning BOM”, which allows the use of forecasts at a higher level in the manufacturing process. In this article, we will discuss this functionality in ERP, and how you can take advantage of it with Smart Inventory Planning and Optimization (Smart IP&O) to get ahead of your demand in the face of this complexity.

Why Would I Need a Planning BOM?

Traditionally, each finished product or SKU would have a rigidly defined bill of materials. If we stock that product and want to plan around forecasted demand, we would forecast demand for those products and then feed MRP to blow this forecasted demand from the finished good level down to its components via the BOM.

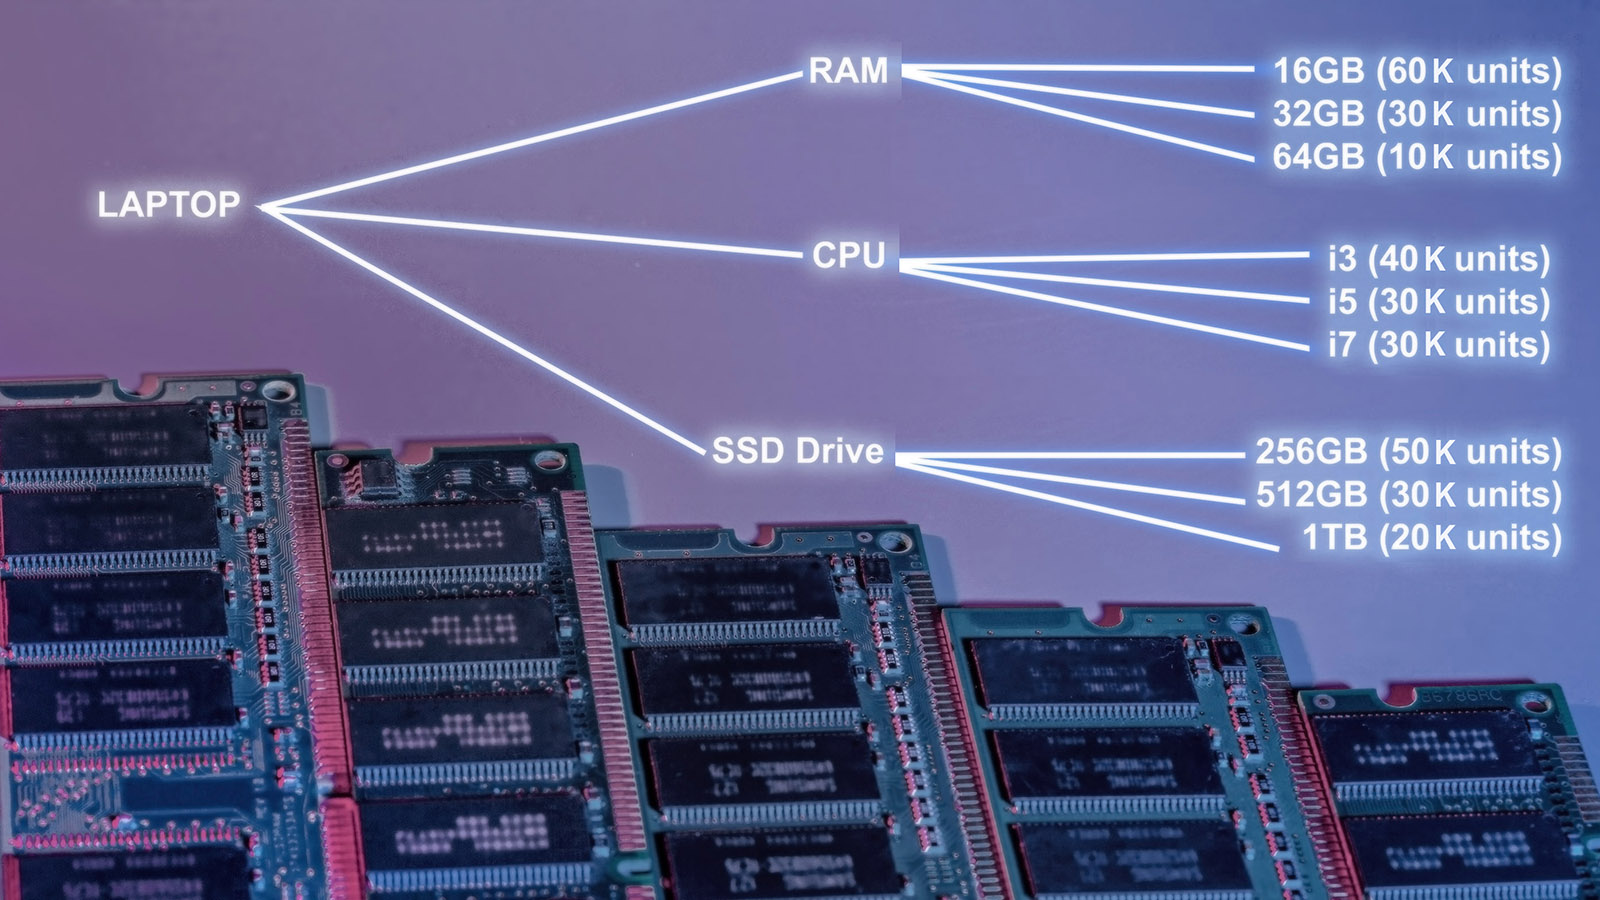
Many companies, however, offer highly configurable products where customers can select options on the product they are buying. As an example, recall the last time you bought a personal computer. You chose a brand and model, but from there, you were likely presented with options: what speed of CPU do you want? How much RAM do you want? What kind of hard drive and how much space? If that business wants to have these computers ready and available to ship to you in a reasonable time, suddenly they are no longer just anticipating demand for that model—they must forecast that model for every type of CPU, for all quantities of RAM, for all types of hard drive, and all possible combinations of those as well! For some manufacturers, these configurations can compound to hundreds or thousands of possible finished good permutations.

Planning BOM emphasizing the large numbers of permutations Laptops Factory Components

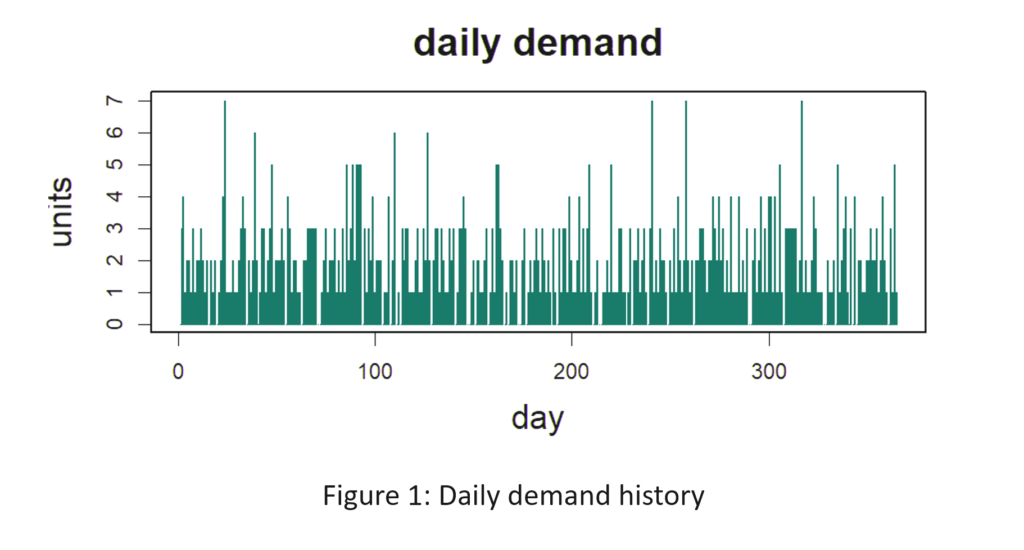
There may be so many possible customizations that the demand at the finished product level is completely unforecastable in a traditional sense. Thousands of those computers may sell every year, but for each possible configuration, the demand may be extremely low and sporadic—perhaps certain combinations sell once and never again.

This often forces these companies to plan reorder points and safety stock levels mostly at the component level, while largely reacting to firm demand at the finished good level via MRP. While this is a valid approach, it lacks a systematic way to leverage forecasts that may account for anticipated future activity such as promotions, upcoming projects, or sales opportunities. Forecasting at the “configured” level is effectively impossible, and trying to weave in these forecast assumptions at the component level isn’t feasible either.


Planning BOM Explained

This is where Planning BOMs come in. Perhaps the sales team is working a big b2b opportunity for that model, or there’s a planned promotion for Cyber Monday. While trying to work in those assumptions for every possible configuration isn’t realistic, doing it at the model level is totally doable—and tremendously valuable.

The Planning BOM can use a forecast at a higher level and then blow demand down based on predefined proportions for its possible components. For example, the computer manufacturer may know that most people opt for 16GB of RAM, and far fewer opt for the upgrades to 32 or 64. The planning BOM allows the organization to (for example) blow 60% of the demand down to the 16GB option, 30% to the 32GB option, and 10% to the 64GB option. They could do the same for CPUs, hard drives, or any other customizations available.  

Planning BOM Explained with computer random access memory ram close hd


The business can now focus their forecast at this model level, leaving the Planning BOM to figure out the component mix. Clearly, defining these proportions requires some thought, but Planning BOMs effectively allow businesses to forecast what would otherwise be unforecastable.


The Importance of a Good Forecast

Of course, we still need a good forecast to load into an ERP system. As explained in this article, while ERP  can import a forecast, it often cannot generate one and when it does it tends to require a great deal of hard to use configurations that don’t often get revisited resulting in inaccurate forecasts.  It is therefore up to the business to come up with their own sets of forecasts, often manually produced in Excel. Forecasting manually generally presents a number of challenges, including but not limited to:

  • The inability to identify demand patterns like seasonality or trend
  • Overreliance on customer or sales forecasts
  • Lack of accuracy or performance tracking

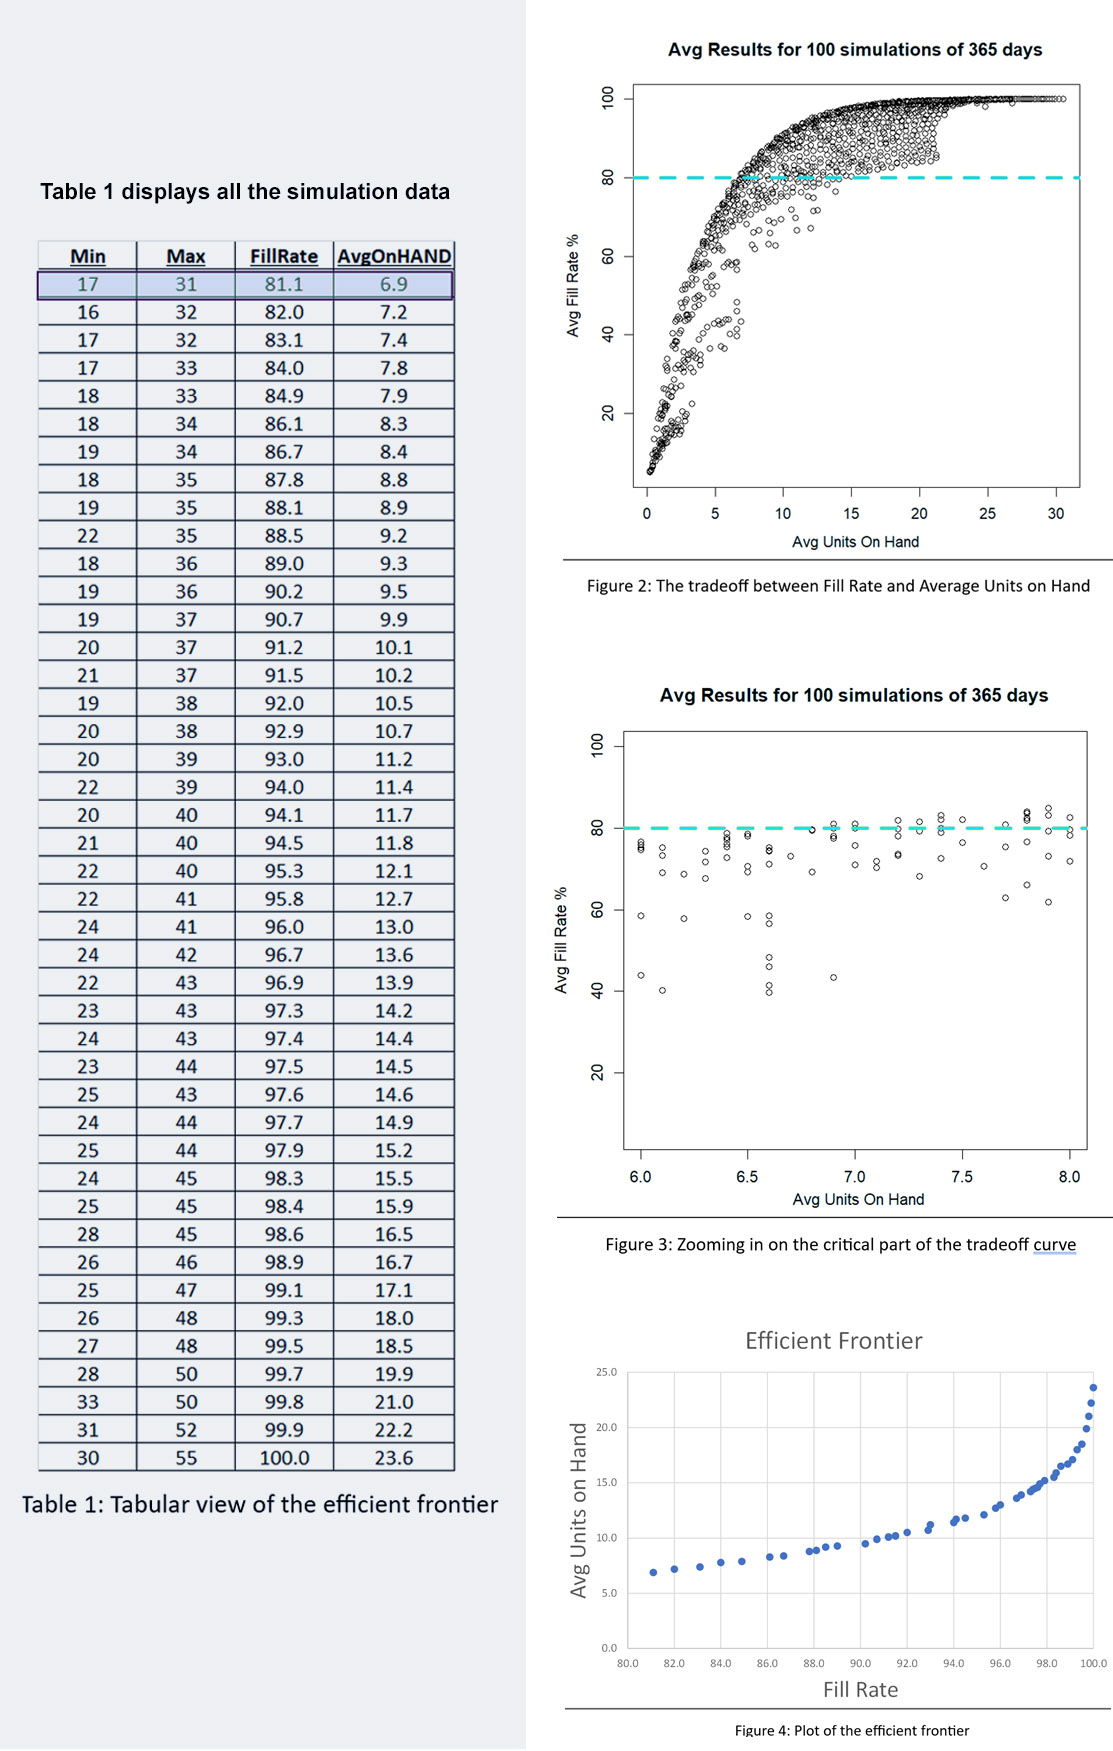
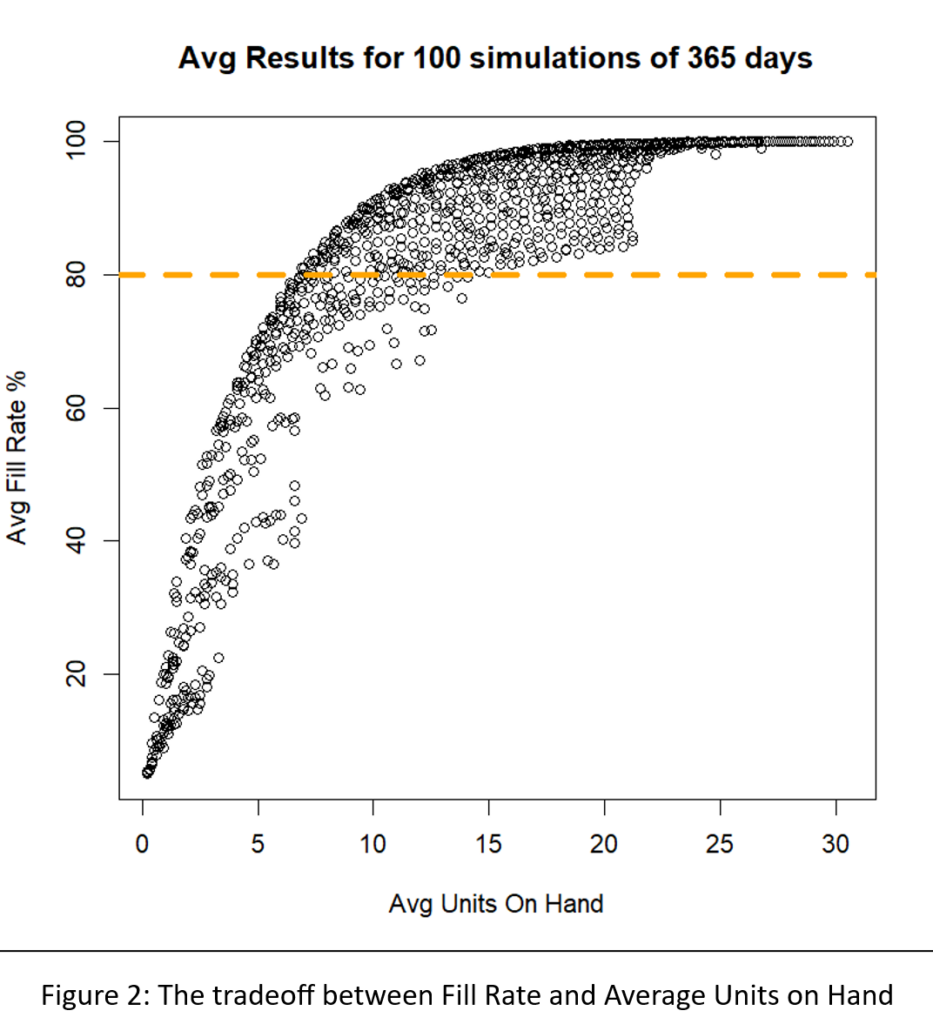
No matter how well configured the MRP is with your carefully considered Planning BOMs, a poor forecast means poor MRP output and mistrust in the system—garbage in, garbage out. Continuing along with the “computer company” example, without a systematic way of capturing key demand patterns and/or domain knowledge in the forecast, MRP can never see it.


Extend ERP  with Smart IP&O

Smart IP&O is designed to extend your ERP system with a number of integrated demand planning and inventory optimization solutions. For example, it can generate statistical forecasts automatically for large numbers of items, allows for intuitive forecast adjustments, tracks forecast accuracy, and ultimately allows you to generate true consensus-based forecasts to better anticipate the needs of your customers.

Thanks to highly flexible product hierarchies, Smart IP&O is perfectly suited to forecasting at the Planning BOM level so you can capture key patterns and incorporate business knowledge at the levels that matter most. Furthermore you can analyze and deploy optimal safety stock levels at any level of your BOM.


The Forecast Matters, but Maybe Not the Way You Think

True or false: The forecast doesn’t matter to spare parts inventory management.

At first glance, this statement seems obviously false. After all, forecasts are crucial for planning stock levels, right?

It depends on what you mean by a “forecast”. If you mean an old-school single-number forecast (“demand for item CX218b will be 3 units next week and 6 units the week after”), then no. If you broaden the meaning of forecast to include a probability distribution taking account of uncertainties in both demand and supply, then yes.

The key reality is that many items, especially spare and service parts, have unpredictable, intermittent demand. (Supplier lead times can also be erratic, especially when parts are sourced from a backlogged OEM.)  We have observed that while manufacturers and distributors typically experience intermittent demand on just 20% or more of their items the percentage grows to 80%+ for MRO based businesses.  This means historical data often show periods of zero demand interspersed with random periods of non-zero demand. Sometimes, these non-zero demands are as low as 1 or 2 units, while at other times, they unexpectedly spike to quantities several times larger than their average.

This isn’t like the kind of data usually faced by your peer “demand planners” in retail, consumer products, and food and beverage. Those folks usually deal with larger quantities having proportionately less randomness. And they can surf on prediction-enhancing features like trends and stable seasonal patterns. Instead, spare parts usage is much more random, throwing a monkey wrench into the planning process, even in the minority of cases in which there are detectable seasonal variations.

In the realm of intermittent demand, the best forecast available will significantly deviate from the actual demand. Unlike consumer products with medium to high volume and frequency, a service part’s forecast can miss the mark by hundreds of percentage points. A forecast of one or two units, on average, will always miss when the actual demand is zero. Even with advanced business intelligence or machine learning algorithms, the error in forecasting the non-zero demands will still be substantial.

Perhaps because of the difficulty of statistical forecasting in the inventory domain, inventory planning in practice often relies on intuition and planner knowledge. Unfortunately, this approach doesn’t scale across tens of thousands of parts. Intuition just cannot cope with the full range of demand and lead time possibilities, let alone accurately estimate the  probability of each possible scenario. Even if your company has one or two exceptional intuitive forecasters, personnel retirements and product line reorganizations mean that intuitive forecasting can’t be relied on going forward.

The solution lies in shifting focus from traditional forecasts to predicting probabilities for each potential demand and lead time scenario. This shift transforms the conversation from an unrealistic “one number plan” to a range of numbers with associated probabilities. By predicting probabilities for each demand and lead time possibility, you can better align stock levels with the risk tolerance for each group of parts.

Software that generates demand and lead time scenarios, repeating this process tens of thousands of times, can accurately simulate how current stocking policies will perform against these policies. If the performance in the simulation falls short and you are predicted to stock out more often than you are comfortable with or you are left with excess inventory, conducting what-if scenarios allows adjustments to policies. You can then predict how these revised policies will fare against random demands and lead times. You can conduct this process iteratively and refine it with each new what-if scenario or lean on system prescribed policies that optimally strike a balance between risk and costs.

So, if you are planning service and spare parts inventories, stop worrying about predicting demand the way traditional retail and CPG demand planners do it. Focus instead on how your stocking policies will withstand the randomness of the future, adjusting them based on your risk tolerance. To do this, you’ll need the right set of decision support software, and this is how Smart Software can help.


Spare Parts Planning Software solutions

Smart IP&O’s service parts forecasting software uses a unique empirical probabilistic forecasting approach that is engineered for intermittent demand. For consumable spare parts, our patented and APICS award winning method rapidly generates tens of thousands of demand scenarios without relying on the assumptions about the nature of demand distributions implicit in traditional forecasting methods. The result is highly accurate estimates of safety stock, reorder points, and service levels, which leads to higher service levels and lower inventory costs. For repairable spare parts, Smart’s Repair and Return Module accurately simulates the processes of part breakdown and repair. It predicts downtime, service levels, and inventory costs associated with the current rotating spare parts pool. Planners will know how many spares to stock to achieve short- and long-term service level requirements and, in operational settings, whether to wait for repairs to be completed and returned to service or to purchase additional service spares from suppliers, avoiding unnecessary buying and equipment downtime.

Contact us to learn more how this functionality has helped our customers in the MRO, Field Service, Utility, Mining, and Public Transportation sectors to optimize their inventory. You can also download the Whitepaper here.


White Paper: What you Need to know about Forecasting and Planning Service Parts


This paper describes Smart Software’s patented methodology for forecasting demand, safety stocks, and reorder points on items such as service parts and components with intermittent demand, and provides several examples of customer success.


    Why Inventory Planning Shouldn’t Rely Exclusively on Simple Rules of Thumb

    For too many companies, a critical piece of data fact-finding ― the measurement of demand uncertainty ― is handled by simple but inaccurate rules of thumb.  For example, demand planners will often compute safety stock by a user-defined multiple of the forecast or historical average.  Or they may configure their ERP to order more when on hand inventory gets to 2 x the average demand over the lead time for important items and 1.5 x for less important ones. This is a huge mistake with costly consequences.

    The choice of multiple ends up being a guessing game.  This is because no human being can compute exactly how much inventory to stock considering all the uncertainties.  Multiples of the average lead time demand are simple to use but you can never know whether the multiple used is too large or too small until it is too late.  And once you know, all the information has changed, so you must guess again and then wait and see how the latest guess turns out.  With each new day, you have new demand, new details on lead times, and the costs may have changed.  Yesterday’s guess, no more matter how educated is no longer relevant today.  Proper inventory planning should be void of inventory and forecast guesswork.  Decisions must be made with incomplete information but guessing is not the way to go.

    Knowing how much to buffer requires a fact-based statistical analysis that can accurately answer questions such as:

    • How much extra stock is needed to improve service levels by 5%
    • What the hit to on-time delivery will be if inventory is reduced by 5%
    • What service level target is most profitable.
    • How will the stockout risk be impacted by the random lead times we face.

    Intuition can’t answer these questions, doesn’t scale across thousands of parts, and is often wrong.  Data, probability math and modern software are much more effective. Winging it is not the path to sustained excellence.


    Why MRO Businesses Should Care About Excess Inventory

    Do MRO companies genuinely prioritize reducing excess spare parts inventory? From an organizational standpoint, our experience suggests not necessarily. Boardroom discussions typically revolve around expanding fleets, acquiring new customers, meeting service level agreements (SLAs), modernizing infrastructure, and maximizing uptime. In industries where assets supported by spare parts cost hundreds of millions or generate significant revenue (e.g., mining or oil & gas), the value of the inventory just doesn’t raise any eyebrows, and organizations tend to overlook massive amounts of excessive inventory.

    Consider a public transit agency.  In most major cities, the annual operating budgets will exceed $3 billion.  Capital expenses for trains, subway cars, and infrastructure may reach hundreds of millions annually. Consequently, a spare parts inventory valued at $150 million might not grab the attention of the CFO or general manager, as it represents a small percentage of the balance sheet.  Moreover, in MRO-based industries, many parts need to support equipment fleets for a decade or more, making additional stock a necessary asset. In some sectors like utilities, holding extra stock can even be incentivized to ensure that equipment is kept in a state of good repair.

    We have seen concerns about excess stock arise when warehouse space is limited. I recall, early in my career, witnessing a public transit agency’s rail yard filled with rusted axles valued at over $100,000 each.  I was told the axles were forced to be exposed to the elements due to insufficient warehouse space. The opportunity cost associated with the space consumed by extra stock becomes a consideration when warehouse capacity is exhausted. The primary consideration that trumps all other decisions is how the stock ensures high service levels for internal and external customers.  Inventory planners worry far more about blowback from stockouts than they do from overbuying.  When a missing part leads to an SLA breach or downed production line, resulting in millions in penalties and unrecoverable production output, it is understandable.

    Asset-intensive companies are missing one giant point. That is, the extra stock doesn’t insulate against stockouts; it contributes to them. The more excess you have, the lower your overall service level because the cash needed to purchase parts is finite, and cash spent on excess stock means there isn’t cash available for the parts that need it.  Even publicly funded MRO businesses, like utilities and transit agencies, acknowledge the need to optimize spending, now more than ever.  As one materials manager shared, “We can no longer fix problems with bags of cash from Washington.”  So, they must do more with less, ensuring optimal allocation across the tens of thousands of parts they manage.

    This is where state-of-the-art inventory optimization software comes in, predicting the required inventory for targeted service levels, identifying when stock levels yield negative returns, and recommending reallocations for improved overall service levels.  Smart Software has helped asset intensive MRO based businesses optimize reorder levels across each part for decades. Give us a call to learn more. 


    Spare Parts Planning Software solutions

    Smart IP&O’s service parts forecasting software uses a unique empirical probabilistic forecasting approach that is engineered for intermittent demand. For consumable spare parts, our patented and APICS award winning method rapidly generates tens of thousands of demand scenarios without relying on the assumptions about the nature of demand distributions implicit in traditional forecasting methods. The result is highly accurate estimates of safety stock, reorder points, and service levels, which leads to higher service levels and lower inventory costs. For repairable spare parts, Smart’s Repair and Return Module accurately simulates the processes of part breakdown and repair. It predicts downtime, service levels, and inventory costs associated with the current rotating spare parts pool. Planners will know how many spares to stock to achieve short- and long-term service level requirements and, in operational settings, whether to wait for repairs to be completed and returned to service or to purchase additional service spares from suppliers, avoiding unnecessary buying and equipment downtime.

    Contact us to learn more how this functionality has helped our customers in the MRO, Field Service, Utility, Mining, and Public Transportation sectors to optimize their inventory. You can also download the Whitepaper here.


    White Paper: What you Need to know about Forecasting and Planning Service Parts


    This paper describes Smart Software’s patented methodology for forecasting demand, safety stocks, and reorder points on items such as service parts and components with intermittent demand, and provides several examples of customer success.


      Constructive Play with Digital Twins

      Those of you who track hot topics will be familiar with the term “digital twin.” Those who have been too busy with work may want to read on and catch up.

      What is a digital twin?

      While there are several definitions of digital twin, here’s one that works well:

      A digital twin is a dynamic virtual copy of a physical asset, process, system, or environment that looks like and behaves identically to its real-world counterpart. A digital twin ingests data and replicates processes so you can predict possible performance outcomes and issues that the real-world product might undergo. [Source: Unity.com]. For additional background, you might go to Mckinsey.com.

      What is the difference between a digital twin (hereafter DT) and a model? Primarily, a DT gets connected to real-time data to maintain the model as an up-to-the-minute representation of the system you are working with.

      Our current products might be called “slow-motion DT’s” because they are usually used with non-real-time data (though not stale data, since it is updated overnight) and applied to problems like planning the next quarter’s raw material buys or setting inventory parameters for a month or longer.

      Are people using digital twins in my industry?

      My impression is that the penetration of DT’s may be highest in the aerospace and nuclear industries. Most of our customers are elsewhere: in manufacturing, distribution, and public utilities such as transportation and power. Soon we’ll be offering new products that come closer to the strict definition of a DT that is connected intimately to the system it represents.

      DT Preview

      Most users of Smart Inventory Optimization (SIO) run the application periodically, typically monthly. SIO analyzes current demand for inventory items and recent supplier lead times, converting these into demand and supply scenarios, respectively. Then users either interactively (for individual items) or automatically (at scale) set inventory control parameters that will provide the long-term average performance they want, balancing the competing goals of minimizing inventory while guaranteeing a sufficient level of item availability.

      Smart Supply Planner (SSP) operates in a more immediate way to react to contingencies. Any day could bring an anomalous order that spikes up demand, such as when a new customer places a surprising initial stocking order. Or a key supplier could experience a problem at its factory and be forced to delay shipment of your planned replenishment orders. In the long run, these contingencies average out and justify the recommendations coming out of SIO. However, SSP will give you a way to react in the short run to seize opportunities or dodge bullets.

      At its core, SSP operates like SIO in that it is scenario driven. The differences are that it uses short planning horizons and uses real-time initial conditions as the basis for its simulations of inventory system performance. Then it will provide real-time recommendations for interventions that offset the disruption caused by the contingencies. These would include cancelling or expediting replenishment orders.

      Summary

      Digital twins let you try out plans “in silico” before you implement them in the factory or warehouse. At their core are mathematical models of your operation but connected to real-time data. They provide a “digital sandbox” in which you can try out ideas and get immediate predictions of how well they will work. Much more than a spreadsheet, DT’s will soon be the key tool in your inventory planning toolbox.


      Are You Playing the Inventory Guessing Game?

      Some companies invest in software to help them manage their inventory, whether it’s spare parts or finished goods. But a surprising number of others play the Inventory Guessing Game every day, trusting to an imagined “Golden Gut” or to plain luck to set their inventory control parameters. But what kind of results do you expect with that approach?

      How good are you at intuiting the right values? This blog post challenges you to guess the best Min and Max values for a notional inventory item. We’ll show you its demand history, give you a few relevant facts, then you can pick Min and Max values and see how well they would work. Ready?

      The Challenge

      Figure 1 shows the daily demand history of the item. The average demand is 2 units per day. Replenishment lead time is a constant 10 days (which is unrealistic but works in your favor). Orders that cannot be filled immediately from stock cannot be backordered and are lost. You want to achieve at least an 80% fill rate, but not at any cost. You also want to minimize the average number of units on hand while still achieving at least an 80% fill rate. What Min and Max values would produce an 80% fill rate with the lowest average number of units on hand? [Record your answers for checking later. The solution appears below at the end of the article.]

      Are You Playing the Inventory Guessing Game-1

      Computing the Best Min and Max Values

      The way to determine the best values is to use a digital twin, also known as a Monte Carlo simulation. The analysis creates a multitude of demand scenarios and passes them through the mathematical logic of the inventory control system to see what values will be taken on by key performance indicators (KPI’s).

      We built a digital twin for this problem and systematically exercised it with 1,085 pairs of Min and Max values. For each pair, we simulated 365 days of operation a total of 100 times. Then we averaged the results to assess the performance of the Min/Max pair in terms of two KPI’s: fill rate and average on hand inventory.

      Figure 2 shows the results. The inherent tradeoff between inventory size and fill rate is clear in the figure: if you want a higher fill rate, you have to accept a larger inventory. However, at each level of inventory there is a range of fill rates, so the game is to find the Min/Max pair that yields the highest fill rate for any given size inventory.

      A different way to interpret Figure 2 is to focus on the dashed green line marking the target 80% fill rate. There are many Min/Max pairs that can hit near the 80% target, but they differ in inventory size from about 6 to about 8 units. Figure 3 zooms in on that region of Figure 2 to show  quite a number of Min/Max pairs that are competitive.

      We sorted the results of all 1,085 simulations to identify what economists call the efficient frontier. The efficient frontier is the set of most efficient Min/Max pairs to exploit the tradeoff between fill rate and units on hand. That is, it is a list of Min/Max pairs that provide the least cost way to achieve any desired fill rate, not just 80%. Figure 4 shows the efficient frontier for this problem. Moving from left to right, you can read off the lowest price you would have to pay (as measured by average inventory size) to achieve any target fill rate. For example, to achieve a 90% fill rate, you would have to carry an average inventory of about 10 units.

      Figures 2, 3, and 4 show results for various Min/Max pairs but do not display the values of Min and Max behind each point. Table 1 displays all the simulation data: the values of Min, Max, average units on hand and fill rate. The answer to the guessing game is highlighted in the first line of the table: Min=7 and Max=131. Did you get the right answer, or something close2? Did you maybe get onto the efficient frontier?

      Conclusions

      Maybe you got lucky, or maybe you do indeed have a Golden Gut, but it’s more likely you didn’t get the right answer, and it’s even more likely you didn’t even try. Figuring out the right answer is extremely difficult without using the digital twin. Guessing is unprofessional.

      One step up from guessing is “guess and see”, in which you implement your guess and then wait a while (months?) to see if you like the results. That tactic is at least “scientific”, but it is inefficient.

      Now consider the effort to work out the best (Min,Max) pairs for thousands of items. At that scale, there is even less justification for playing the Inventory Guessing Game. The right answer is to play it… Smart3.

      1 This answer has a bonus, in that it achieves a bit more than 80% fill rate at a lower average inventory size than the Min/Max combination that hit exactly 80%. In other words, (7,13) is on the efficient frontier.

      2 Because these results come from a simulation instead of an exact mathematical equation, there is a certain margin of error associated with each estimated fill rate and inventory level. However, because the average results were based on 100 simulations each 365 days long, the margins of error are small. Across all experiments, the average standard errors in fill rate and mean inventory were, respectively, only 0.009% and 0.129 units.

      3 In case you didn’t know this, one of the founders of Smart Software was … Charlie Smart.

      Are You Playing the Inventory Guessing Game-111

      Are You Playing the Inventory Guessing Game-Table 1