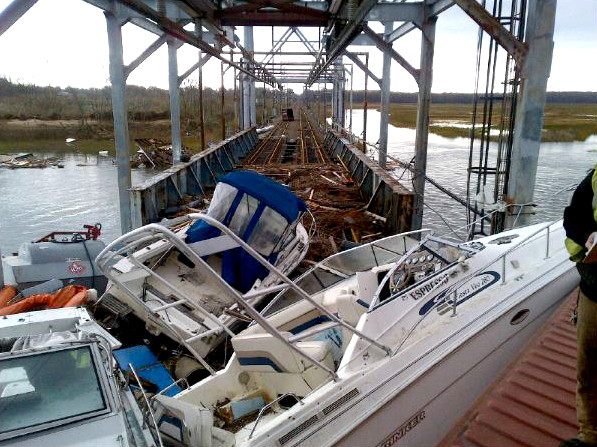
The destructive impact of Hurricane Sandy has been both staggering and instructive. Our thoughts and best wishes for rapid recovery go out to all who have suffered personal or economic loss or damage. Now, in Sandy’s aftermath, we find ourselves thinking about accelerating recovery and planning for the next unforeseen event.
Our work with clients in the heavily hit mass transit sector presented a sobering view of damaged infrastructure, heavy equipment, and losses of essential inventory. Those most affected have seen a crush of work as inventory managers take stock of what they have, what they need and procure a mountain of replacement parts and products. This uniquely massive replenishment cycle presents all sorts of opportunities and considerations. For those who are still in this phase, and to help our collective preparation for the Next Big Event, here are a few thoughts:
Opportunity to immediately “right size” inventory
You may be in a position to receive a large, one-time infusion of funding for replacement inventory. It could be insurance money, federal relief or rainy day funds from your own treasury. Use the funding to establish the best possible inventory mix. Do not order to previously established Min/Max levels. Doing so may simply repeat excesses and shortfalls of the past.
A major event like Sandy presents a rare opportunity to transform your inventory. Start with an accurate demand forecast over the replenishment period, and generate safety stocks and reorder points that would address your critical needs. This can be accomplished in a matter of hours or days. Ordinarily, implementing optimal inventory levels may occur over several years, as excess inventory is gradually depleted. Now, however, you have a one-time opportunity to jump to the right answer. This shift can substantially reduce replenishment spending, freeing hundreds of thousands of dollars for other, more critical recovery uses.
Prioritize classes to be replenished
Be clear on what you need for crucial operations, and prioritize your replenishment. Which parts have long lead-times, and which are readily available? Obviously short lead-time items can be acquired in stages—getting just enough now, making funds available for the longer lead-time items.
Determine how much is “just enough”
This is where an accurate demand forecast, safety stocks and reorder point calculations come into play. Consider the service level you require—the likelihood that products will be on the shelves when you need them—which is really your tolerance for risk. Do this for each item, or class of items. This will tell you how much safety stock, in addition to your expected lead time forecast, you should have on hand. Iterating on service level-driven requirements will enable you to maximize the value of the replenishment budget at hand.
Statistical forecasting for intermittent demand vs. ‘rule of thumb’ methods
Now is the time to shift from ‘the way we’ve done it’ to the most accurate demand forecasting and inventory optimization process available to you. Greater forecast accuracy requires less safety stock—again, making inventory dollars available for other users. The greatest single category for improvement is intermittent demand. Most organizations do not apply solid statistical methods to this, instead resorting to the “heavy hammer rule”—have lots on hand because no one knows. Here is an area where SmartForecasts is especially adept, with a patented solution for forecasting intermittent demand. The resulting safety stock recommendations hit the service level goal nearly 100% of the time. Getting this right will save lots of spending now, and help minimize the potential for excess, obsolete inventory in the future.
Nelson Hartunian, PhD, co-founded Smart Software, formerly served as President, and currently oversees it as Chairman of the Board. He has, at various times, headed software development, sales and customer service.

Related Posts

Make AI-Driven Inventory Optimization an Ally for Your Organization
In this blog, we will explore how organizations can achieve exceptional efficiency and accuracy with AI-driven inventory optimization. Traditional inventory management methods often fall short due to their reactive nature and reliance on manual processes. Maintaining optimal inventory levels is fundamental for meeting customer demand while minimizing costs. The introduction of AI-driven inventory optimization can significantly reduce the burden of manual processes, providing relief to supply chain managers from tedious tasks.

Future-Proofing Utilities: Advanced Analytics for Supply Chain Optimization
Utilities in the electrical, natural gas, urban water, and telecommunications fields are all asset-intensive and reliant on physical infrastructure that must be properly maintained, updated, and upgraded over time. Maximizing asset uptime and the reliability of physical infrastructure demands effective inventory management, spare parts forecasting, and supplier management. A utility that executes these processes effectively will outperform its peers, provide better returns for its investors and higher service levels for its customers, while reducing its environmental impact.

Centering Act: Spare Parts Timing, Pricing, and Reliability
In this article, we’ll walk you through the process of crafting a spare parts inventory plan that prioritizes availability metrics such as service levels and fill rates while ensuring cost efficiency. We’ll focus on an approach to inventory planning called Service Level-Driven Inventory Optimization. Next, we’ll discuss how to determine what parts you should include in your inventory and those that might not be necessary. Lastly, we’ll explore ways to enhance your service-level-driven inventory plan consistently.
Recent Posts
 Forecast-Based Inventory Management for Better PlanningForecast-based inventory management, or MRP (Material Requirements Planning) logic, is a forward-planning method that helps businesses meet demand without overstocking or understocking. By anticipating demand and adjusting inventory levels, it maintains a balance between meeting customer needs and minimizing excess inventory costs. This approach optimizes operations, reduces waste, and enhances customer satisfaction. […]
 Make AI-Driven Inventory Optimization an Ally for Your OrganizationIn this blog, we will explore how organizations can achieve exceptional efficiency and accuracy with AI-driven inventory optimization. Traditional inventory management methods often fall short due to their reactive nature and reliance on manual processes. Maintaining optimal inventory levels is fundamental for meeting customer demand while minimizing costs. The introduction of AI-driven inventory optimization can significantly reduce the burden of manual processes, providing relief to supply chain managers from tedious tasks. […]
 The Importance of Clear Service Level Definitions in Inventory ManagementInventory optimization software that supports what-if analysis will expose the tradeoff of stockouts vs. excess costs of varying service level targets. But first it is important to identify how “service levels” is interpreted, measured, and reported. This will avoid miscommunication and the false sense of security that can develop when less stringent definitions are used. Clearly defining how service level is calculated puts all stakeholders on the same page. This facilitates better decision-making. […]
 Future-Proofing Utilities: Advanced Analytics for Supply Chain OptimizationUtilities in the electrical, natural gas, urban water, and telecommunications fields are all asset-intensive and reliant on physical infrastructure that must be properly maintained, updated, and upgraded over time. Maximizing asset uptime and the reliability of physical infrastructure demands effective inventory management, spare parts forecasting, and supplier management. A utility that executes these processes effectively will outperform its peers, provide better returns for its investors and higher service levels for its customers, while reducing its environmental impact. […]
 The Cost of Spreadsheet PlanningCompanies that depend on spreadsheets for demand planning, forecasting, and inventory management are often constrained by the spreadsheet’s inherent limitations. This post examines the drawbacks of traditional inventory management approaches caused by spreadsheets and their associated costs, contrasting these with the significant benefits gained from embracing state-of-the-art planning technologies. […]

Inventory Optimization for Manufacturers, Distributors, and MRO
- Future-Proofing Utilities: Advanced Analytics for Supply Chain OptimizationUtilities in the electrical, natural gas, urban water, and telecommunications fields are all asset-intensive and reliant on physical infrastructure that must be properly maintained, updated, and upgraded over time. Maximizing asset uptime and the reliability of physical infrastructure demands effective inventory management, spare parts forecasting, and supplier management. A utility that executes these processes effectively will outperform its peers, provide better returns for its investors and higher service levels for its customers, while reducing its environmental impact. […]
 Centering Act: Spare Parts Timing, Pricing, and ReliabilityIn this article, we'll walk you through the process of crafting a spare parts inventory plan that prioritizes availability metrics such as service levels and fill rates while ensuring cost efficiency. We'll focus on an approach to inventory planning called Service Level-Driven Inventory Optimization. Next, we'll discuss how to determine what parts you should include in your inventory and those that might not be necessary. Lastly, we'll explore ways to enhance your service-level-driven inventory plan consistently. […]
 Why MRO Businesses Need Add-on Service Parts Planning & Inventory SoftwareMRO organizations exist in a wide range of industries, including public transit, electrical utilities, wastewater, hydro power, aviation, and mining. To get their work done, MRO professionals use Enterprise Asset Management (EAM) and Enterprise Resource Planning (ERP) systems. These systems are designed to do a lot of jobs. Given their features, cost, and extensive implementation requirements, there is an assumption that EAM and ERP systems can do it all. In this post, we summarize the need for add-on software that addresses specialized analytics for inventory optimization, forecasting, and service parts planning. […]
 5 Steps to Improve the Financial Impact of Spare Parts PlanningIn today’s competitive business landscape, companies are constantly seeking ways to improve their operational efficiency and drive increased revenue. Optimizing service parts management is an often-overlooked aspect that can have a significant financial impact. Companies can improve overall efficiency and generate significant financial returns by effectively managing spare parts inventory. This article will explore the economic implications of optimized service parts management and how investing in Inventory Optimization and Demand Planning Software can provide a competitive advantage. […]