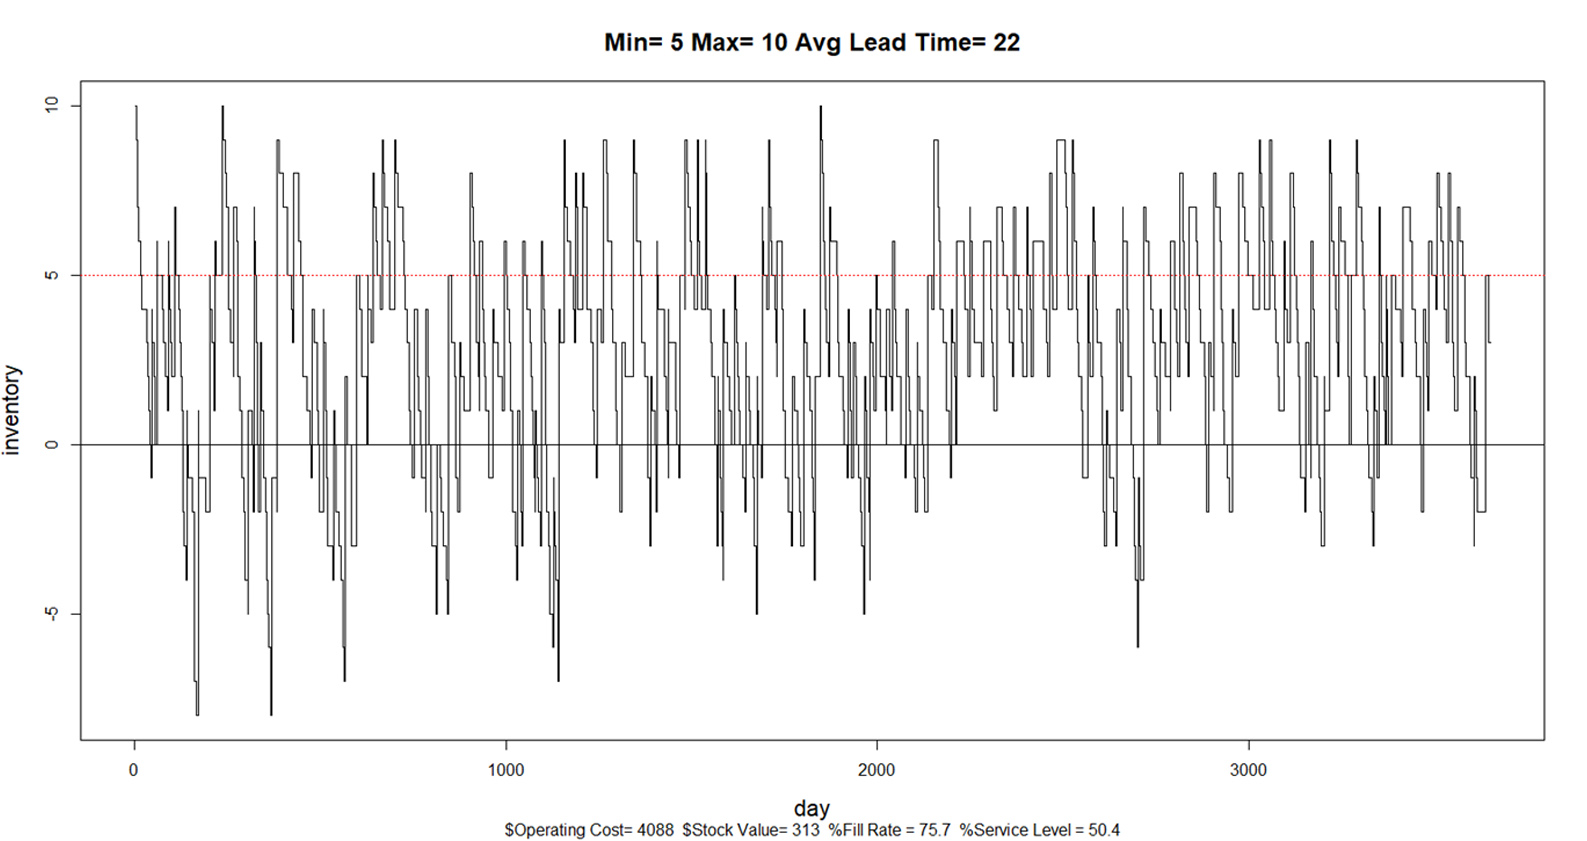
Figure 2 Simulation of abnormal operations using longer lead times and current Min and Max
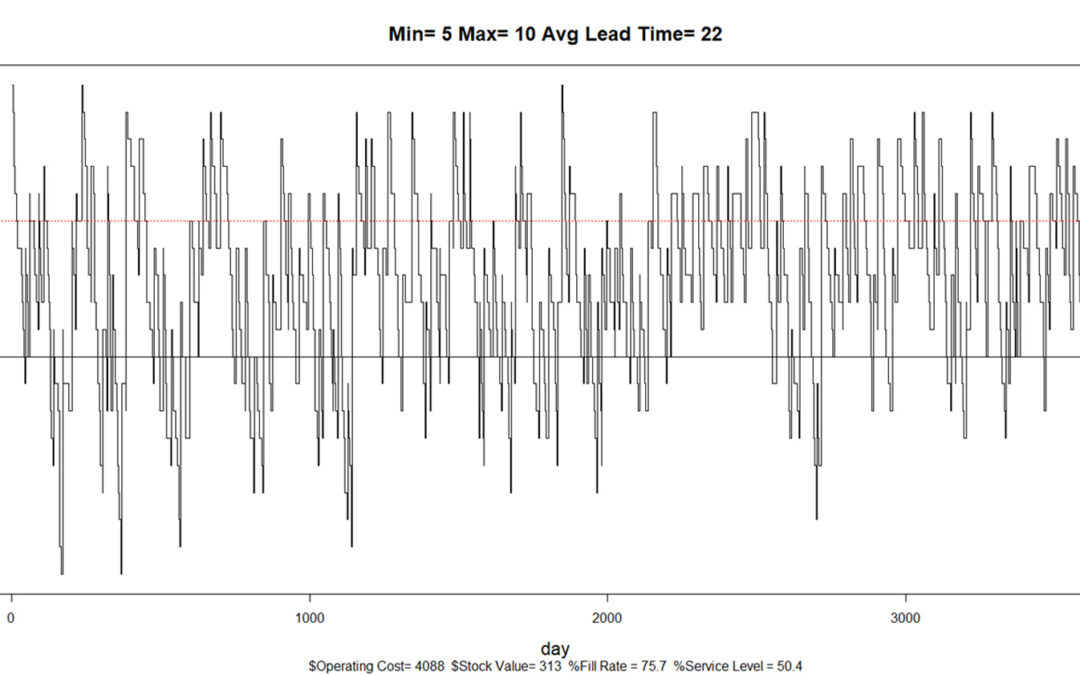
Figure 2 Simulation of abnormal operations using longer lead times and current Min and Max
 Forecast-Based Inventory Management for Better Planning
 Make AI-Driven Inventory Optimization an Ally for Your …
 The Importance of Clear Service Level Definitions in In…
 Forecast-Based Inventory Management for Better Pla…Make AI-Driven Inventory Optimization an Ally for …The Importance of Clear Service Level Definitions …