As the world holds its breathe to see how the new corona virus (2019-nCOV) will play out, we cross our fingers for all those currently in quarantine or under treatment and pray that health authorities around the world will soon get the upper hand.
This short note is about one way your business can develop a plan to adjust to one of the likely fallouts from the virus: sudden increases in the time it takes to get inventory replenishment from suppliers. Supply chains around the world are being disrupted. If this happens to you, how can you react in a systematic way?
Reacting to Longer Lead Times
This is a problem that can be solved using advanced supply chain analytics. Presumably, you may have already used this technology to make good choices for the control parameters used in managing all your inventory items, e.g., values for Min and Max or Reorder Point and Order Quantity. The specific technical question addressed here is how to convert an increase in replenishment lead time to changes in those control parameters.
In general, longer lead times require fatter inventories if you want to maintain a high level of customer service. This general rule translates into larger values of Min and/or Max. How much larger depends critically on what new, longer lead time values will appear and their probabilities of occurring.
While many planning software systems assume a fixed lead time, the reality is that almost all lead times have some degree of randomness. Typically, ignoring that randomness increases stockout risk, so having a good estimate of the probability distribution of lead times is important. In normal times, your transactional data can be used to estimate that relationship. But sudden disruptions like 2019-nCOV create unprecedented situations in which you have to make educated guesses about what new delays you will see and how likely they are. We will assume here that you can imagine some such scenarios and want to figure out how to best respond to them.
An Example using Advanced Software
To illustrate this type of prospective planning, consider a hypothetical example. One item, a spare part, has an established pattern of replenishment lead times, with delays of 5, 10 and 15 days occurring with 15%, 70% and 15% probabilities, respectively. Given this distribution and a random demand averaging one unit every 5 days, values of Min = 5 and Max = 10 do a good job. Figure 1 shows a simulation of 10 years of daily operation under this scenario. Fill rate and service level are high, and stockouts are infrequent.
Now suppose that disruptions in the supply chain create a less favorable distribution of lead time, with a 50:50 mix of 15 and 30 days. Figure 2 shows how badly the current values of Min and Max perform in this new scenario. Fill rate and service level plummet due to frequent stockouts. Operating costs more than triple due to penalties for backorders. Only inventory investment (the average dollar value of stock on the shelf) seems to get better, but this happens only because so often there are backorders with nothing left on the shelf. The shift to longer lead times clearly requires new higher values of Min and Max.
Figure 3 shows how the system performs when the Min is increased from 5 to 10 and the Max from 10 to 15. This change compensates for the longer lead times, restoring the previous high levels of fill rate and service level. Inventory investment is necessarily greater, but operating costs are actually lower than before.
Summary
Changes in normal operating conditions require adjustments in the way inventory items are managed. One such change looming large on this date is the potential impact of the 2019-nCOV Corona virus on supply chains, with anticipated increases in replenishment lead times.
Changes in lead times require changes in inventory control parameters such as Min’s and Max’s. These changes are difficult to make with any confidence using pure guesswork. But with some estimate of the increase in lead times, you can use advanced software to learn how to make these adjustments with some confidence.
This note illustrates this point using simulations of the daily operation of an inventory control system.
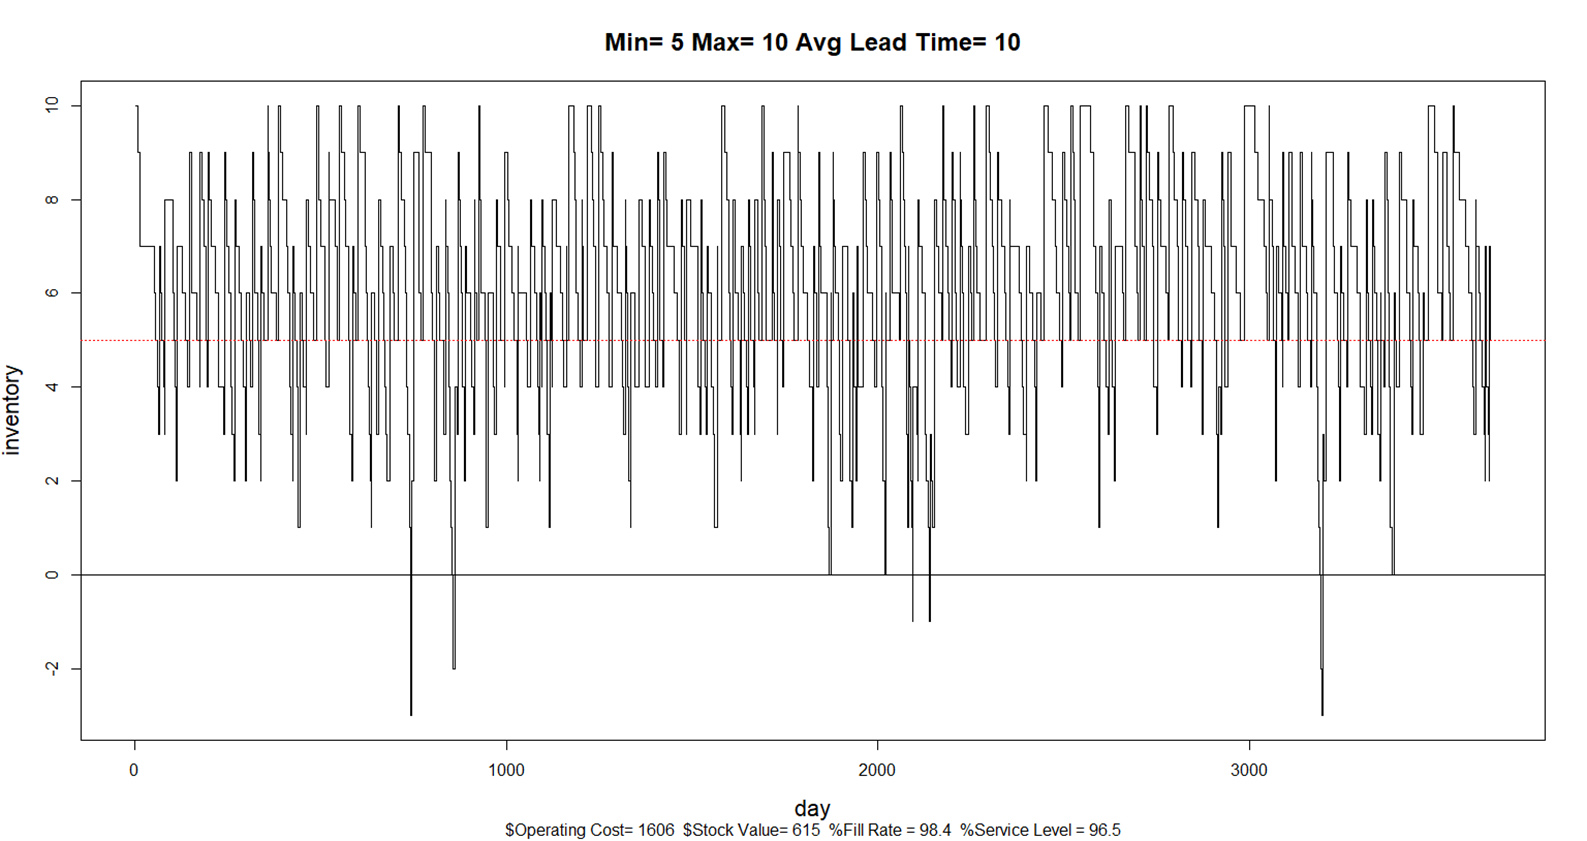
Figure 1 Simulation of normal operations using current replenishment lead times, Min and Max
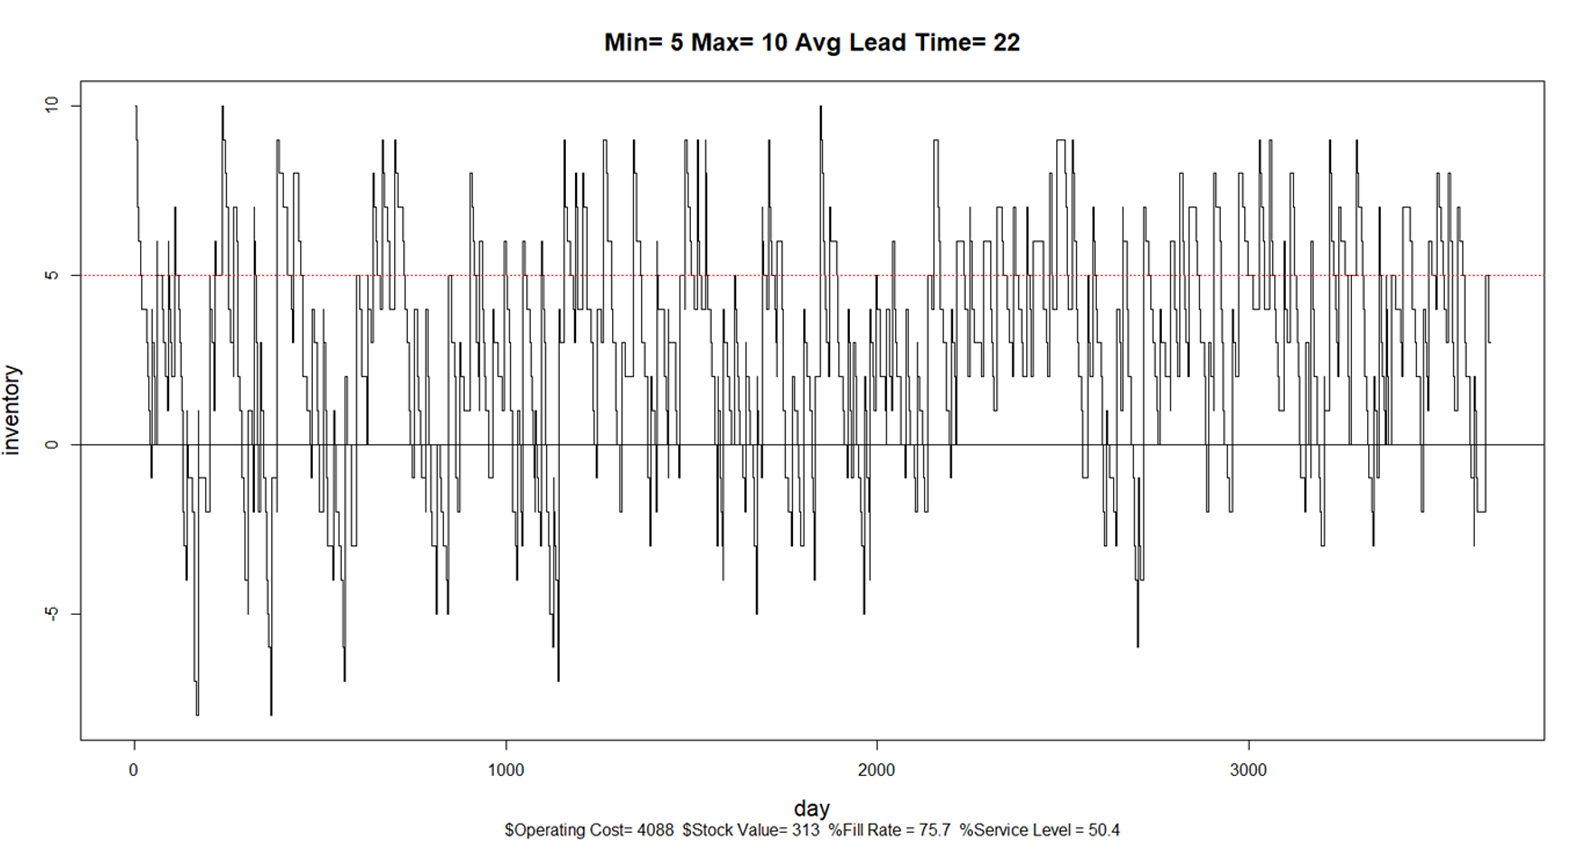
Figure 2 Simulation of abnormal operations using longer lead times and current Min and Max
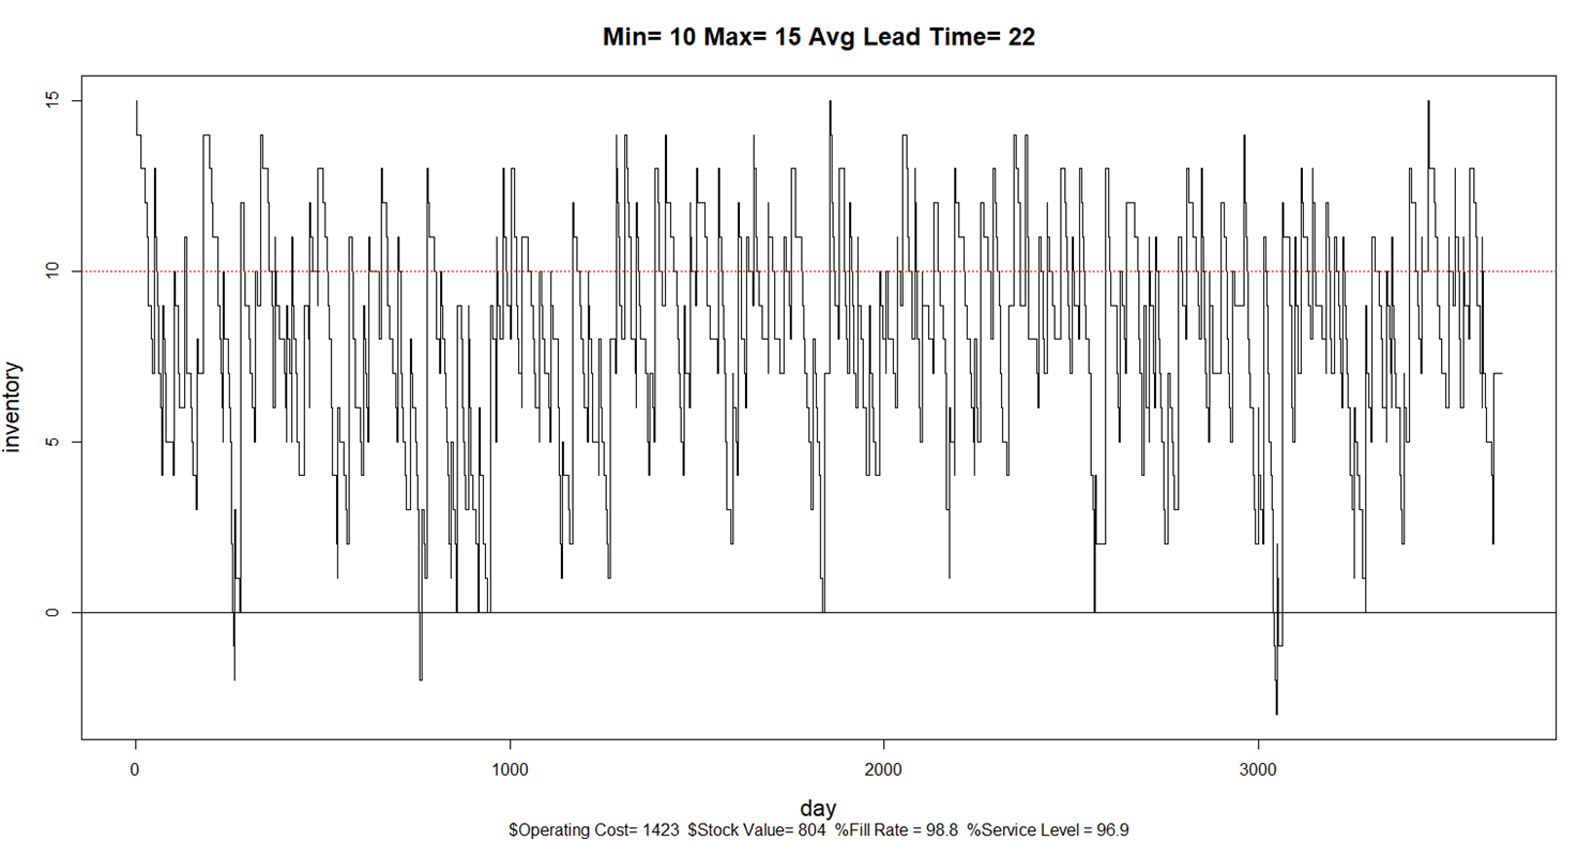
Figure 3 Simulation of abnormal operations using longer lead times and revised Min and Max
Related Posts

Forecast-Based Inventory Management for Better Planning
Forecast-based inventory management, or MRP (Material Requirements Planning) logic, is a forward-planning method that helps businesses meet demand without overstocking or understocking. By anticipating demand and adjusting inventory levels, it maintains a balance between meeting customer needs and minimizing excess inventory costs. This approach optimizes operations, reduces waste, and enhances customer satisfaction.

Make AI-Driven Inventory Optimization an Ally for Your Organization
In this blog, we will explore how organizations can achieve exceptional efficiency and accuracy with AI-driven inventory optimization. Traditional inventory management methods often fall short due to their reactive nature and reliance on manual processes. Maintaining optimal inventory levels is fundamental for meeting customer demand while minimizing costs. The introduction of AI-driven inventory optimization can significantly reduce the burden of manual processes, providing relief to supply chain managers from tedious tasks.

The Importance of Clear Service Level Definitions in Inventory Management
Inventory optimization software that supports what-if analysis will expose the tradeoff of stockouts vs. excess costs of varying service level targets. But first it is important to identify how “service levels” is interpreted, measured, and reported. This will avoid miscommunication and the false sense of security that can develop when less stringent definitions are used. Clearly defining how service level is calculated puts all stakeholders on the same page. This facilitates better decision-making.
Recent Posts
 Forecast-Based Inventory Management for Better PlanningForecast-based inventory management, or MRP (Material Requirements Planning) logic, is a forward-planning method that helps businesses meet demand without overstocking or understocking. By anticipating demand and adjusting inventory levels, it maintains a balance between meeting customer needs and minimizing excess inventory costs. This approach optimizes operations, reduces waste, and enhances customer satisfaction. […]
 Make AI-Driven Inventory Optimization an Ally for Your OrganizationIn this blog, we will explore how organizations can achieve exceptional efficiency and accuracy with AI-driven inventory optimization. Traditional inventory management methods often fall short due to their reactive nature and reliance on manual processes. Maintaining optimal inventory levels is fundamental for meeting customer demand while minimizing costs. The introduction of AI-driven inventory optimization can significantly reduce the burden of manual processes, providing relief to supply chain managers from tedious tasks. […]
 The Importance of Clear Service Level Definitions in Inventory ManagementInventory optimization software that supports what-if analysis will expose the tradeoff of stockouts vs. excess costs of varying service level targets. But first it is important to identify how “service levels” is interpreted, measured, and reported. This will avoid miscommunication and the false sense of security that can develop when less stringent definitions are used. Clearly defining how service level is calculated puts all stakeholders on the same page. This facilitates better decision-making. […]
 Future-Proofing Utilities: Advanced Analytics for Supply Chain OptimizationUtilities in the electrical, natural gas, urban water, and telecommunications fields are all asset-intensive and reliant on physical infrastructure that must be properly maintained, updated, and upgraded over time. Maximizing asset uptime and the reliability of physical infrastructure demands effective inventory management, spare parts forecasting, and supplier management. A utility that executes these processes effectively will outperform its peers, provide better returns for its investors and higher service levels for its customers, while reducing its environmental impact. […]
 The Cost of Spreadsheet PlanningCompanies that depend on spreadsheets for demand planning, forecasting, and inventory management are often constrained by the spreadsheet’s inherent limitations. This post examines the drawbacks of traditional inventory management approaches caused by spreadsheets and their associated costs, contrasting these with the significant benefits gained from embracing state-of-the-art planning technologies. […]

Inventory Optimization for Manufacturers, Distributors, and MRO
- Future-Proofing Utilities: Advanced Analytics for Supply Chain OptimizationUtilities in the electrical, natural gas, urban water, and telecommunications fields are all asset-intensive and reliant on physical infrastructure that must be properly maintained, updated, and upgraded over time. Maximizing asset uptime and the reliability of physical infrastructure demands effective inventory management, spare parts forecasting, and supplier management. A utility that executes these processes effectively will outperform its peers, provide better returns for its investors and higher service levels for its customers, while reducing its environmental impact. […]
 Centering Act: Spare Parts Timing, Pricing, and ReliabilityIn this article, we'll walk you through the process of crafting a spare parts inventory plan that prioritizes availability metrics such as service levels and fill rates while ensuring cost efficiency. We'll focus on an approach to inventory planning called Service Level-Driven Inventory Optimization. Next, we'll discuss how to determine what parts you should include in your inventory and those that might not be necessary. Lastly, we'll explore ways to enhance your service-level-driven inventory plan consistently. […]
 Why MRO Businesses Need Add-on Service Parts Planning & Inventory SoftwareMRO organizations exist in a wide range of industries, including public transit, electrical utilities, wastewater, hydro power, aviation, and mining. To get their work done, MRO professionals use Enterprise Asset Management (EAM) and Enterprise Resource Planning (ERP) systems. These systems are designed to do a lot of jobs. Given their features, cost, and extensive implementation requirements, there is an assumption that EAM and ERP systems can do it all. In this post, we summarize the need for add-on software that addresses specialized analytics for inventory optimization, forecasting, and service parts planning. […]
 5 Steps to Improve the Financial Impact of Spare Parts PlanningIn today’s competitive business landscape, companies are constantly seeking ways to improve their operational efficiency and drive increased revenue. Optimizing service parts management is an often-overlooked aspect that can have a significant financial impact. Companies can improve overall efficiency and generate significant financial returns by effectively managing spare parts inventory. This article will explore the economic implications of optimized service parts management and how investing in Inventory Optimization and Demand Planning Software can provide a competitive advantage. […]