Six Tips for New Demand Planners

The Smart Forecaster

 Pursuing best practices in demand planning,

forecasting and inventory optimization

If you are a new professional in the field of demand planning and inventory management, you face a very steep learning curve. There are many moving parts in the system you manage, and much of the movement is random. You may find it helpful to take a step back from the day-to-day flow to think about what it takes to be a successful demand planner. Here are six tips for new demand planners that you may find useful; they are distilled from working over thirty five years with some very smart practitioners.

1. Know what winning means.

Inventory management and demand planning is not a squishy area where success can be described in vague language. Success here is a numbers game. There a number of key performance indicators (KPI’s) available to you, including Service Level, Fill Rate, Inventory Turns, Inventory Investment, and Inventory Operating Cost. Companies differ in the importance they assign to each metric such, but you can’t win without using some or all of these to keep score.

But “winning” is not as simple as getting the best possible score on each metric. The metric values that are most important vary across companies. Your company may prioritize customer service over cost control, or vice versa, and next year it might have reason to reverse that preference.

Furthermore, there are linkages among KPI’s that require you to think of them simultaneously rather than as a collection of independent scores. For example, improving Service Level will usually also improve Fill Rate, which is good, but it will also usually increase Operating Cost, which is not good.

These linkages express themselves as tradeoffs. And while the KPI’s themselves are numbers, the management of the bundle of KPI’s requires some wise subjectivity, because what is needed is a reasonable balance among competing forces. The fundamental tradeoff is to balance the cost of having inventory against the value of having the inventory available to those who need it.

If you are relatively junior demand planner, these tradeoff judgments may be made higher in the organization, but even then you can play a useful role by insuring that the tradeoffs are exposed and appreciated. This means exposed at a quantitative level, e.g., “We can increase Service Level from 85% to 90%, but it will require $100K more stock in the warehouse.” This kind of specific quantitative knowledge can be provided by advanced supply chain analytics.

2. Keep score.

We’re all a bit squeamish about being measured, but confident professionals insist on keeping score. Enlightened supervisors understand that external forces can ding the performance of your system (e.g., a key supplier disappears), and that always helps. But whether or not you have good top cover, you cannot demonstrate success, nor can you react to problems, without measuring those KPI’s.

Keeping score is important, but so is understanding what influences score. Suppose your Service Level has dropped from last month’s value. Is that just the usual month-to-month fluctuation or is it something out of the ordinary? If it is problematic, then you need to diagnose the problem. Often there are several possible suspects. For example, Service Level can drop because the sales and marketing folks did something great and demand has spiked, or because a supplier did something not so great and replenishment lead time has tanked. Software can help you track these key inputs to help your detective work, and supply chain analytics can estimate the impacts of changes in these inputs and point you to compensating responses.

3. Be sure your decisions are fact-based.

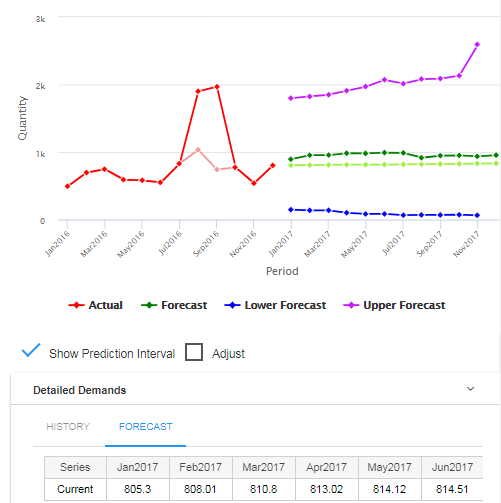
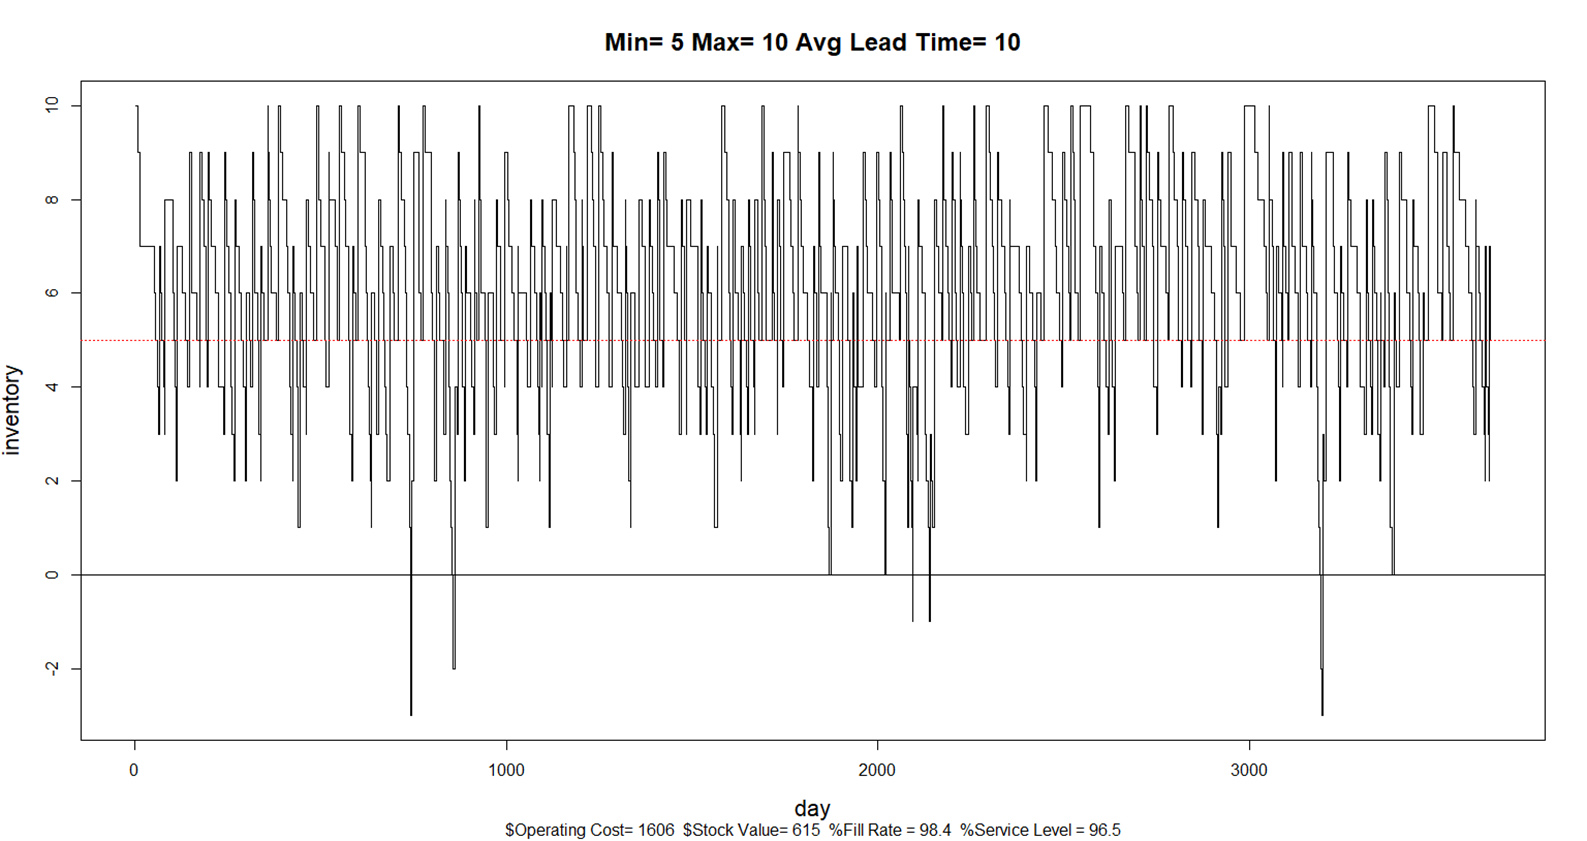
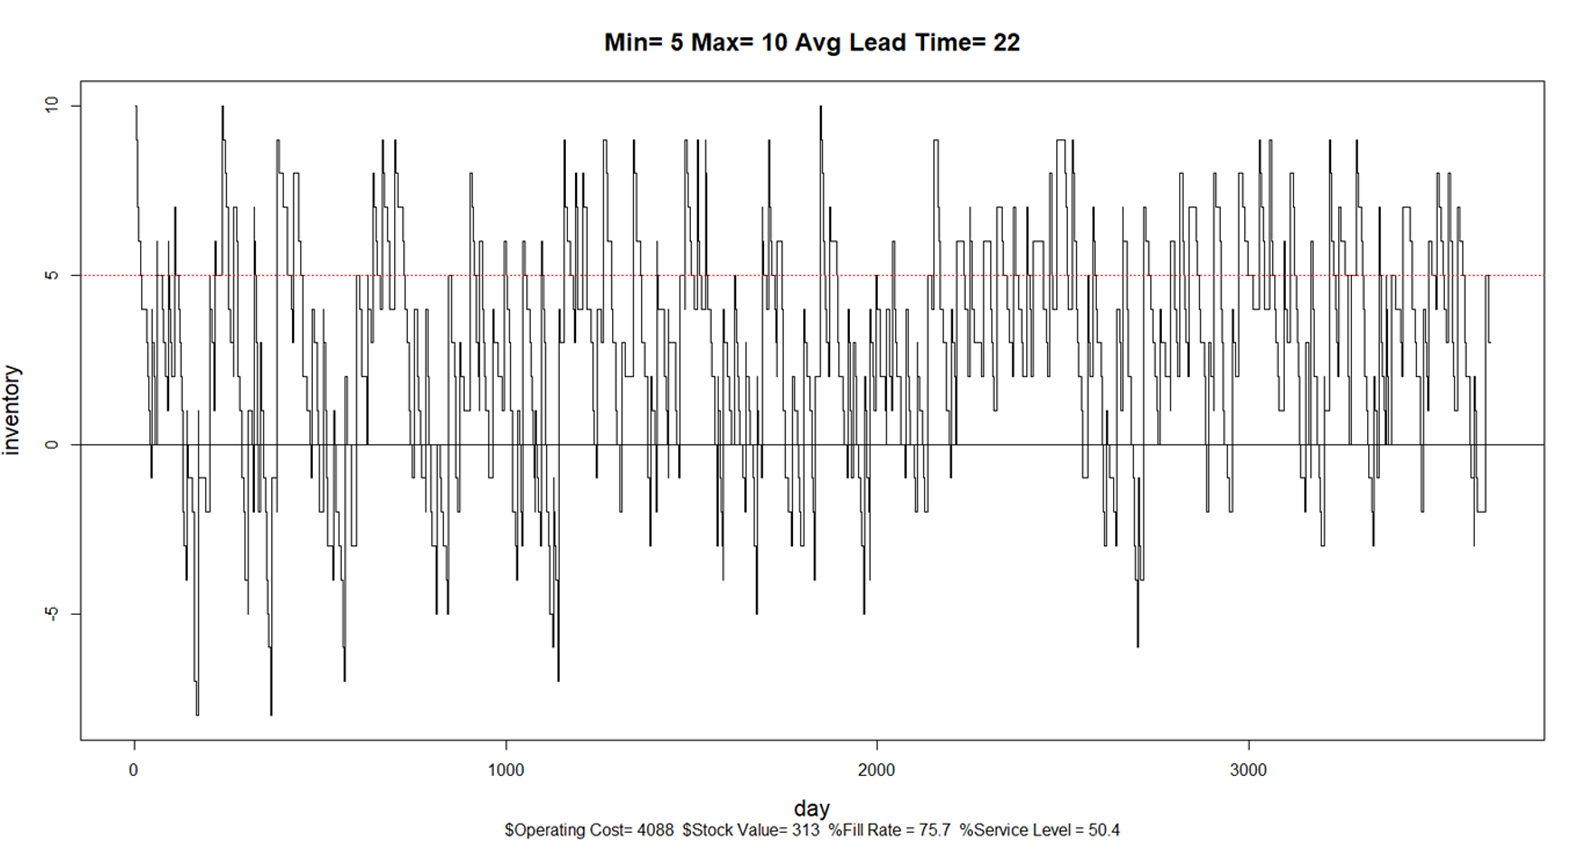
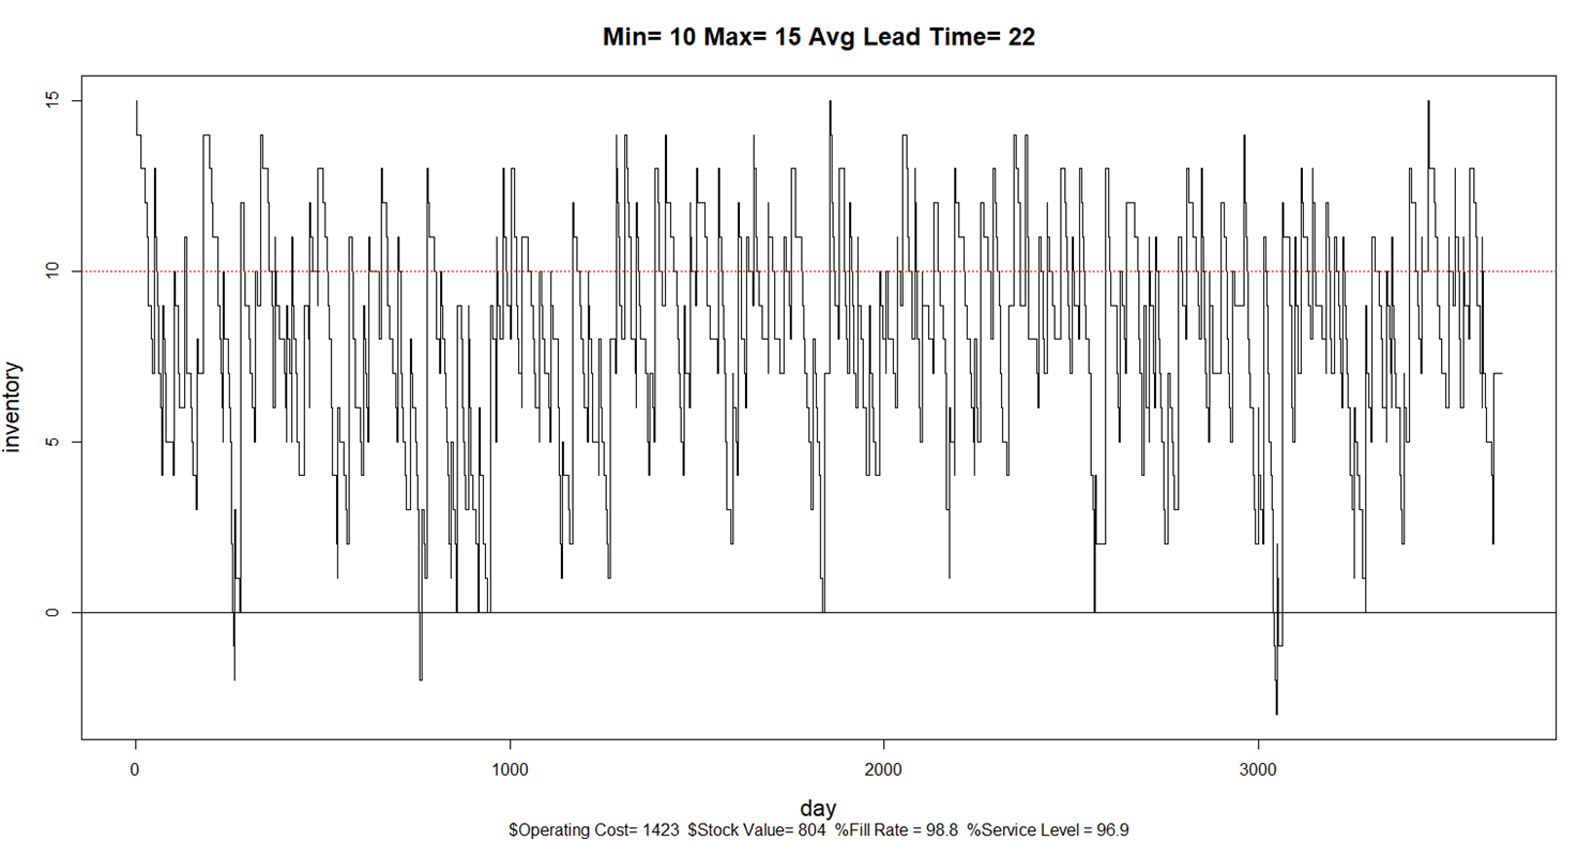
Software can guide you to good decisions, but only if you let it. Inputs such as holding costs, ordering costs, and shortage costs need to be well estimated to get accurate assessment of tradeoffs. Especially important is something as apparently simple as using correct values for item demand, since modeling demand is the starting point for simulating the results of any proposed inventory system design. In fact, if we are willing to stretch the meaning of “fact” a bit to include the results of system simulations, you should not commit to major changes without having reliable predictions of what will happen when you commit to those changes.

4. Realize that yesterday’s answer may not be today’s answer.

Supply chains are collections of parts, all of which are subject to change over time. Demand that is trending up may start to trend down. Replenishment lead times may slip. Supplier order minima may increase. Component prices may increase due to tariffs. Such factors mean that the facts you collected yesterday can be out of date today, making yesterday’s decisions inappropriate for today’s problems. Vigilance. Check out a prior article detailing the adverse financial impact of infrequent updates to planning parameters.

5. Give each item its due.

If you are responsible for forecasting hundreds or thousands of inventory items, you will be tempted to simplify your life by adopting a “one size fits all” approach. Don’t. SKU’s aren’t exactly like snowflakes, but some differentiation is required to do your job well. It’s a good idea to form groups of items based on some salient characteristics. Some items are critical and must (almost) always be available; others can run some reasonable risk of being backordered. Some items are quite unpredictable because they are “intermittent” (i.e., have lots of zero values with nonzero values mixed in at random); others have high volume and are reasonably predictable. Some items can be managed with relatively inexpensive inventory methods that make adjustments every month; some items need methods that continuously monitor and adjust the stock on hand. Some items, such as contractual purchases, may be so predictable that you can treat them as “planned demand” and pull them out from the rest.

Once you have formed sensible item groups, you still have decisions to make about each item in each group, such as deciding their demand forecasts, reorder points and order quantities. Here advanced demand planning software can take over and automatically compute the best choices based on what winning means in the context of that group.  

6. Get everybody on the same page.

Being organized is not only pleasing, it’s efficient. If you have a system for demand planning and inventory management, then everybody on your team shares the same objectives and follows the same processes. If you don’t have a system, then every demand planner has his or her own way of thinking about the problem and making decisions. Some of those are bound to be better than others. It’s desirable to standardize on the best practices and ban the rest. Besides being more efficient, having a standardized process makes it easier to diagnose problems when things go wrong and to implement fixes.


Volume and color boxes in a warehouese


Leave a Comment

Related Posts

The Cost of Spreadsheet Planning

The Cost of Spreadsheet Planning

Companies that depend on spreadsheets for demand planning, forecasting, and inventory management are often constrained by the spreadsheet’s inherent limitations. This post examines the drawbacks of traditional inventory management approaches caused by spreadsheets and their associated costs, contrasting these with the significant benefits gained from embracing state-of-the-art planning technologies.

Finding Your Spot on the Inventory Tradeoff Curve

Finding Your Spot on the Inventory Tradeoff Curve

This video blog holds essential insights for those working with the complexities of inventory management. The session focuses on striking the right balance within the inventory tradeoff curve, inviting viewers to understand the deep-seated importance of this equilibrium.

Why MRO Businesses Need Add-on Service Parts Planning & Inventory Software

Why MRO Businesses Need Add-on Service Parts Planning & Inventory Software

MRO organizations exist in a wide range of industries, including public transit, electrical utilities, wastewater, hydro power, aviation, and mining. To get their work done, MRO professionals use Enterprise Asset Management (EAM) and Enterprise Resource Planning (ERP) systems. These systems are designed to do a lot of jobs. Given their features, cost, and extensive implementation requirements, there is an assumption that EAM and ERP systems can do it all. In this post, we summarize the need for add-on software that addresses specialized analytics for inventory optimization, forecasting, and service parts planning.

Recent Posts

  • Epicor AI Forecasting and Inventory Technology Combined with Planner Knowledge for InsightsSmart Software to Present at Epicor Insights 2024
    Smart Software will present at this year's Epicor Insights event in Nashville. If you plan to attend this year, please join us at booth #13 or #501, and learn more about Epicor Smart Inventory Planning and Optimization. . […]
  • Looking for Trouble in Your Inventory DataLooking for Trouble in Your Inventory Data
    In this video blog, the spotlight is on a critical aspect of inventory management: the analysis and interpretation of inventory data. The focus is specifically on a dataset from a public transit agency detailing spare parts for buses. […]
  • BAF Case Study SIOP planning Distribution CenterBig Ass Fans Turns to Smart Software as Demand Heats Up
    Big Ass Fans is the best-selling big fan manufacturer in the world, delivering comfort to spaces where comfort seems impossible. BAF had a problem: how to reliably plan production to meet demand. BAF was experiencing a gap between bookings forecasts vs. shipments, and this was impacting revenue and customer satisfaction BAF turned to Smart Software for help. […]
  • The Cost of Doing nothing with your inventory Planning SystemsThe Cost of Spreadsheet Planning
    Companies that depend on spreadsheets for demand planning, forecasting, and inventory management are often constrained by the spreadsheet’s inherent limitations. This post examines the drawbacks of traditional inventory management approaches caused by spreadsheets and their associated costs, contrasting these with the significant benefits gained from embracing state-of-the-art planning technologies. […]
  • Randomness can be an Ally in the Forecasting BattleCan Randomness be an Ally in the Forecasting Battle?
    When we try to understand the complex world of logistics, randomness plays a pivotal role. This introduces an interesting paradox: In a reality where precision and certainty are prized, could the unpredictable nature of supply and demand actually serve as a strategic ally? The quest for accurate forecasts is not just an academic exercise; it's a critical component of operational success across numerous industries. For demand planners who must anticipate product demand, the ramifications of getting it right—or wrong—are critical. Hence, recognizing and harnessing the power of randomness isn't merely a theoretical exercise; it’s a necessity for resilience and adaptability in an ever-changing environment. […]

    Inventory Optimization for Manufacturers, Distributors, and MRO

    • Why MRO Businesses Need Add-on Service Parts Planning & Inventory SoftwareWhy MRO Businesses Need Add-on Service Parts Planning & Inventory Software
      MRO organizations exist in a wide range of industries, including public transit, electrical utilities, wastewater, hydro power, aviation, and mining. To get their work done, MRO professionals use Enterprise Asset Management (EAM) and Enterprise Resource Planning (ERP) systems. These systems are designed to do a lot of jobs. Given their features, cost, and extensive implementation requirements, there is an assumption that EAM and ERP systems can do it all. In this post, we summarize the need for add-on software that addresses specialized analytics for inventory optimization, forecasting, and service parts planning. […]
    • Spare-parts-demand-forecasting-a-different-perspective-for-planning-service-partsThe Forecast Matters, but Maybe Not the Way You Think
      True or false: The forecast doesn't matter to spare parts inventory management. At first glance, this statement seems obviously false. After all, forecasts are crucial for planning stock levels, right? It depends on what you mean by a “forecast”. If you mean an old-school single-number forecast (“demand for item CX218b will be 3 units next week and 6 units the week after”), then no. If you broaden the meaning of forecast to include a probability distribution taking account of uncertainties in both demand and supply, then yes. […]
    • Whyt MRO Businesses Should Care about Excess InventoryWhy MRO Businesses Should Care About Excess Inventory
      Do MRO companies genuinely prioritize reducing excess spare parts inventory? From an organizational standpoint, our experience suggests not necessarily. Boardroom discussions typically revolve around expanding fleets, acquiring new customers, meeting service level agreements (SLAs), modernizing infrastructure, and maximizing uptime. In industries where assets supported by spare parts cost hundreds of millions or generate significant revenue (e.g., mining or oil & gas), the value of the inventory just doesn’t raise any eyebrows, and organizations tend to overlook massive amounts of excessive inventory. […]
    • Top Differences between Inventory Planning for Finished Goods and for MRO and Spare PartsTop Differences Between Inventory Planning for Finished Goods and for MRO and Spare Parts
      In today’s competitive business landscape, companies are constantly seeking ways to improve their operational efficiency and drive increased revenue. Optimizing service parts management is an often-overlooked aspect that can have a significant financial impact. Companies can improve overall efficiency and generate significant financial returns by effectively managing spare parts inventory. This article will explore the economic implications of optimized service parts management and how investing in Inventory Optimization and Demand Planning Software can provide a competitive advantage. […]

      Here are six suggestions that you may find useful; they are distilled from working over thirty five years with some very smart practitioners. Cloud computing companies with unique server and hardware parts, e-commerce, online retailers, home and office supply companies, onsite furniture, power utilities, intensive assets maintenance or warehousing for water supply companies have increased their activity during the pandemic. Garages selling car parts and truck parts, pharmaceuticals, healthcare or medical supply manufacturers and safety product suppliers are dealing with increasing demand. Delivery service companies, cleaning services, liquor stores and canned or jarred goods warehouses, home improvement stores, gardening suppliers, yard care companies, hardware, kitchen and baking supplies stores, home furniture suppliers with high demand are facing stockouts, long lead times, inventory shortage costs, higher operating costs and ordering costs.

      5 Demand Planning Tips for Calculating Forecast Uncertainty

      The Smart Forecaster

       Pursuing best practices in demand planning,

      forecasting and inventory optimization

      Those who produce forecasts owe it to those who consume forecasts, and to themselves, to be aware of the uncertainty in their forecasts. This note is about how to estimate forecast uncertainty and use the estimates in your demand planning process. We focus on forecasts made in support of demand planning as well as forecasts inherent in optimizing inventory policies involving reorder points, safety stocks, and min/max levels.

      Reading this, you will learn about:

      -Criteria for assessing forecasts
      -Sources of forecast error
      -Calculating forecast error
      -Converting forecast error into prediction intervals
      -The relationship between demand forecasting and inventory optimization.
      -Actions you can take to use these concepts to improve your company’s processes.

      Criteria for Assessing Forecasts

      Forecast error alone is not reason enough to reject forecasting as a management tool. To twist a famous aphorism by George Box, “All forecasts are wrong, but some are useful.” Of course, business professionals will always search for ways to make forecasts more useful. This usually involves work to reduce forecast error. But while forecast accuracy is the most obvious criterion by which to judge forecasts, but it is not the only one. Here’s a list of criteria for evaluating forecasts:

      Accuracy: Forecasts of future values should, in retrospect, be very close to the actual values that eventually reveal themselves. But there may be diminishing returns to squeezing another half percent of accuracy out of forecasts otherwise good enough to use in decision making.

      Timeliness: Fighter pilots refer to the OODA Loop (Observe, Orient, Decide, and Act) and the “need to get inside the enemy’s OODA loop” so they can shoot first. Businesses too have decision cycles. Delivering a perfectly accurate forecast the day after it was needed is not helpful. Better is a good forecast that arrives in time to be useful.

      Cost: Forecasting data, models, processes and people all cost money.  A less expensive forecast might be fueled by data that are readily available; more expensive would be a forecast that runs on data that have to be collected in a special process outside the scope of a firm’s information infrastructure.  A classic, off-the-shelf forecasting technique will be less costly to acquire, feed and exploit than a complex, custom, consultant-supplied method. Forecasts could be mass-produced by software overseen by a single analyst, or they might emerge from a collaborative process requiring time and effort from large groups of people, such as district sales managers, production teams, and others. Technically advanced forecasting techniques often require hiring staff with specialized technical expertise, such as a master’s degree in statistics, who tend to cost more than staff with less advanced training.

      Credibility: Ultimately, some executive has to accept and act on each forecast. Executives have a tendency to distrust or ignore recommendations that they can neither understand nor explain to the next person above them in the hierarchy. For many, believing in a “black box” is too severe a test of faith, and they reject the black box’s forecasts in favor of something more transparent.

      All that said, we will focus now on forecast accuracy and its evil twin, forecast error.

      Sources of Forecast Error

      Those seeking to reduce error can look in three places to find trouble:
      1. The data that goes into a forecasting model
      2. The model itself
      3. The context of the forecasting exercise

      There are several ways in which data problems can lead to forecast error.

      Gross errors: Wrong data produce wrong forecasts. We have seen an instance in which computer records of product demand were wrong by a factor of two! Those involved spotted that problem immediately, but a less egregious situation can easily slip through to poison the forecasting process. In fact, just organizing, acquiring and checking data is often the largest source of delay in the implementation of forecasting software. Many data problems seem to derive from the data having been unimportant until a forecasting project made them important.

      Anomalies: Even with perfectly curated forecasting databases, there are often “needle in a haystack” type data problems. In these cases, it is not data errors but demand anomalies that contribute to forecast error. In a set of, say, 50,000 products, some number of items are likely to have odd details that can distort forecasts.

      Holdout analysis is a simple but powerful method of analysis. To see how well a method forecasts, use it with older known data to forecast newer data, then see how it would have turned out! For instance, suppose you have 36 months of demand data and need to forecast 3 months ahead. You can simulate the forecasting process by holding out (i.e., hiding) the most recent 3 months of data, forecasting using only data from months 1 to 33, then comparing the forecasts for months 34-36 against the actual values in months 34-36. Sliding simulation merely repeats the holdout analysis, sliding along the demand history. The example above used the first 33 months of data to get 3 estimates of forecast error. Suppose we start the process by using the first 12 months to forecast the next 3. Then we slide forward and use the first 13 months to forecast the next 3. We continue until finally we use the first 35 months to forecast the last month, giving us one more estimate of the error we make when forecasting one month ahead. Summarizing all the 1-step ahead, 2-step ahead and 3-step ahead forecast errors provides a way to calculate prediction intervals.

      Calculating Prediction Intervals

      The final step in calculating prediction intervals is to convert the estimates of average absolute error into the upper and lower limits of the prediction interval. The prediction interval at any future time is computed as

      Prediction interval = Forecast ± Multiplier x Average absolute error.

      The final step is the choice of the multiplier. The typical approach is to imagine some probability distribution of error around the forecast, then estimate the ends of the prediction interval using appropriate percentiles of that distribution. Usually, the assumed distribution of error is the Normal distribution, also called the Gaussian distribution or the “bell-shaped curve”.

      Use of Prediction Intervals
      The most immediate, informal use of prediction intervals is to convey a sense of how “squishy” a forecast is. Prediction intervals that are wide compared to the size of the forecasts indicate high uncertainty.

      There are two more formal uses in demand forecasting: Hedging your bets about future demand and guiding forecast adjustment.

      Hedging your bets: The forecast values themselves approximate the most likely values of future demand. A more ominous way to say the same thing is that there is about a 50% chance that the actual value will be above (or below) the forecast. If the forecast is being used to plan future production (or raw materials purchase or hiring), you might want to build in a cushion to keep from being caught short if demand spikes (assuming that under-building is worse than over-building). If the forecast is converted from units to dollars for revenue projections, you might want to use a value below the forecast to be conservative in projecting cash flow. In either case, you first have to choose the coverage of the prediction interval. A 90% prediction interval is a range of values that covers 90% of the possibilities. This implies that there is a 5% chance of a value falling above the upper limit of the 90% prediction interval. In other words, the upper limit of a 90% prediction interval marks the 95th percentile of the distribution of predicted demand at that time period. Similarly, there is a 5% chance of falling below the lower limit, which marks the 5th percentile of the demand distribution.

      Guiding forecast adjustment: It is quite common for statistical forecasts to be revised by some sort of collaborative process. These adjustments are based on information not recorded in an item’s demand history, such as intelligence about competitor actions. Sometimes they are based on a more vaporous source, such as sales force optimism. When the adjustments are made on-screen for all to see, the prediction intervals provide a useful reference: If someone wants to move the forecasts outside the prediction intervals, they are crossing a fact-based line and should have a good story to justify their argument that things will be really different in the future.

      Prediction Intervals and Inventory Optimization

      Finally, the concept behind prediction intervals play an essential role in a problem related to demand forecasting: Inventory Optimization.
      The core analytic task in setting reorder points (also called Mins) is to forecast total demand over a replenishment lead time. This total is called the lead time demand. When on-hand inventory falls down to or below the reorder point, a replenishment order is triggered. If the reorder point is high enough, there will be an acceptably small risk of a stockout, i.e., of lead time demand driving inventory below zero and creating either lost sales or backorders.

      SDP_Screenshot new statistical methods planning

      New statistical methods, and we can start planning more effectively.

      The forecasting task is to determine all the possible values of cumulative demand over the lead time and their associated probabilities of occurring. In other words, the basic task is to determine a prediction interval for some future random variable. Suppose you have computed a 90% prediction interval for lead time demand. Then the upper end of the interval represents the 95th percentile of the distribution. Setting the reorder point at this level will accommodate 95% of the possible lead time demand values, meaning there will be only a 5% chance of stocking out before replenishment arrives to re-stock the shelves. Thus there is an intimate relationship between prediction intervals in demand forecasting and calculation of reorder points in inventory optimization.


      5 Recommendations for Practice

      1. Set expectations about error: Sometimes  managers have unreasonable expectations about reducing forecast error to zero. You can point out that error is only one of the dimensions on which a forecasting process must be judged; you may be doing fine on both timeliness and cost. Also point out that zero error is no more realistic a goal than 100% conversion of prospects into customers, perfect supplier performance, or zero stock price volatility.

      2. Track down sources of error: Double check the accuracy of demand histories. Use statistical methods to identify outliers in demand histories and react appropriately, replacing verified anomalies with more typical values and omitting data from before major changes in the character of the demand. If you use a collaborative forecasting process, compare its accuracy against a purely statistical approach to identify items for which collaboration does not reduce error.

      3. Evaluate the error of alternative statistical methods: There may be off-the-shelf techniques that do better than your current methods, or do better for some subsets of your items. The key is to be empirical, using the idea of holdout analysis. Gather your data and do a “bake off” between different methods to see which work better for you. If you are not already using statistical forecasting methods, compare them against whoever’s “golden gut” is your current standard. Use the naïve forecast as a benchmark in the comparisons.

      4. Investigate the use of new data sources: Especially if you have items that are heavily promoted, test out statistical methods that incorporate promotional data into the forecasting process. Also check whether information from outside your company can be exploited; for instance, see whether macroeconomic indicators for your sector can be combined with company data to improve forecast accuracy (this is usually done using a method called multiple regression analysis).

      5. Use prediction intervals: Plots of prediction intervals can improve your feel for the uncertainty in your forecasts, helping you select items for additional scrutiny. While it’s true that what you don’t know can hurt you, it’s also true that knowing what you don’t know can help you.

      Leave a Comment

      Related Posts

      The Cost of Spreadsheet Planning

      The Cost of Spreadsheet Planning

      Companies that depend on spreadsheets for demand planning, forecasting, and inventory management are often constrained by the spreadsheet’s inherent limitations. This post examines the drawbacks of traditional inventory management approaches caused by spreadsheets and their associated costs, contrasting these with the significant benefits gained from embracing state-of-the-art planning technologies.

      Finding Your Spot on the Inventory Tradeoff Curve

      Finding Your Spot on the Inventory Tradeoff Curve

      This video blog holds essential insights for those working with the complexities of inventory management. The session focuses on striking the right balance within the inventory tradeoff curve, inviting viewers to understand the deep-seated importance of this equilibrium.

      Why MRO Businesses Need Add-on Service Parts Planning & Inventory Software

      Why MRO Businesses Need Add-on Service Parts Planning & Inventory Software

      MRO organizations exist in a wide range of industries, including public transit, electrical utilities, wastewater, hydro power, aviation, and mining. To get their work done, MRO professionals use Enterprise Asset Management (EAM) and Enterprise Resource Planning (ERP) systems. These systems are designed to do a lot of jobs. Given their features, cost, and extensive implementation requirements, there is an assumption that EAM and ERP systems can do it all. In this post, we summarize the need for add-on software that addresses specialized analytics for inventory optimization, forecasting, and service parts planning.

      Recent Posts

      • Epicor AI Forecasting and Inventory Technology Combined with Planner Knowledge for InsightsSmart Software to Present at Epicor Insights 2024
        Smart Software will present at this year's Epicor Insights event in Nashville. If you plan to attend this year, please join us at booth #13 or #501, and learn more about Epicor Smart Inventory Planning and Optimization. . […]
      • Looking for Trouble in Your Inventory DataLooking for Trouble in Your Inventory Data
        In this video blog, the spotlight is on a critical aspect of inventory management: the analysis and interpretation of inventory data. The focus is specifically on a dataset from a public transit agency detailing spare parts for buses. […]
      • BAF Case Study SIOP planning Distribution CenterBig Ass Fans Turns to Smart Software as Demand Heats Up
        Big Ass Fans is the best-selling big fan manufacturer in the world, delivering comfort to spaces where comfort seems impossible. BAF had a problem: how to reliably plan production to meet demand. BAF was experiencing a gap between bookings forecasts vs. shipments, and this was impacting revenue and customer satisfaction BAF turned to Smart Software for help. […]
      • The Cost of Doing nothing with your inventory Planning SystemsThe Cost of Spreadsheet Planning
        Companies that depend on spreadsheets for demand planning, forecasting, and inventory management are often constrained by the spreadsheet’s inherent limitations. This post examines the drawbacks of traditional inventory management approaches caused by spreadsheets and their associated costs, contrasting these with the significant benefits gained from embracing state-of-the-art planning technologies. […]
      • Randomness can be an Ally in the Forecasting BattleCan Randomness be an Ally in the Forecasting Battle?
        When we try to understand the complex world of logistics, randomness plays a pivotal role. This introduces an interesting paradox: In a reality where precision and certainty are prized, could the unpredictable nature of supply and demand actually serve as a strategic ally? The quest for accurate forecasts is not just an academic exercise; it's a critical component of operational success across numerous industries. For demand planners who must anticipate product demand, the ramifications of getting it right—or wrong—are critical. Hence, recognizing and harnessing the power of randomness isn't merely a theoretical exercise; it’s a necessity for resilience and adaptability in an ever-changing environment. […]

        Inventory Optimization for Manufacturers, Distributors, and MRO

        • Why MRO Businesses Need Add-on Service Parts Planning & Inventory SoftwareWhy MRO Businesses Need Add-on Service Parts Planning & Inventory Software
          MRO organizations exist in a wide range of industries, including public transit, electrical utilities, wastewater, hydro power, aviation, and mining. To get their work done, MRO professionals use Enterprise Asset Management (EAM) and Enterprise Resource Planning (ERP) systems. These systems are designed to do a lot of jobs. Given their features, cost, and extensive implementation requirements, there is an assumption that EAM and ERP systems can do it all. In this post, we summarize the need for add-on software that addresses specialized analytics for inventory optimization, forecasting, and service parts planning. […]
        • Spare-parts-demand-forecasting-a-different-perspective-for-planning-service-partsThe Forecast Matters, but Maybe Not the Way You Think
          True or false: The forecast doesn't matter to spare parts inventory management. At first glance, this statement seems obviously false. After all, forecasts are crucial for planning stock levels, right? It depends on what you mean by a “forecast”. If you mean an old-school single-number forecast (“demand for item CX218b will be 3 units next week and 6 units the week after”), then no. If you broaden the meaning of forecast to include a probability distribution taking account of uncertainties in both demand and supply, then yes. […]
        • Whyt MRO Businesses Should Care about Excess InventoryWhy MRO Businesses Should Care About Excess Inventory
          Do MRO companies genuinely prioritize reducing excess spare parts inventory? From an organizational standpoint, our experience suggests not necessarily. Boardroom discussions typically revolve around expanding fleets, acquiring new customers, meeting service level agreements (SLAs), modernizing infrastructure, and maximizing uptime. In industries where assets supported by spare parts cost hundreds of millions or generate significant revenue (e.g., mining or oil & gas), the value of the inventory just doesn’t raise any eyebrows, and organizations tend to overlook massive amounts of excessive inventory. […]
        • Top Differences between Inventory Planning for Finished Goods and for MRO and Spare PartsTop Differences Between Inventory Planning for Finished Goods and for MRO and Spare Parts
          In today’s competitive business landscape, companies are constantly seeking ways to improve their operational efficiency and drive increased revenue. Optimizing service parts management is an often-overlooked aspect that can have a significant financial impact. Companies can improve overall efficiency and generate significant financial returns by effectively managing spare parts inventory. This article will explore the economic implications of optimized service parts management and how investing in Inventory Optimization and Demand Planning Software can provide a competitive advantage. […]

          Cloud computing companies with unique server and hardware parts, e-commerce, online retailers, home and office supply companies, onsite furniture, power utilities, intensive assets maintenance or warehousing for water supply companies have increased their activity during the pandemic. Garages selling car parts and truck parts, pharmaceuticals, healthcare or medical supply manufacturers and safety product suppliers are dealing with increasing demand. Delivery service companies, cleaning services, liquor stores and canned or jarred goods warehouses, home improvement stores, gardening suppliers, yard care companies, hardware, kitchen and baking supplies stores, home furniture suppliers with high demand are facing stockouts, long lead times, inventory shortage costs, higher operating costs and ordering costs.

          Gaming Out Your Logistical Response to the Corona Virus

          The Smart Forecaster

           Pursuing best practices in demand planning,

          forecasting and inventory optimization

          ​As the world holds its breathe to see how the new corona virus (2019-nCOV) will play out, we cross our fingers for all those currently in quarantine or under treatment and pray that health authorities around the world will soon get the upper hand.

          This short note is about one way your business can develop a plan to adjust to one of the likely fallouts from the virus: sudden increases in the time it takes to get inventory replenishment from suppliers. Supply chains around the world are being disrupted. If this happens to you, how can you react in a systematic way?

          Reacting to Longer Lead Times

          This is a problem that can be solved using advanced supply chain analytics. Presumably, you may have already used this technology to make good choices for the control parameters used in managing all your inventory items, e.g., values for Min and Max or Reorder Point and Order Quantity. The specific technical question addressed here is how to convert an increase in replenishment lead time to changes in those control parameters.

          In general, longer lead times require fatter inventories if you want to maintain a high level of customer service. This general rule translates into larger values of Min and/or Max. How much larger depends critically on what new, longer lead time values will appear and their probabilities of occurring.

          While many planning software systems assume a fixed lead time, the reality is that almost all lead times have some degree of randomness. Typically, ignoring that randomness increases stockout risk, so having a good estimate of the probability distribution of lead times is important. In normal times, your transactional data can be used to estimate that relationship. But sudden disruptions like 2019-nCOV create unprecedented situations in which you have to make educated guesses about what new delays you will see and how likely they are. We will assume here that you can imagine some such scenarios and want to figure out how to best respond to them.

          An Example using Advanced Software

          To illustrate this type of prospective planning, consider a hypothetical example. One item, a spare part, has an established pattern of replenishment lead times, with delays of 5, 10 and 15 days occurring with 15%, 70% and 15% probabilities, respectively. Given this distribution and a random demand averaging one unit every 5 days, values of Min = 5 and Max = 10 do a good job. Figure 1 shows a simulation of 10 years of daily operation under this scenario. Fill rate and service level are high, and stockouts are infrequent.

          Now suppose that disruptions in the supply chain create a less favorable distribution of lead time, with a 50:50 mix of 15 and 30 days. Figure 2 shows how badly the current values of Min and Max perform in this new scenario. Fill rate and service level plummet due to frequent stockouts. Operating costs more than triple due to penalties for backorders. Only inventory investment (the average dollar value of stock on the shelf) seems to get better, but this happens only because so often there are backorders with nothing left on the shelf. The shift to longer lead times clearly requires new higher values of Min and Max.

          Figure 3 shows how the system performs when the Min is increased from 5 to 10 and the Max from 10 to 15. This change compensates for the longer lead times, restoring the previous high levels of fill rate and service level. Inventory investment is necessarily greater, but operating costs are actually lower than before.

          Summary

          Changes in normal operating conditions require adjustments in the way inventory items are managed. One such change looming large on this date is the potential impact of the 2019-nCOV Corona virus on supply chains, with anticipated increases in replenishment lead times.

          Changes in lead times require changes in inventory control parameters such as Min’s and Max’s. These changes are difficult to make with any confidence using pure guesswork. But with some estimate of the increase in lead times, you can use advanced software to learn how to make these adjustments with some confidence.

          This note illustrates this point using simulations of the daily operation of an inventory control system.

          Figure 1 Simulation of normal operations using current replenishment lead times, Min and Max

          Figure 2 Simulation of abnormal operations using longer lead times and current Min and Max

          Figure 3 Simulation of abnormal operations using longer lead times and revised Min and Max

          Leave a Comment

          Related Posts

          The Cost of Spreadsheet Planning

          The Cost of Spreadsheet Planning

          Companies that depend on spreadsheets for demand planning, forecasting, and inventory management are often constrained by the spreadsheet’s inherent limitations. This post examines the drawbacks of traditional inventory management approaches caused by spreadsheets and their associated costs, contrasting these with the significant benefits gained from embracing state-of-the-art planning technologies.

          Finding Your Spot on the Inventory Tradeoff Curve

          Finding Your Spot on the Inventory Tradeoff Curve

          This video blog holds essential insights for those working with the complexities of inventory management. The session focuses on striking the right balance within the inventory tradeoff curve, inviting viewers to understand the deep-seated importance of this equilibrium.

          Why MRO Businesses Need Add-on Service Parts Planning & Inventory Software

          Why MRO Businesses Need Add-on Service Parts Planning & Inventory Software

          MRO organizations exist in a wide range of industries, including public transit, electrical utilities, wastewater, hydro power, aviation, and mining. To get their work done, MRO professionals use Enterprise Asset Management (EAM) and Enterprise Resource Planning (ERP) systems. These systems are designed to do a lot of jobs. Given their features, cost, and extensive implementation requirements, there is an assumption that EAM and ERP systems can do it all. In this post, we summarize the need for add-on software that addresses specialized analytics for inventory optimization, forecasting, and service parts planning.

          Recent Posts

          • Epicor AI Forecasting and Inventory Technology Combined with Planner Knowledge for InsightsSmart Software to Present at Epicor Insights 2024
            Smart Software will present at this year's Epicor Insights event in Nashville. If you plan to attend this year, please join us at booth #13 or #501, and learn more about Epicor Smart Inventory Planning and Optimization. . […]
          • Looking for Trouble in Your Inventory DataLooking for Trouble in Your Inventory Data
            In this video blog, the spotlight is on a critical aspect of inventory management: the analysis and interpretation of inventory data. The focus is specifically on a dataset from a public transit agency detailing spare parts for buses. […]
          • BAF Case Study SIOP planning Distribution CenterBig Ass Fans Turns to Smart Software as Demand Heats Up
            Big Ass Fans is the best-selling big fan manufacturer in the world, delivering comfort to spaces where comfort seems impossible. BAF had a problem: how to reliably plan production to meet demand. BAF was experiencing a gap between bookings forecasts vs. shipments, and this was impacting revenue and customer satisfaction BAF turned to Smart Software for help. […]
          • The Cost of Doing nothing with your inventory Planning SystemsThe Cost of Spreadsheet Planning
            Companies that depend on spreadsheets for demand planning, forecasting, and inventory management are often constrained by the spreadsheet’s inherent limitations. This post examines the drawbacks of traditional inventory management approaches caused by spreadsheets and their associated costs, contrasting these with the significant benefits gained from embracing state-of-the-art planning technologies. […]
          • Randomness can be an Ally in the Forecasting BattleCan Randomness be an Ally in the Forecasting Battle?
            When we try to understand the complex world of logistics, randomness plays a pivotal role. This introduces an interesting paradox: In a reality where precision and certainty are prized, could the unpredictable nature of supply and demand actually serve as a strategic ally? The quest for accurate forecasts is not just an academic exercise; it's a critical component of operational success across numerous industries. For demand planners who must anticipate product demand, the ramifications of getting it right—or wrong—are critical. Hence, recognizing and harnessing the power of randomness isn't merely a theoretical exercise; it’s a necessity for resilience and adaptability in an ever-changing environment. […]

            Inventory Optimization for Manufacturers, Distributors, and MRO

            • Why MRO Businesses Need Add-on Service Parts Planning & Inventory SoftwareWhy MRO Businesses Need Add-on Service Parts Planning & Inventory Software
              MRO organizations exist in a wide range of industries, including public transit, electrical utilities, wastewater, hydro power, aviation, and mining. To get their work done, MRO professionals use Enterprise Asset Management (EAM) and Enterprise Resource Planning (ERP) systems. These systems are designed to do a lot of jobs. Given their features, cost, and extensive implementation requirements, there is an assumption that EAM and ERP systems can do it all. In this post, we summarize the need for add-on software that addresses specialized analytics for inventory optimization, forecasting, and service parts planning. […]
            • Spare-parts-demand-forecasting-a-different-perspective-for-planning-service-partsThe Forecast Matters, but Maybe Not the Way You Think
              True or false: The forecast doesn't matter to spare parts inventory management. At first glance, this statement seems obviously false. After all, forecasts are crucial for planning stock levels, right? It depends on what you mean by a “forecast”. If you mean an old-school single-number forecast (“demand for item CX218b will be 3 units next week and 6 units the week after”), then no. If you broaden the meaning of forecast to include a probability distribution taking account of uncertainties in both demand and supply, then yes. […]
            • Whyt MRO Businesses Should Care about Excess InventoryWhy MRO Businesses Should Care About Excess Inventory
              Do MRO companies genuinely prioritize reducing excess spare parts inventory? From an organizational standpoint, our experience suggests not necessarily. Boardroom discussions typically revolve around expanding fleets, acquiring new customers, meeting service level agreements (SLAs), modernizing infrastructure, and maximizing uptime. In industries where assets supported by spare parts cost hundreds of millions or generate significant revenue (e.g., mining or oil & gas), the value of the inventory just doesn’t raise any eyebrows, and organizations tend to overlook massive amounts of excessive inventory. […]
            • Top Differences between Inventory Planning for Finished Goods and for MRO and Spare PartsTop Differences Between Inventory Planning for Finished Goods and for MRO and Spare Parts
              In today’s competitive business landscape, companies are constantly seeking ways to improve their operational efficiency and drive increased revenue. Optimizing service parts management is an often-overlooked aspect that can have a significant financial impact. Companies can improve overall efficiency and generate significant financial returns by effectively managing spare parts inventory. This article will explore the economic implications of optimized service parts management and how investing in Inventory Optimization and Demand Planning Software can provide a competitive advantage. […]

              There is a way your business can develop a plan to adjust increasing Demand. Cloud computing companies with unique server and hardware parts, e-commerce, online retailers, home and office supply companies, onsite furniture, power utilities, intensive assets maintenance or warehousing for water supply companies have increased their activity during the pandemic.Delivery service companies, cleaning services, liquor stores and canned or jarred goods warehouses, home improvement stores, gardening suppliers, yard care companies, hardware, kitchen and baking supplies stores, home furniture suppliers with high demand are facing stockouts, long lead times, inventory shortage costs, higher operating costs and ordering costs. Garages selling car parts and truck parts, pharmaceuticals, healthcare or medical supply manufacturers and safety product suppliers are dealing with increasing demand.