Maximize Machine Uptime with Probabilistic Modeling

The Smart Forecaster

 Pursuing best practices in demand planning,

forecasting and inventory optimization

Two Inventory Problems

If you both make and sell things, you own two inventory problems. Companies that sell things must focus relentlessly on having enough product inventory to meet customer demand.  Manufacturers and asset intensive industries such as power generation, public transportation, mining, and refining, have an additional inventory concern:  having enough spare parts to keep their machines running. This technical brief reviews the basics of two probabilistic models of machine breakdown. It also relates machine uptime to the adequacy of spare parts inventory.


Modeling the failure of a machine treated as a “black box”

Just as product demand is inherently random, so is the timing of machine breakdowns. Likewise, just as probabilistic modeling is the right way to deal with random demand, it is also the right way to deal with random breakdowns.

Models of machine breakdown have two components. The first deals with the random duration of uptime. The second deals with the random duration of downtime.

The field of reliability theory offers several standard probability models describing the random time until failure of a machine without regard for the reason for the failure. The simplest model of uptime is the exponential distribution. This model says that the hazard rate, i.e., the chance of failing in the next instant of time, is constant no matter how long the system has been operating. The exponential model does a good job at modeling certain types of systems, especially electronics, but it is not universally applicable.


Download the Whitepaper


The next step up in model complexity is the Weibull model (pronounced “WHY-bull”). The Weibull distribution allows the risk of failure to change over time, either decreasing after a burn in period or, more often, increasing as wear and tear accumulate. The exponential distribution is a special case of the Weibull distribution in which the hazard rate is neither increasing nor decreasing.

Weibull Reliability Plot

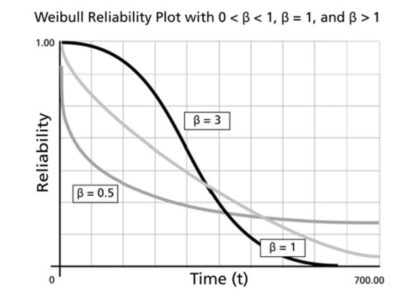
Figure 1: Three different Weibull survival curves

Figure 1 illustrates the Weibull model’s probability that a machine is still running as a function of how long it has been running. There are three curves corresponding to constant, decreasing and increasing hazard rates. For obvious reasons, these are called survival curves because they plot the probability of surviving for various amounts of time (but they are also called reliability curves). The black curve that starts high and sinks fast (β=3) depicts a machine that wears out with age. The lightest curve in the middle fast (β=1) shows the exponential distribution. The medium-dark curve (β=0.5)  is one that has a high early hazard rate but gets better with age.

Of course, there is another phenomenon that needs to be included in the analysis: downtime. Modeling downtime is where inventory theory enters the picture. Downtime is modeled by a mixture of two different distributions. If a spare part is available to replace the failed part, then the downtime can be very brief, say one day. But if there is no spare in stock, then the downtime can be quite long. Even if the spare can be obtained on an expedited basis, it may be several days or a week before the machine can be repaired. If the spare must be fabricated by a far-away supplier and shipped by sea then by rail then trucked to your plant, the downtime could be weeks or months. This all means that keeping a proper inventory of spares is very important to keeping production humming along.

In this aggregated type of analysis, the machine is treated as a black box that is either working or not. Though ignoring the details of which part failed and when, such a model is useful for sizing the pool of machines needed to maintain some minimum level of production capacity with high probability.

The binomial distribution is the probability model relevant to this problem. The binomial is the same model that describes, for example, the distribution of the number of “heads” resulting from twenty tosses of a coin. In the machine reliability problem, the machines correspond to coins, and an outcome of heads corresponds to having a working machine.

As an example, if

  • the chance that any given machine is running on any particular day is 90%
  • machine failures are independent (e.g., no flood or tornado to wipe them all out at once)
  • you require at least a 95% chance that at least 5 machines are running on any given day

then the binomial model prescribes seven machines to achieve your goal.


Modeling machine failures based on component failures

Maximize Machine Uptime with Probabilistic Modeling

The Weibull model can also be used to describe the failure of a single part. However, any realistically complex production machine will have multiple parts and therefore have multiple failure modes. This means that calculating the time until the machine fails requires analysis of a “race to failure”, with each part vying for the “honor” of being the first to fail.

If we make the reasonable assumption that parts fail independently, standard probability theory points the way to combining the models of individual part failure into an overall model of machine failure. The time until the first of many parts fails has a poly-Weibull distribution. At this point, though, the analysis can get quite complicated, and the best move may be to switch from analysis-by-equation to analysis-by-simulation.


Simulating machine failure from the details of part failures

Simulation analysis got its modern start as a spinoff of the Manhattan Project to build the first atomic bomb. The method is also commonly called Monte Carlo simulation after the biggest gambling center on earth back in the day (today it would be “Macau simulation”).

A simulation model converts the logic of the sequence of random events into corresponding computer code. Then it uses computer-generated (pseudo-)random numbers as fuel to drive the simulation model. For example, each component’s failure time is created by drawing from its particular Weibull failure time distribution. Then the soonest of those failure times begins the next episode of machine downtime.

simulation of machine uptime over one year of operation

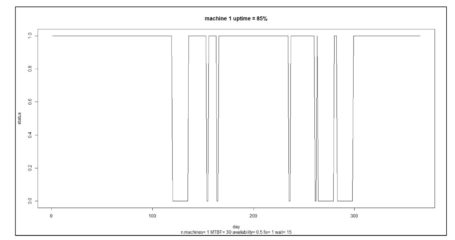
Figure 2: A simulation of machine uptime over one year of operation

Figure 2 shows the results of a simulation of the uptime of a single machine. Machines cycle through alternating periods of uptime and downtime. In this simulation, uptime is assumed to have an exponential distribution with an average duration (MTBF = Mean Time Before Failure) of 30 days. Downtime has a 50:50 split between 1 day if a spare is available and 30 days if not. In the simulation shown in Figure 2, the machine is working during 85% of the days in one year of operation.


An approximate formula for machine uptime

Although Monte Carlo simulation can provide more exact results, a simpler algebraic model does well as an approximation and makes it easier to see how the key variables relate.

Define the following key variables:

  • MTBF = Mean Time Before Failure (days)
  • Pa = Probability that there is a spare part available when needed
  • MDTshort = Mean Down Time if there is a spare available when needed
  • MDTlong = Mean Down Time if there is no spare available when needed
  • Uptime = Percentage of days in which the machine is up and running.

Then there is a simple approximation for the Uptime:

Uptime ≈ 100 x MTBF/(MTBF + MDTshort x Pa + MDTlong x (1-Pa)).    (Equation 1)

Equation 1 tells us that the uptime depends on the availability of a spare. If there is always a spare (Pa=1), then uptime achieves a peak value of about 100 x MTBF/(MTBF + MDTshort). If there is never a spare available (Pa=0), then uptime achieve its lowest value of about 100 x MTBF/(MTBF + MDTlong). When the repair time is about as long as the typical time between failures, uptime sinks to an unacceptable level near 50%. If a spare is always available, uptime can approach 100%.

Relating machine downtime to spare parts inventory

Minimizing downtime requires a multi-pronged initiative involving intensive operator training, use of quality raw materials, effective preventive maintenance – and adequate spare parts. The first three set the conditions for good results. The last deals with contingencies.

Inventory Planning for Manufacturers MRO SAAS

Once a machine is down, money is flying out the door and there is a premium on getting it back up pronto. This scene could play out in two ways. The good one has a spare part ready to go, so the downtime can be kept to a minimum. The bad one has no available spare, so there is a scramble to expedite delivery of the needed part. In this case, the manufacturer must bear both the cost of lost production and the cost of expedited shipping, if that is even an option.

If the inventory system is properly designed, spare parts availability will not be a major impediment to machine uptime. By the design of an inventory system, I mean the results of several choices: whether the shortage policy is a backorder policy or a loss policy, whether the inventory review cycle is periodic or continuous, and what reorder points and order quantities are established.

When inventory policies for products are designed, they are evaluated using several criteria. Service Level is the percentage of replenishment periods that pass without a stockout. Fill Rate is the percentage of units ordered that is supplied immediately from stock. Average Inventory Level is the typical number of units on hand.

None of these is exactly the metric needed for spare parts stocking, though they all are related. The needed metric is Item Availability, which is the percentage of days in which there is at least one spare ready for use. Higher Service Levels, Fill Rates, and Inventory Levels all imply high Item Availability, and there are ways to convert from one to the other. (When dealing with multiple machines sharing the same stock of spares, Inventory Availability gets replaced by the probability distribution of the number of spares on any given day. We leave that more complex problem for another day.)

Clearly, keeping a good supply of spares reduces the costs of machine downtime. Of course, keeping a good supply of spares creates its own inventory holding and ordering costs. This is the manufacturer’s second inventory problem. As with any decision involving inventory, the key is to strike the right balance between these two competing cost centers. See this article on probabilistic forecasting for intermittent demand for guidance on striking that balance.


Leave a Comment

Related Posts

No Results Found

The page you requested could not be found. Try refining your search, or use the navigation above to locate the post.

Recent Posts

  • Managing Spare Parts Inventory: Best PracticesManaging Spare Parts Inventory: Best Practices
    In this blog, we’ll explore several effective strategies for managing spare parts inventory, emphasizing the importance of optimizing stock levels, maintaining service levels, and using smart tools to aid in decision-making. Managing spare parts inventory is a critical component for businesses that depend on equipment uptime and service reliability. Unlike regular inventory items, spare parts often have unpredictable demand patterns, making them more challenging to manage effectively. An efficient spare parts inventory management system helps prevent stockouts that can lead to operational downtime and costly delays while also avoiding overstocking that unnecessarily ties up capital and increases holding costs. […]
  • 5 Ways to Improve Supply Chain Decision Speed5 Ways to Improve Supply Chain Decision Speed
    The promise of a digital supply chain has transformed how businesses operate. At its core, it can make rapid, data-driven decisions while ensuring quality and efficiency throughout operations. However, it's not just about having access to more data. Organizations need the right tools and platforms to turn that data into actionable insights. This is where decision-making becomes critical, especially in a landscape where new digital supply chain solutions and AI-driven platforms can support you in streamlining many processes within the decision matrix. […]
  • Two employees checking inventory in temporary storage in a distribution warehouse.12 Causes of Overstocking and Practical Solutions
    Managing inventory effectively is critical for maintaining a healthy balance sheet and ensuring that resources are optimally allocated. Here is an in-depth exploration of the main causes of overstocking, their implications, and possible solutions. […]
  • FAQ Mastering Smart IP&O for Better Inventory ManagementFAQ: Mastering Smart IP&O for Better Inventory Management.
    Effective supply chain and inventory management are essential for achieving operational efficiency and customer satisfaction. This blog provides clear and concise answers to some basic and other common questions from our Smart IP&O customers, offering practical insights to overcome typical challenges and enhance your inventory management practices. Focusing on these key areas, we help you transform complex inventory issues into strategic, manageable actions that reduce costs and improve overall performance with Smart IP&O. […]
  • 7 Key Demand Planning Trends Shaping the Future7 Key Demand Planning Trends Shaping the Future
    Demand planning goes beyond simply forecasting product needs; it's about ensuring your business meets customer demands with precision, efficiency, and cost-effectiveness. Latest demand planning technology addresses key challenges like forecast accuracy, inventory management, and market responsiveness. In this blog, we will introduce critical demand planning trends, including data-driven insights, probabilistic forecasting, consensus planning, predictive analytics, scenario modeling, real-time visibility, and multilevel forecasting. These trends will help you stay ahead of the curve, optimize your supply chain, reduce costs, and enhance customer satisfaction, positioning your business for long-term success. […]

    Inventory Optimization for Manufacturers, Distributors, and MRO

    • Managing Spare Parts Inventory: Best PracticesManaging Spare Parts Inventory: Best Practices
      In this blog, we’ll explore several effective strategies for managing spare parts inventory, emphasizing the importance of optimizing stock levels, maintaining service levels, and using smart tools to aid in decision-making. Managing spare parts inventory is a critical component for businesses that depend on equipment uptime and service reliability. Unlike regular inventory items, spare parts often have unpredictable demand patterns, making them more challenging to manage effectively. An efficient spare parts inventory management system helps prevent stockouts that can lead to operational downtime and costly delays while also avoiding overstocking that unnecessarily ties up capital and increases holding costs. […]
    • Innovating the OEM Aftermarket with AI-Driven Inventory Optimization XLInnovating the OEM Aftermarket with AI-Driven Inventory Optimization
      The aftermarket sector provides OEMs with a decisive advantage by offering a steady revenue stream and fostering customer loyalty through the reliable and timely delivery of service parts. However, managing inventory and forecasting demand in the aftermarket is fraught with challenges, including unpredictable demand patterns, vast product ranges, and the necessity for quick turnarounds. Traditional methods often fall short due to the complexity and variability of demand in the aftermarket. The latest technologies can analyze large datasets to predict future demand more accurately and optimize inventory levels, leading to better service and lower costs. […]
    • Future-Proofing Utilities. Advanced Analytics for Supply Chain OptimizationFuture-Proofing Utilities: Advanced Analytics for Supply Chain Optimization
      Utilities in the electrical, natural gas, urban water, and telecommunications fields are all asset-intensive and reliant on physical infrastructure that must be properly maintained, updated, and upgraded over time. Maximizing asset uptime and the reliability of physical infrastructure demands effective inventory management, spare parts forecasting, and supplier management. A utility that executes these processes effectively will outperform its peers, provide better returns for its investors and higher service levels for its customers, while reducing its environmental impact. […]
    • Centering Act Spare Parts Timing Pricing and ReliabilityCentering Act: Spare Parts Timing, Pricing, and Reliability
      In this article, we'll walk you through the process of crafting a spare parts inventory plan that prioritizes availability metrics such as service levels and fill rates while ensuring cost efficiency. We'll focus on an approach to inventory planning called Service Level-Driven Inventory Optimization. Next, we'll discuss how to determine what parts you should include in your inventory and those that might not be necessary. Lastly, we'll explore ways to enhance your service-level-driven inventory plan consistently. […]

      Want to Optimize Inventory? Follow These 4 Steps

      The Smart Forecaster

       Pursuing best practices in demand planning,

      forecasting and inventory optimization

      Service Level Driven Planning (SLDP) is an approach to inventory planning. It prescribes optimal service level targets continually identifies and communicates trade-offs between service and cost that are at the root of all wise inventory decisions. When an organization understands this relationship, they can communicate where they are at risk, where they are not, and effectively wield their inventory assets.  SLDP helps expose inventory imbalances and enables informed decisions on how best to correct them.  To implement SLDP, you’ll need to look beyond traditional planning approaches such as arbitrary service level targeting (all of my A items should get 99% service level, B items 95%, C items 80%, etc.) and demand forecasting that unrealistically attempts to predict exactly what will happen and when. SLDP unfolds in 4 steps: Benchmark, Collaborate, Plan, and Track.


      Step 1. Benchmark Performance


      All participants in the inventory planning and investment process must hold a common understanding of how current policy is performing across an agreed upon set of inventory metrics. Metrics should include historically achieved service levels and fill rates, delivery time to customers, supplier lead time performance, inventory turns, and inventory investment. Once these metrics have been benchmarked and can be reported on daily, the organization will have the information it needs to begin prioritize planning efforts. For example, if inventory has increased but service levels have not, this would indicate that the inventory is not being properly allocated across SKUs.  Reports should be generated within mouse-clicks enabling planners to focus on analysis instead of time intensive report generation.   Past performance isn’t a guarantee of future performance since demand variability, costs, priorities, and lead times are always changing. So SLDP enables predictive benchmarking that estimates what performance is likely to be in the future. Inventory optimization software utilizing probability forecasting can be used to estimate a realistic range of potential demands and replenishment cycles stress testing your planning parameters helping uncover how often and which items to expect stockouts and excess.


      Step 2. “What if” Planning & Collaboration


      “What if” inventory modeling and collaboration is at the heart of SLDP. The historical and predictive benchmarks should first be shared with all relevant stakeholders including sales, finance, and operations. Efforts should be placed on answering the following questions:

      – Are both the current performance and investment acceptable?
      – If not, how should they be improved?
      – Which SKUs are likely to be demanded next and in what quantities?
      – Where are we willing to take more stock out risk?
      – Where must stock-out risk be minimized?
      – What are the specific stock out costs?
      – What business rules and constraints must we adhere to (customer service level agreements, inventory thresholds, etc.)

      Once the above questions are answered, new inventory planning policies can be developed.  Inventory Optimization software can reconcile all costs associated with managing inventory including stockout costs to generate the right set of planning parameters (min/max, safety stock, reorder points, etc.) and prescribed service levels.  The optimal policy can be compared to the current policy and modified based on constraints and business rules. For example, certain items might be targeted at a target service level in order to conform to a customer service level agreement.   Various “what if” inventory planning scenarios can be developed and shared with key stakeholders. For example, you might model how shorter lead times impacts inventory costs. Once consensus has been achieved and the risks and costs are clearly communicated,  the modified policies can be uploaded to the ERP system to drive inventory replenishment.


      Step 3. Continually Plan and Manage by Exception

      SLDP continually reforecasts optimized planning parameters based on changing demands, lead times, costs, and other factors. This means that service levels and inventory value have the potential to change.  For example, the prescribed service level target of 95% might increase to 99% the next planning period if the stock-out costs on that item increased suddenly. This is also true if opting to arbitrarily target a given service level or fix planning parameters to a specific unit quantity. For example, a target service level of 95% might require $1,000 in inventory today but $2,000 next month if lead times spiked.  Similarly, a reorder point of 10 units might get 95% service today and only 85% service next month in response to increased demand variability. Inventory Optimization software will identify which items are forecasted to have significant changes in service level and/or inventory value and which items aren’t being ordered according to the consensus plan. Exception lists are automatically produced making it easy for you to review these items and decide how to manage them moving forward. Prescriptive Analytics can help identify whether the root cause of the change is a demand anomaly, change in overall demand variability, change in lead time, or change in cost helping you fine tune the policy accordingly.


      Step 4. Track Ongoing Performance


      SLDP processes regularly measure historical and current operational performance.   Results must be monitored to ensure that service levels are improving and inventory levels are decreasing when compared to the historical benchmarks determined in Step 1.  Track metrics such as turns, aggregate and item specific service levels, fill rates, out-of-stocks, and supplier lead time performance.  Share results across the organization and identify root causes to operational inefficiencies.  SLDP processes makes performance tracking easy by providing tools that automatically generate the necessary reports rather than placing this burden on planners to manage in Excel. Doing so enables the organization to uncover operational issues impacting performance and provide feedback on what is working and what should be improved.

      Conclusion

      The SLDP framework is a way to rationalize the inventory planning process and generate a significant economic return. Its organizing principle is that customer service levels and inventory costs associated with the chosen policy should be understood, tracked, and continually refined. Utilizing inventory optimization software helps ensure that you are able to identify the least-cost service level.  This creates a coherent, company-wide effort that combines visibility into current operations with scientific assessments of future risks and conditions. It is realized by a combination of executive vision, staff subject matter expertise, and the power of modern inventory planning and optimization software.

      See how Smart Inventory Optimization Supports Service Level Driven Planning and download the product sheet here: https://smartcorp.com/inventory-optimization/

      Leave a Comment

      Related Posts

      No Results Found

      The page you requested could not be found. Try refining your search, or use the navigation above to locate the post.

      Recent Posts

      • Managing Spare Parts Inventory: Best PracticesManaging Spare Parts Inventory: Best Practices
        In this blog, we’ll explore several effective strategies for managing spare parts inventory, emphasizing the importance of optimizing stock levels, maintaining service levels, and using smart tools to aid in decision-making. Managing spare parts inventory is a critical component for businesses that depend on equipment uptime and service reliability. Unlike regular inventory items, spare parts often have unpredictable demand patterns, making them more challenging to manage effectively. An efficient spare parts inventory management system helps prevent stockouts that can lead to operational downtime and costly delays while also avoiding overstocking that unnecessarily ties up capital and increases holding costs. […]
      • 5 Ways to Improve Supply Chain Decision Speed5 Ways to Improve Supply Chain Decision Speed
        The promise of a digital supply chain has transformed how businesses operate. At its core, it can make rapid, data-driven decisions while ensuring quality and efficiency throughout operations. However, it's not just about having access to more data. Organizations need the right tools and platforms to turn that data into actionable insights. This is where decision-making becomes critical, especially in a landscape where new digital supply chain solutions and AI-driven platforms can support you in streamlining many processes within the decision matrix. […]
      • Two employees checking inventory in temporary storage in a distribution warehouse.12 Causes of Overstocking and Practical Solutions
        Managing inventory effectively is critical for maintaining a healthy balance sheet and ensuring that resources are optimally allocated. Here is an in-depth exploration of the main causes of overstocking, their implications, and possible solutions. […]
      • FAQ Mastering Smart IP&O for Better Inventory ManagementFAQ: Mastering Smart IP&O for Better Inventory Management.
        Effective supply chain and inventory management are essential for achieving operational efficiency and customer satisfaction. This blog provides clear and concise answers to some basic and other common questions from our Smart IP&O customers, offering practical insights to overcome typical challenges and enhance your inventory management practices. Focusing on these key areas, we help you transform complex inventory issues into strategic, manageable actions that reduce costs and improve overall performance with Smart IP&O. […]
      • 7 Key Demand Planning Trends Shaping the Future7 Key Demand Planning Trends Shaping the Future
        Demand planning goes beyond simply forecasting product needs; it's about ensuring your business meets customer demands with precision, efficiency, and cost-effectiveness. Latest demand planning technology addresses key challenges like forecast accuracy, inventory management, and market responsiveness. In this blog, we will introduce critical demand planning trends, including data-driven insights, probabilistic forecasting, consensus planning, predictive analytics, scenario modeling, real-time visibility, and multilevel forecasting. These trends will help you stay ahead of the curve, optimize your supply chain, reduce costs, and enhance customer satisfaction, positioning your business for long-term success. […]

        Inventory Optimization for Manufacturers, Distributors, and MRO

        • Managing Spare Parts Inventory: Best PracticesManaging Spare Parts Inventory: Best Practices
          In this blog, we’ll explore several effective strategies for managing spare parts inventory, emphasizing the importance of optimizing stock levels, maintaining service levels, and using smart tools to aid in decision-making. Managing spare parts inventory is a critical component for businesses that depend on equipment uptime and service reliability. Unlike regular inventory items, spare parts often have unpredictable demand patterns, making them more challenging to manage effectively. An efficient spare parts inventory management system helps prevent stockouts that can lead to operational downtime and costly delays while also avoiding overstocking that unnecessarily ties up capital and increases holding costs. […]
        • Innovating the OEM Aftermarket with AI-Driven Inventory Optimization XLInnovating the OEM Aftermarket with AI-Driven Inventory Optimization
          The aftermarket sector provides OEMs with a decisive advantage by offering a steady revenue stream and fostering customer loyalty through the reliable and timely delivery of service parts. However, managing inventory and forecasting demand in the aftermarket is fraught with challenges, including unpredictable demand patterns, vast product ranges, and the necessity for quick turnarounds. Traditional methods often fall short due to the complexity and variability of demand in the aftermarket. The latest technologies can analyze large datasets to predict future demand more accurately and optimize inventory levels, leading to better service and lower costs. […]
        • Future-Proofing Utilities. Advanced Analytics for Supply Chain OptimizationFuture-Proofing Utilities: Advanced Analytics for Supply Chain Optimization
          Utilities in the electrical, natural gas, urban water, and telecommunications fields are all asset-intensive and reliant on physical infrastructure that must be properly maintained, updated, and upgraded over time. Maximizing asset uptime and the reliability of physical infrastructure demands effective inventory management, spare parts forecasting, and supplier management. A utility that executes these processes effectively will outperform its peers, provide better returns for its investors and higher service levels for its customers, while reducing its environmental impact. […]
        • Centering Act Spare Parts Timing Pricing and ReliabilityCentering Act: Spare Parts Timing, Pricing, and Reliability
          In this article, we'll walk you through the process of crafting a spare parts inventory plan that prioritizes availability metrics such as service levels and fill rates while ensuring cost efficiency. We'll focus on an approach to inventory planning called Service Level-Driven Inventory Optimization. Next, we'll discuss how to determine what parts you should include in your inventory and those that might not be necessary. Lastly, we'll explore ways to enhance your service-level-driven inventory plan consistently. […]

          Six Tips for New Demand Planners

          The Smart Forecaster

           Pursuing best practices in demand planning,

          forecasting and inventory optimization

          If you are a new professional in the field of demand planning and inventory management, you face a very steep learning curve. There are many moving parts in the system you manage, and much of the movement is random. You may find it helpful to take a step back from the day-to-day flow to think about what it takes to be a successful demand planner. Here are six tips for new demand planners that you may find useful; they are distilled from working over thirty five years with some very smart practitioners.

          1. Know what winning means.

          Inventory management and demand planning is not a squishy area where success can be described in vague language. Success here is a numbers game. There a number of key performance indicators (KPI’s) available to you, including Service Level, Fill Rate, Inventory Turns, Inventory Investment, and Inventory Operating Cost. Companies differ in the importance they assign to each metric such, but you can’t win without using some or all of these to keep score.

          But “winning” is not as simple as getting the best possible score on each metric. The metric values that are most important vary across companies. Your company may prioritize customer service over cost control, or vice versa, and next year it might have reason to reverse that preference.

          Furthermore, there are linkages among KPI’s that require you to think of them simultaneously rather than as a collection of independent scores. For example, improving Service Level will usually also improve Fill Rate, which is good, but it will also usually increase Operating Cost, which is not good.

          These linkages express themselves as tradeoffs. And while the KPI’s themselves are numbers, the management of the bundle of KPI’s requires some wise subjectivity, because what is needed is a reasonable balance among competing forces. The fundamental tradeoff is to balance the cost of having inventory against the value of having the inventory available to those who need it.

          If you are relatively junior demand planner, these tradeoff judgments may be made higher in the organization, but even then you can play a useful role by insuring that the tradeoffs are exposed and appreciated. This means exposed at a quantitative level, e.g., “We can increase Service Level from 85% to 90%, but it will require $100K more stock in the warehouse.” This kind of specific quantitative knowledge can be provided by advanced supply chain analytics.

          2. Keep score.

          We’re all a bit squeamish about being measured, but confident professionals insist on keeping score. Enlightened supervisors understand that external forces can ding the performance of your system (e.g., a key supplier disappears), and that always helps. But whether or not you have good top cover, you cannot demonstrate success, nor can you react to problems, without measuring those KPI’s.

          Keeping score is important, but so is understanding what influences score. Suppose your Service Level has dropped from last month’s value. Is that just the usual month-to-month fluctuation or is it something out of the ordinary? If it is problematic, then you need to diagnose the problem. Often there are several possible suspects. For example, Service Level can drop because the sales and marketing folks did something great and demand has spiked, or because a supplier did something not so great and replenishment lead time has tanked. Software can help you track these key inputs to help your detective work, and supply chain analytics can estimate the impacts of changes in these inputs and point you to compensating responses.

          3. Be sure your decisions are fact-based.

          Software can guide you to good decisions, but only if you let it. Inputs such as holding costs, ordering costs, and shortage costs need to be well estimated to get accurate assessment of tradeoffs. Especially important is something as apparently simple as using correct values for item demand, since modeling demand is the starting point for simulating the results of any proposed inventory system design. In fact, if we are willing to stretch the meaning of “fact” a bit to include the results of system simulations, you should not commit to major changes without having reliable predictions of what will happen when you commit to those changes.

          4. Realize that yesterday’s answer may not be today’s answer.

          Supply chains are collections of parts, all of which are subject to change over time. Demand that is trending up may start to trend down. Replenishment lead times may slip. Supplier order minima may increase. Component prices may increase due to tariffs. Such factors mean that the facts you collected yesterday can be out of date today, making yesterday’s decisions inappropriate for today’s problems. Vigilance. Check out a prior article detailing the adverse financial impact of infrequent updates to planning parameters.

          5. Give each item its due.

          If you are responsible for forecasting hundreds or thousands of inventory items, you will be tempted to simplify your life by adopting a “one size fits all” approach. Don’t. SKU’s aren’t exactly like snowflakes, but some differentiation is required to do your job well. It’s a good idea to form groups of items based on some salient characteristics. Some items are critical and must (almost) always be available; others can run some reasonable risk of being backordered. Some items are quite unpredictable because they are “intermittent” (i.e., have lots of zero values with nonzero values mixed in at random); others have high volume and are reasonably predictable. Some items can be managed with relatively inexpensive inventory methods that make adjustments every month; some items need methods that continuously monitor and adjust the stock on hand. Some items, such as contractual purchases, may be so predictable that you can treat them as “planned demand” and pull them out from the rest.

          Once you have formed sensible item groups, you still have decisions to make about each item in each group, such as deciding their demand forecasts, reorder points and order quantities. Here advanced demand planning software can take over and automatically compute the best choices based on what winning means in the context of that group.  

          6. Get everybody on the same page.

          Being organized is not only pleasing, it’s efficient. If you have a system for demand planning and inventory management, then everybody on your team shares the same objectives and follows the same processes. If you don’t have a system, then every demand planner has his or her own way of thinking about the problem and making decisions. Some of those are bound to be better than others. It’s desirable to standardize on the best practices and ban the rest. Besides being more efficient, having a standardized process makes it easier to diagnose problems when things go wrong and to implement fixes.


          Volume and color boxes in a warehouese


          Leave a Comment

          Related Posts

          Reveal Your Real Inventory Planning and Forecasting Policy by Answering These 10 Questions

          Reveal Your Real Inventory Planning and Forecasting Policy by Answering These 10 Questions

          In this blog, we review 10 specific questions you can ask to uncover what’s really happening with the inventory planning and demand forecasting policy at your company. We detail the typical answers provided when a forecasting/inventory planning policy doesn’t really exist, explain how to interpret these answers, and offer some clear advice on what to do about it.

          The Trouble With Turns

          The Trouble With Turns

          In our travels around the industrial scene, we notice that many companies pay more attention to inventory Turns than they should. We would like to deflect some of this attention to more consequential performance metrics.

          The Scourge of Skewness

          The Scourge of Skewness

          Demand planners have to cope with multiple problems to get their job done. One is the Irritation of Intermittency. The “now you see it, now you don’t” character of intermittent demand, with its heavy mix of zero values, forces the use of advanced statistical methods, such as Smart Software’s patented Markov Bootstrap algorithm. But even within the dark realm of intermittent demand, there are degrees of difficulty: planners must further cope with the potentially costly Scourge of Skewness.

          Recent Posts

          • Managing Spare Parts Inventory: Best PracticesManaging Spare Parts Inventory: Best Practices
            In this blog, we’ll explore several effective strategies for managing spare parts inventory, emphasizing the importance of optimizing stock levels, maintaining service levels, and using smart tools to aid in decision-making. Managing spare parts inventory is a critical component for businesses that depend on equipment uptime and service reliability. Unlike regular inventory items, spare parts often have unpredictable demand patterns, making them more challenging to manage effectively. An efficient spare parts inventory management system helps prevent stockouts that can lead to operational downtime and costly delays while also avoiding overstocking that unnecessarily ties up capital and increases holding costs. […]
          • 5 Ways to Improve Supply Chain Decision Speed5 Ways to Improve Supply Chain Decision Speed
            The promise of a digital supply chain has transformed how businesses operate. At its core, it can make rapid, data-driven decisions while ensuring quality and efficiency throughout operations. However, it's not just about having access to more data. Organizations need the right tools and platforms to turn that data into actionable insights. This is where decision-making becomes critical, especially in a landscape where new digital supply chain solutions and AI-driven platforms can support you in streamlining many processes within the decision matrix. […]
          • Two employees checking inventory in temporary storage in a distribution warehouse.12 Causes of Overstocking and Practical Solutions
            Managing inventory effectively is critical for maintaining a healthy balance sheet and ensuring that resources are optimally allocated. Here is an in-depth exploration of the main causes of overstocking, their implications, and possible solutions. […]
          • FAQ Mastering Smart IP&O for Better Inventory ManagementFAQ: Mastering Smart IP&O for Better Inventory Management.
            Effective supply chain and inventory management are essential for achieving operational efficiency and customer satisfaction. This blog provides clear and concise answers to some basic and other common questions from our Smart IP&O customers, offering practical insights to overcome typical challenges and enhance your inventory management practices. Focusing on these key areas, we help you transform complex inventory issues into strategic, manageable actions that reduce costs and improve overall performance with Smart IP&O. […]
          • 7 Key Demand Planning Trends Shaping the Future7 Key Demand Planning Trends Shaping the Future
            Demand planning goes beyond simply forecasting product needs; it's about ensuring your business meets customer demands with precision, efficiency, and cost-effectiveness. Latest demand planning technology addresses key challenges like forecast accuracy, inventory management, and market responsiveness. In this blog, we will introduce critical demand planning trends, including data-driven insights, probabilistic forecasting, consensus planning, predictive analytics, scenario modeling, real-time visibility, and multilevel forecasting. These trends will help you stay ahead of the curve, optimize your supply chain, reduce costs, and enhance customer satisfaction, positioning your business for long-term success. […]

            Inventory Optimization for Manufacturers, Distributors, and MRO

            • Managing Spare Parts Inventory: Best PracticesManaging Spare Parts Inventory: Best Practices
              In this blog, we’ll explore several effective strategies for managing spare parts inventory, emphasizing the importance of optimizing stock levels, maintaining service levels, and using smart tools to aid in decision-making. Managing spare parts inventory is a critical component for businesses that depend on equipment uptime and service reliability. Unlike regular inventory items, spare parts often have unpredictable demand patterns, making them more challenging to manage effectively. An efficient spare parts inventory management system helps prevent stockouts that can lead to operational downtime and costly delays while also avoiding overstocking that unnecessarily ties up capital and increases holding costs. […]
            • Innovating the OEM Aftermarket with AI-Driven Inventory Optimization XLInnovating the OEM Aftermarket with AI-Driven Inventory Optimization
              The aftermarket sector provides OEMs with a decisive advantage by offering a steady revenue stream and fostering customer loyalty through the reliable and timely delivery of service parts. However, managing inventory and forecasting demand in the aftermarket is fraught with challenges, including unpredictable demand patterns, vast product ranges, and the necessity for quick turnarounds. Traditional methods often fall short due to the complexity and variability of demand in the aftermarket. The latest technologies can analyze large datasets to predict future demand more accurately and optimize inventory levels, leading to better service and lower costs. […]
            • Future-Proofing Utilities. Advanced Analytics for Supply Chain OptimizationFuture-Proofing Utilities: Advanced Analytics for Supply Chain Optimization
              Utilities in the electrical, natural gas, urban water, and telecommunications fields are all asset-intensive and reliant on physical infrastructure that must be properly maintained, updated, and upgraded over time. Maximizing asset uptime and the reliability of physical infrastructure demands effective inventory management, spare parts forecasting, and supplier management. A utility that executes these processes effectively will outperform its peers, provide better returns for its investors and higher service levels for its customers, while reducing its environmental impact. […]
            • Centering Act Spare Parts Timing Pricing and ReliabilityCentering Act: Spare Parts Timing, Pricing, and Reliability
              In this article, we'll walk you through the process of crafting a spare parts inventory plan that prioritizes availability metrics such as service levels and fill rates while ensuring cost efficiency. We'll focus on an approach to inventory planning called Service Level-Driven Inventory Optimization. Next, we'll discuss how to determine what parts you should include in your inventory and those that might not be necessary. Lastly, we'll explore ways to enhance your service-level-driven inventory plan consistently. […]

              Here are six suggestions that you may find useful; they are distilled from working over thirty five years with some very smart practitioners. Cloud computing companies with unique server and hardware parts, e-commerce, online retailers, home and office supply companies, onsite furniture, power utilities, intensive assets maintenance or warehousing for water supply companies have increased their activity during the pandemic. Garages selling car parts and truck parts, pharmaceuticals, healthcare or medical supply manufacturers and safety product suppliers are dealing with increasing demand. Delivery service companies, cleaning services, liquor stores and canned or jarred goods warehouses, home improvement stores, gardening suppliers, yard care companies, hardware, kitchen and baking supplies stores, home furniture suppliers with high demand are facing stockouts, long lead times, inventory shortage costs, higher operating costs and ordering costs.

              Automatic Forecasting for Time Series Demand Projections

              The Smart Forecaster

               Pursuing best practices in demand planning,

              forecasting and inventory optimization

              Improve Forecast Accuracy, Eliminate Excess Inventory, & Maximize Service Levels

              In this video tutorial Dr. Thomas Willemain, co–Founder and SVP Research at Smart Software, presents Automatic Forecasting for Time Series Demand Projections, a specialized algorithmic tournament to determine an appropriate time series model and estimate the parameters to compute the best forecasts methods. Automatic forecasts of large numbers of time series are frequently used in business, some have trend either up or down, and some have seasonality so they are cyclic, and each of those specific patterns requires a suitable technical approach, and an appropriate statistical forecasting method.  Tom explains how the tournament computes the best forecasts methods and works through a practical example.

              AUTOMATIC FORECASTING COMPLETE-VIDEO-2
              Leave a Comment

              RECENT POSTS

              Reveal Your Real Inventory Planning and Forecasting Policy by Answering These 10 Questions

              Reveal Your Real Inventory Planning and Forecasting Policy by Answering These 10 Questions

              In this blog, we review 10 specific questions you can ask to uncover what’s really happening with the inventory planning and demand forecasting policy at your company. We detail the typical answers provided when a forecasting/inventory planning policy doesn’t really exist, explain how to interpret these answers, and offer some clear advice on what to do about it.

              The Trouble With Turns

              The Trouble With Turns

              In our travels around the industrial scene, we notice that many companies pay more attention to inventory Turns than they should. We would like to deflect some of this attention to more consequential performance metrics.

              The Scourge of Skewness

              The Scourge of Skewness

              Demand planners have to cope with multiple problems to get their job done. One is the Irritation of Intermittency. The “now you see it, now you don’t” character of intermittent demand, with its heavy mix of zero values, forces the use of advanced statistical methods, such as Smart Software’s patented Markov Bootstrap algorithm. But even within the dark realm of intermittent demand, there are degrees of difficulty: planners must further cope with the potentially costly Scourge of Skewness.

              Recent Posts

              • Managing Spare Parts Inventory: Best PracticesManaging Spare Parts Inventory: Best Practices
                In this blog, we’ll explore several effective strategies for managing spare parts inventory, emphasizing the importance of optimizing stock levels, maintaining service levels, and using smart tools to aid in decision-making. Managing spare parts inventory is a critical component for businesses that depend on equipment uptime and service reliability. Unlike regular inventory items, spare parts often have unpredictable demand patterns, making them more challenging to manage effectively. An efficient spare parts inventory management system helps prevent stockouts that can lead to operational downtime and costly delays while also avoiding overstocking that unnecessarily ties up capital and increases holding costs. […]
              • 5 Ways to Improve Supply Chain Decision Speed5 Ways to Improve Supply Chain Decision Speed
                The promise of a digital supply chain has transformed how businesses operate. At its core, it can make rapid, data-driven decisions while ensuring quality and efficiency throughout operations. However, it's not just about having access to more data. Organizations need the right tools and platforms to turn that data into actionable insights. This is where decision-making becomes critical, especially in a landscape where new digital supply chain solutions and AI-driven platforms can support you in streamlining many processes within the decision matrix. […]
              • Two employees checking inventory in temporary storage in a distribution warehouse.12 Causes of Overstocking and Practical Solutions
                Managing inventory effectively is critical for maintaining a healthy balance sheet and ensuring that resources are optimally allocated. Here is an in-depth exploration of the main causes of overstocking, their implications, and possible solutions. […]
              • FAQ Mastering Smart IP&O for Better Inventory ManagementFAQ: Mastering Smart IP&O for Better Inventory Management.
                Effective supply chain and inventory management are essential for achieving operational efficiency and customer satisfaction. This blog provides clear and concise answers to some basic and other common questions from our Smart IP&O customers, offering practical insights to overcome typical challenges and enhance your inventory management practices. Focusing on these key areas, we help you transform complex inventory issues into strategic, manageable actions that reduce costs and improve overall performance with Smart IP&O. […]
              • 7 Key Demand Planning Trends Shaping the Future7 Key Demand Planning Trends Shaping the Future
                Demand planning goes beyond simply forecasting product needs; it's about ensuring your business meets customer demands with precision, efficiency, and cost-effectiveness. Latest demand planning technology addresses key challenges like forecast accuracy, inventory management, and market responsiveness. In this blog, we will introduce critical demand planning trends, including data-driven insights, probabilistic forecasting, consensus planning, predictive analytics, scenario modeling, real-time visibility, and multilevel forecasting. These trends will help you stay ahead of the curve, optimize your supply chain, reduce costs, and enhance customer satisfaction, positioning your business for long-term success. […]

                Inventory Optimization for Manufacturers, Distributors, and MRO

                • Managing Spare Parts Inventory: Best PracticesManaging Spare Parts Inventory: Best Practices
                  In this blog, we’ll explore several effective strategies for managing spare parts inventory, emphasizing the importance of optimizing stock levels, maintaining service levels, and using smart tools to aid in decision-making. Managing spare parts inventory is a critical component for businesses that depend on equipment uptime and service reliability. Unlike regular inventory items, spare parts often have unpredictable demand patterns, making them more challenging to manage effectively. An efficient spare parts inventory management system helps prevent stockouts that can lead to operational downtime and costly delays while also avoiding overstocking that unnecessarily ties up capital and increases holding costs. […]
                • Innovating the OEM Aftermarket with AI-Driven Inventory Optimization XLInnovating the OEM Aftermarket with AI-Driven Inventory Optimization
                  The aftermarket sector provides OEMs with a decisive advantage by offering a steady revenue stream and fostering customer loyalty through the reliable and timely delivery of service parts. However, managing inventory and forecasting demand in the aftermarket is fraught with challenges, including unpredictable demand patterns, vast product ranges, and the necessity for quick turnarounds. Traditional methods often fall short due to the complexity and variability of demand in the aftermarket. The latest technologies can analyze large datasets to predict future demand more accurately and optimize inventory levels, leading to better service and lower costs. […]
                • Future-Proofing Utilities. Advanced Analytics for Supply Chain OptimizationFuture-Proofing Utilities: Advanced Analytics for Supply Chain Optimization
                  Utilities in the electrical, natural gas, urban water, and telecommunications fields are all asset-intensive and reliant on physical infrastructure that must be properly maintained, updated, and upgraded over time. Maximizing asset uptime and the reliability of physical infrastructure demands effective inventory management, spare parts forecasting, and supplier management. A utility that executes these processes effectively will outperform its peers, provide better returns for its investors and higher service levels for its customers, while reducing its environmental impact. […]
                • Centering Act Spare Parts Timing Pricing and ReliabilityCentering Act: Spare Parts Timing, Pricing, and Reliability
                  In this article, we'll walk you through the process of crafting a spare parts inventory plan that prioritizes availability metrics such as service levels and fill rates while ensuring cost efficiency. We'll focus on an approach to inventory planning called Service Level-Driven Inventory Optimization. Next, we'll discuss how to determine what parts you should include in your inventory and those that might not be necessary. Lastly, we'll explore ways to enhance your service-level-driven inventory plan consistently. […]

                  5 Demand Planning Tips for Calculating Forecast Uncertainty

                  The Smart Forecaster

                   Pursuing best practices in demand planning,

                  forecasting and inventory optimization

                  Those who produce forecasts owe it to those who consume forecasts, and to themselves, to be aware of the uncertainty in their forecasts. This note is about how to estimate forecast uncertainty and use the estimates in your demand planning process. We focus on forecasts made in support of demand planning as well as forecasts inherent in optimizing inventory policies involving reorder points, safety stocks, and min/max levels.

                  Reading this, you will learn about:

                  -Criteria for assessing forecasts
                  -Sources of forecast error
                  -Calculating forecast error
                  -Converting forecast error into prediction intervals
                  -The relationship between demand forecasting and inventory optimization.
                  -Actions you can take to use these concepts to improve your company’s processes.

                  Criteria for Assessing Forecasts

                  Forecast error alone is not reason enough to reject forecasting as a management tool. To twist a famous aphorism by George Box, “All forecasts are wrong, but some are useful.” Of course, business professionals will always search for ways to make forecasts more useful. This usually involves work to reduce forecast error. But while forecast accuracy is the most obvious criterion by which to judge forecasts, but it is not the only one. Here’s a list of criteria for evaluating forecasts:

                  Accuracy: Forecasts of future values should, in retrospect, be very close to the actual values that eventually reveal themselves. But there may be diminishing returns to squeezing another half percent of accuracy out of forecasts otherwise good enough to use in decision making.

                  Timeliness: Fighter pilots refer to the OODA Loop (Observe, Orient, Decide, and Act) and the “need to get inside the enemy’s OODA loop” so they can shoot first. Businesses too have decision cycles. Delivering a perfectly accurate forecast the day after it was needed is not helpful. Better is a good forecast that arrives in time to be useful.

                  Cost: Forecasting data, models, processes and people all cost money.  A less expensive forecast might be fueled by data that are readily available; more expensive would be a forecast that runs on data that have to be collected in a special process outside the scope of a firm’s information infrastructure.  A classic, off-the-shelf forecasting technique will be less costly to acquire, feed and exploit than a complex, custom, consultant-supplied method. Forecasts could be mass-produced by software overseen by a single analyst, or they might emerge from a collaborative process requiring time and effort from large groups of people, such as district sales managers, production teams, and others. Technically advanced forecasting techniques often require hiring staff with specialized technical expertise, such as a master’s degree in statistics, who tend to cost more than staff with less advanced training.

                  Credibility: Ultimately, some executive has to accept and act on each forecast. Executives have a tendency to distrust or ignore recommendations that they can neither understand nor explain to the next person above them in the hierarchy. For many, believing in a “black box” is too severe a test of faith, and they reject the black box’s forecasts in favor of something more transparent.

                  All that said, we will focus now on forecast accuracy and its evil twin, forecast error.

                  Sources of Forecast Error

                  Those seeking to reduce error can look in three places to find trouble:
                  1. The data that goes into a forecasting model
                  2. The model itself
                  3. The context of the forecasting exercise

                  There are several ways in which data problems can lead to forecast error.

                  Gross errors: Wrong data produce wrong forecasts. We have seen an instance in which computer records of product demand were wrong by a factor of two! Those involved spotted that problem immediately, but a less egregious situation can easily slip through to poison the forecasting process. In fact, just organizing, acquiring and checking data is often the largest source of delay in the implementation of forecasting software. Many data problems seem to derive from the data having been unimportant until a forecasting project made them important.

                  Anomalies: Even with perfectly curated forecasting databases, there are often “needle in a haystack” type data problems. In these cases, it is not data errors but demand anomalies that contribute to forecast error. In a set of, say, 50,000 products, some number of items are likely to have odd details that can distort forecasts.

                  Holdout analysis is a simple but powerful method of analysis. To see how well a method forecasts, use it with older known data to forecast newer data, then see how it would have turned out! For instance, suppose you have 36 months of demand data and need to forecast 3 months ahead. You can simulate the forecasting process by holding out (i.e., hiding) the most recent 3 months of data, forecasting using only data from months 1 to 33, then comparing the forecasts for months 34-36 against the actual values in months 34-36. Sliding simulation merely repeats the holdout analysis, sliding along the demand history. The example above used the first 33 months of data to get 3 estimates of forecast error. Suppose we start the process by using the first 12 months to forecast the next 3. Then we slide forward and use the first 13 months to forecast the next 3. We continue until finally we use the first 35 months to forecast the last month, giving us one more estimate of the error we make when forecasting one month ahead. Summarizing all the 1-step ahead, 2-step ahead and 3-step ahead forecast errors provides a way to calculate prediction intervals.

                  Calculating Prediction Intervals

                  The final step in calculating prediction intervals is to convert the estimates of average absolute error into the upper and lower limits of the prediction interval. The prediction interval at any future time is computed as

                  Prediction interval = Forecast ± Multiplier x Average absolute error.

                  The final step is the choice of the multiplier. The typical approach is to imagine some probability distribution of error around the forecast, then estimate the ends of the prediction interval using appropriate percentiles of that distribution. Usually, the assumed distribution of error is the Normal distribution, also called the Gaussian distribution or the “bell-shaped curve”.

                  Use of Prediction Intervals
                  The most immediate, informal use of prediction intervals is to convey a sense of how “squishy” a forecast is. Prediction intervals that are wide compared to the size of the forecasts indicate high uncertainty.

                  There are two more formal uses in demand forecasting: Hedging your bets about future demand and guiding forecast adjustment.

                  Hedging your bets: The forecast values themselves approximate the most likely values of future demand. A more ominous way to say the same thing is that there is about a 50% chance that the actual value will be above (or below) the forecast. If the forecast is being used to plan future production (or raw materials purchase or hiring), you might want to build in a cushion to keep from being caught short if demand spikes (assuming that under-building is worse than over-building). If the forecast is converted from units to dollars for revenue projections, you might want to use a value below the forecast to be conservative in projecting cash flow. In either case, you first have to choose the coverage of the prediction interval. A 90% prediction interval is a range of values that covers 90% of the possibilities. This implies that there is a 5% chance of a value falling above the upper limit of the 90% prediction interval. In other words, the upper limit of a 90% prediction interval marks the 95th percentile of the distribution of predicted demand at that time period. Similarly, there is a 5% chance of falling below the lower limit, which marks the 5th percentile of the demand distribution.

                  Guiding forecast adjustment: It is quite common for statistical forecasts to be revised by some sort of collaborative process. These adjustments are based on information not recorded in an item’s demand history, such as intelligence about competitor actions. Sometimes they are based on a more vaporous source, such as sales force optimism. When the adjustments are made on-screen for all to see, the prediction intervals provide a useful reference: If someone wants to move the forecasts outside the prediction intervals, they are crossing a fact-based line and should have a good story to justify their argument that things will be really different in the future.

                  Prediction Intervals and Inventory Optimization

                  Finally, the concept behind prediction intervals play an essential role in a problem related to demand forecasting: Inventory Optimization.
                  The core analytic task in setting reorder points (also called Mins) is to forecast total demand over a replenishment lead time. This total is called the lead time demand. When on-hand inventory falls down to or below the reorder point, a replenishment order is triggered. If the reorder point is high enough, there will be an acceptably small risk of a stockout, i.e., of lead time demand driving inventory below zero and creating either lost sales or backorders.

                  SDP_Screenshot new statistical methods planning

                  New statistical methods, and we can start planning more effectively.

                  The forecasting task is to determine all the possible values of cumulative demand over the lead time and their associated probabilities of occurring. In other words, the basic task is to determine a prediction interval for some future random variable. Suppose you have computed a 90% prediction interval for lead time demand. Then the upper end of the interval represents the 95th percentile of the distribution. Setting the reorder point at this level will accommodate 95% of the possible lead time demand values, meaning there will be only a 5% chance of stocking out before replenishment arrives to re-stock the shelves. Thus there is an intimate relationship between prediction intervals in demand forecasting and calculation of reorder points in inventory optimization.


                  5 Recommendations for Practice

                  1. Set expectations about error: Sometimes  managers have unreasonable expectations about reducing forecast error to zero. You can point out that error is only one of the dimensions on which a forecasting process must be judged; you may be doing fine on both timeliness and cost. Also point out that zero error is no more realistic a goal than 100% conversion of prospects into customers, perfect supplier performance, or zero stock price volatility.

                  2. Track down sources of error: Double check the accuracy of demand histories. Use statistical methods to identify outliers in demand histories and react appropriately, replacing verified anomalies with more typical values and omitting data from before major changes in the character of the demand. If you use a collaborative forecasting process, compare its accuracy against a purely statistical approach to identify items for which collaboration does not reduce error.

                  3. Evaluate the error of alternative statistical methods: There may be off-the-shelf techniques that do better than your current methods, or do better for some subsets of your items. The key is to be empirical, using the idea of holdout analysis. Gather your data and do a “bake off” between different methods to see which work better for you. If you are not already using statistical forecasting methods, compare them against whoever’s “golden gut” is your current standard. Use the naïve forecast as a benchmark in the comparisons.

                  4. Investigate the use of new data sources: Especially if you have items that are heavily promoted, test out statistical methods that incorporate promotional data into the forecasting process. Also check whether information from outside your company can be exploited; for instance, see whether macroeconomic indicators for your sector can be combined with company data to improve forecast accuracy (this is usually done using a method called multiple regression analysis).

                  5. Use prediction intervals: Plots of prediction intervals can improve your feel for the uncertainty in your forecasts, helping you select items for additional scrutiny. While it’s true that what you don’t know can hurt you, it’s also true that knowing what you don’t know can help you.

                  Leave a Comment

                  Related Posts

                  Reveal Your Real Inventory Planning and Forecasting Policy by Answering These 10 Questions

                  Reveal Your Real Inventory Planning and Forecasting Policy by Answering These 10 Questions

                  In this blog, we review 10 specific questions you can ask to uncover what’s really happening with the inventory planning and demand forecasting policy at your company. We detail the typical answers provided when a forecasting/inventory planning policy doesn’t really exist, explain how to interpret these answers, and offer some clear advice on what to do about it.

                  The Trouble With Turns

                  The Trouble With Turns

                  In our travels around the industrial scene, we notice that many companies pay more attention to inventory Turns than they should. We would like to deflect some of this attention to more consequential performance metrics.

                  The Scourge of Skewness

                  The Scourge of Skewness

                  Demand planners have to cope with multiple problems to get their job done. One is the Irritation of Intermittency. The “now you see it, now you don’t” character of intermittent demand, with its heavy mix of zero values, forces the use of advanced statistical methods, such as Smart Software’s patented Markov Bootstrap algorithm. But even within the dark realm of intermittent demand, there are degrees of difficulty: planners must further cope with the potentially costly Scourge of Skewness.

                  Recent Posts

                  • Managing Spare Parts Inventory: Best PracticesManaging Spare Parts Inventory: Best Practices
                    In this blog, we’ll explore several effective strategies for managing spare parts inventory, emphasizing the importance of optimizing stock levels, maintaining service levels, and using smart tools to aid in decision-making. Managing spare parts inventory is a critical component for businesses that depend on equipment uptime and service reliability. Unlike regular inventory items, spare parts often have unpredictable demand patterns, making them more challenging to manage effectively. An efficient spare parts inventory management system helps prevent stockouts that can lead to operational downtime and costly delays while also avoiding overstocking that unnecessarily ties up capital and increases holding costs. […]
                  • 5 Ways to Improve Supply Chain Decision Speed5 Ways to Improve Supply Chain Decision Speed
                    The promise of a digital supply chain has transformed how businesses operate. At its core, it can make rapid, data-driven decisions while ensuring quality and efficiency throughout operations. However, it's not just about having access to more data. Organizations need the right tools and platforms to turn that data into actionable insights. This is where decision-making becomes critical, especially in a landscape where new digital supply chain solutions and AI-driven platforms can support you in streamlining many processes within the decision matrix. […]
                  • Two employees checking inventory in temporary storage in a distribution warehouse.12 Causes of Overstocking and Practical Solutions
                    Managing inventory effectively is critical for maintaining a healthy balance sheet and ensuring that resources are optimally allocated. Here is an in-depth exploration of the main causes of overstocking, their implications, and possible solutions. […]
                  • FAQ Mastering Smart IP&O for Better Inventory ManagementFAQ: Mastering Smart IP&O for Better Inventory Management.
                    Effective supply chain and inventory management are essential for achieving operational efficiency and customer satisfaction. This blog provides clear and concise answers to some basic and other common questions from our Smart IP&O customers, offering practical insights to overcome typical challenges and enhance your inventory management practices. Focusing on these key areas, we help you transform complex inventory issues into strategic, manageable actions that reduce costs and improve overall performance with Smart IP&O. […]
                  • 7 Key Demand Planning Trends Shaping the Future7 Key Demand Planning Trends Shaping the Future
                    Demand planning goes beyond simply forecasting product needs; it's about ensuring your business meets customer demands with precision, efficiency, and cost-effectiveness. Latest demand planning technology addresses key challenges like forecast accuracy, inventory management, and market responsiveness. In this blog, we will introduce critical demand planning trends, including data-driven insights, probabilistic forecasting, consensus planning, predictive analytics, scenario modeling, real-time visibility, and multilevel forecasting. These trends will help you stay ahead of the curve, optimize your supply chain, reduce costs, and enhance customer satisfaction, positioning your business for long-term success. […]

                    Inventory Optimization for Manufacturers, Distributors, and MRO

                    • Managing Spare Parts Inventory: Best PracticesManaging Spare Parts Inventory: Best Practices
                      In this blog, we’ll explore several effective strategies for managing spare parts inventory, emphasizing the importance of optimizing stock levels, maintaining service levels, and using smart tools to aid in decision-making. Managing spare parts inventory is a critical component for businesses that depend on equipment uptime and service reliability. Unlike regular inventory items, spare parts often have unpredictable demand patterns, making them more challenging to manage effectively. An efficient spare parts inventory management system helps prevent stockouts that can lead to operational downtime and costly delays while also avoiding overstocking that unnecessarily ties up capital and increases holding costs. […]
                    • Innovating the OEM Aftermarket with AI-Driven Inventory Optimization XLInnovating the OEM Aftermarket with AI-Driven Inventory Optimization
                      The aftermarket sector provides OEMs with a decisive advantage by offering a steady revenue stream and fostering customer loyalty through the reliable and timely delivery of service parts. However, managing inventory and forecasting demand in the aftermarket is fraught with challenges, including unpredictable demand patterns, vast product ranges, and the necessity for quick turnarounds. Traditional methods often fall short due to the complexity and variability of demand in the aftermarket. The latest technologies can analyze large datasets to predict future demand more accurately and optimize inventory levels, leading to better service and lower costs. […]
                    • Future-Proofing Utilities. Advanced Analytics for Supply Chain OptimizationFuture-Proofing Utilities: Advanced Analytics for Supply Chain Optimization
                      Utilities in the electrical, natural gas, urban water, and telecommunications fields are all asset-intensive and reliant on physical infrastructure that must be properly maintained, updated, and upgraded over time. Maximizing asset uptime and the reliability of physical infrastructure demands effective inventory management, spare parts forecasting, and supplier management. A utility that executes these processes effectively will outperform its peers, provide better returns for its investors and higher service levels for its customers, while reducing its environmental impact. […]
                    • Centering Act Spare Parts Timing Pricing and ReliabilityCentering Act: Spare Parts Timing, Pricing, and Reliability
                      In this article, we'll walk you through the process of crafting a spare parts inventory plan that prioritizes availability metrics such as service levels and fill rates while ensuring cost efficiency. We'll focus on an approach to inventory planning called Service Level-Driven Inventory Optimization. Next, we'll discuss how to determine what parts you should include in your inventory and those that might not be necessary. Lastly, we'll explore ways to enhance your service-level-driven inventory plan consistently. […]

                      Cloud computing companies with unique server and hardware parts, e-commerce, online retailers, home and office supply companies, onsite furniture, power utilities, intensive assets maintenance or warehousing for water supply companies have increased their activity during the pandemic. Garages selling car parts and truck parts, pharmaceuticals, healthcare or medical supply manufacturers and safety product suppliers are dealing with increasing demand. Delivery service companies, cleaning services, liquor stores and canned or jarred goods warehouses, home improvement stores, gardening suppliers, yard care companies, hardware, kitchen and baking supplies stores, home furniture suppliers with high demand are facing stockouts, long lead times, inventory shortage costs, higher operating costs and ordering costs.