Extend Epicor BisTrack with Smart IP&O’s Dynamic Reorder Point Planning & Forecasting

In this article, we will review the “suggested orders” functionality in Epicor BisTrack, explain its limitations, and summarize how Smart Inventory Planning & Optimization (Smart IP&O) can help reduce inventory & minimize stock-outs by accurately assessing the tradeoffs between stockout risks and inventory costs.

Automating Replenishment in Epicor BisTrack
Epicor BisTrack’s “Suggested Ordering” can manage replenishment by suggesting what to order and when via reorder point-based policies such as min-max and/or manually specified weeks of supply. BisTrack contains some basic functionality to compute these parameters based on average usage or sales, supplier lead time, and/or user-defined seasonal adjustments. Alternatively, reorder points can be specified completely manually. BisTrack will then present the user with a list of suggested orders by reconciling incoming supply, current on hand, outgoing demand, and stocking policies.

How Epicor BisTrack “Suggested Ordering” Works
To get a list of suggested orders, users specify the methods behind the suggestions, including locations for which to place orders and how to determine the inventory policies that govern when a suggestion is made and in what quantity.

Extend Epicor BisTrack Planning and Forecasting

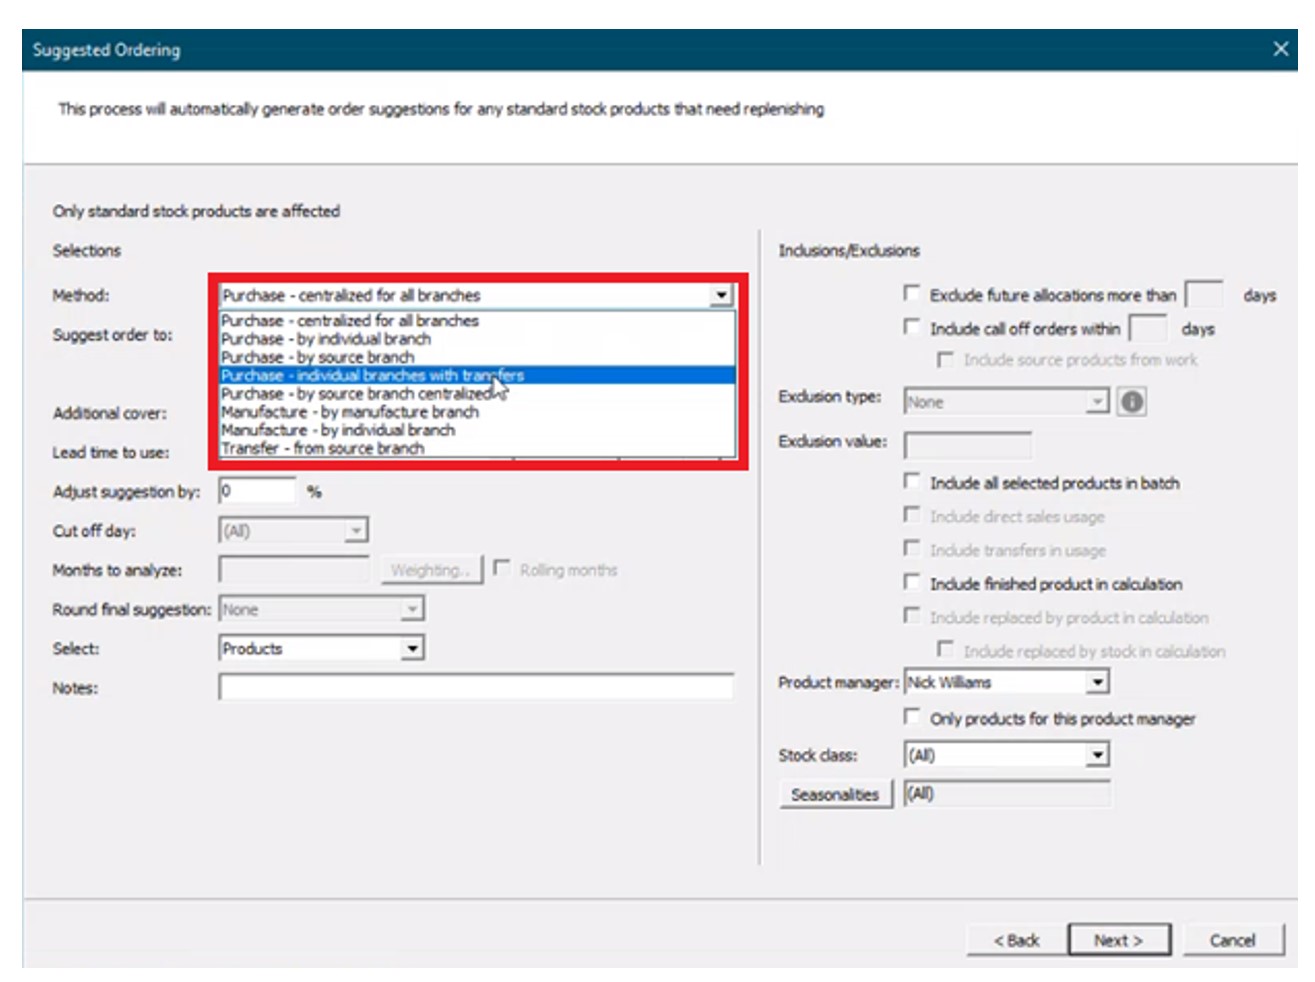
First, the “method” field is specified from the following options to determine what kind of suggestion is generated and for which location(s):

Purchase – Generate purchase order recommendations.

  1. Centralized for all branches – Generates suggestions for a single location that buys for all other locations.
  2. By individual branch – Generates suggestions for multiple locations (vendors would ship directly to each branch).
  3. By source branch – Generates suggestions for a source branch that will transfer material to branches that it services (“hub and spoke”).
  4. Individual branches with transfers – Generates suggestions for an individual branch that will transfer material to branches that it services (“hub and spoke”, where the “hub” does not need to be a source branch).

Manufacture – Generate work order suggestions for manufactured goods.

  1. By manufacture branch.
  2. By individual branch.

Transfer from source branch – Generate transfer suggestions from a given branch to other branches.

Extend Epicor BisTrack Planning and Forecasting 2222

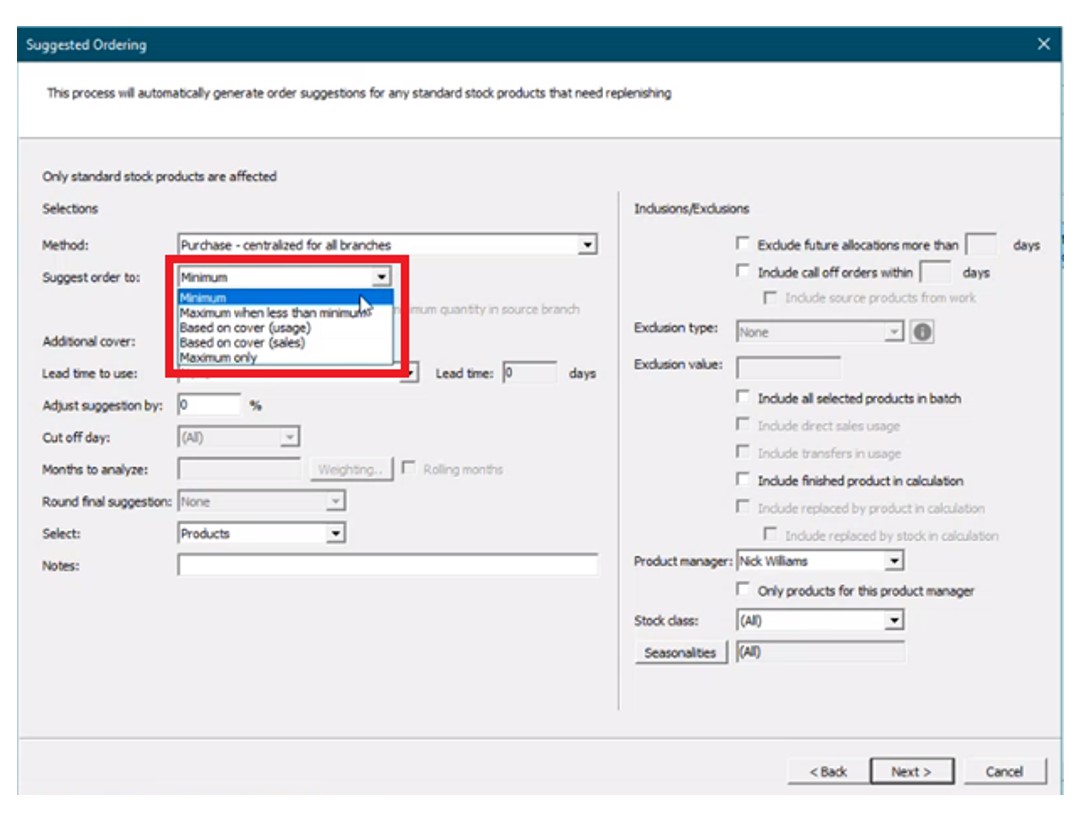
Next, the “suggest order to” is specified from the following options:

  1. Minimum – Suggests orders “up to” the minimum on hand quantity (“min”). For any item where supply is less than the min, BisTrack will suggest an order suggestion to replenish up to this quantity.
  2. Maximum when less than min – Suggests orders “up to” a maximum on-hand quantity when the minimum on-hand quantity is breached (e.g. a min-max inventory policy).
  1. Based on cover (usage) – Suggests orders based on coverage for a user-defined number of weeks of supply with respect to a specified lead time. Given internal usage as demand, BisTrack will recommend orders where supply is less than the desired coverage to cover the difference.
  1. Based on over (sales) – Suggests orders based on coverage for a user-defined number of weeks of supply with respect to a specified lead time. Given sales orders as demand, BisTrack will recommend orders where supply is less than the desired coverage to cover the difference.
  1. Maximum only – Suggests orders “up to” a maximum on-hand quantity where supply is less than this max.

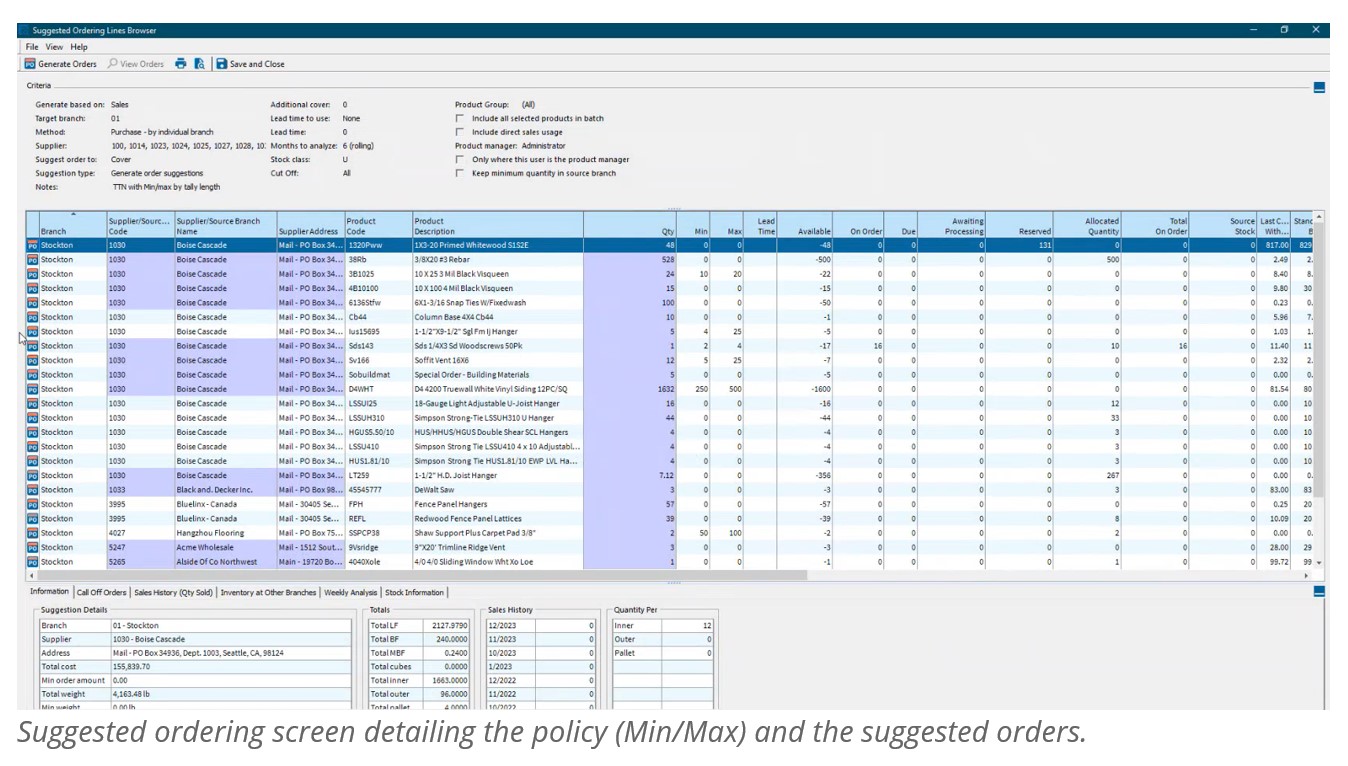
Finally, if allowing BisTrack to determine the reorder thresholds, users can specify additional inventory coverage as buffer stock, lead times, how many months of historical demand to consider, and can also manually define period-by-period weighting schemes to approximate seasonality. The user will be handed a list of suggested orders based on the defined criteria. A buyer can then generate POs for suppliers with the click of a button.

Extend Epicor BisTrack Planning and Forecasting

Limitations

Rule-of-thumb Methods

While BisTrack enables organizations to generate reorder points automatically, these methods rely on simple averages that do not capture seasonality, trends, or the volatility in an item’s demand. Averages will always lag behind these patterns and are unable to pick up on trends. Consider a highly seasonal product like a snow shovel—if we take an average of Summer/Fall demand as we approach the Winter season instead of looking ahead, then the recommendations will be based on the slower periods instead of anticipating upcoming demand. Even if we consider an entire years’ worth of history or more, the recommendations will overcompensate during the slower months and underestimate the busy season without manual intervention.

Rule of thumb methods also fail when used to buffer against supply and demand variability.  For example, the average demand over the lead time might be 20 units.  However, a planner would often want to stock more than 20 units to avoid stocking out if lead times are longer than expected or demand is higher than the average.  BisTrack allows users to specify the reorder points based on multiples of the averages.  However, because the multiples don’t account for the level of predictability and variability in the demand, you’ll always overstock predictable items and understock unpredictable ones.   Read this article to learn more about why multiples of the average fail when it comes to developing the right reorder point.

Manual Entry
Speaking of seasonality referenced earlier, BisTrack does allow the user to approximate it through the use of manually entered “weights” for each period. This forces the user to have to decide what that seasonal pattern looks like—for every item. Even beyond that, the user must dictate how many extra weeks of supply to carry to buffer against stockouts, and must specify what lead time to plan around. Is 2 weeks extra supply enough? Is 3 enough? Or is that too much? There is no way to know without guessing, and what makes sense for one item might not be the right approach for all items.

Intermittent Demand
Many BisTrack customers may consider certain items “unforecastable” because of the intermittent or “lumpy” nature of their demand. In other words, items that are characterized by sporadic demand, large spikes in demand, and periods of little or no demand at all. Traditional methods—and rule-of-thumb approaches especially—won’t work for these kinds of items. For example, 2 extra weeks of supply for a highly predictable, stable item might be way too much; for an item with highly volatile demand, this same rule might not be enough. Without a reliable way to objectively assess this volatility for each item, buyers are left guessing when to buy and how much.

Reverting to Spreadsheets
The reality is most BisTrack users tend to do the bulk of their planning off-line, in Excel. Spreadsheets aren’t purpose-built for forecasting and inventory optimization. Users will often bake in user-defined rule of thumb methods that often do more harm than good.  Once calculated, users must input the information back into BisTrack manually. The time consuming nature of the process leads companies to infrequently compute their inventory policies – Many months and on occasion years go by in between mass updates leading to a “set it and forget it” reactive approach, where the only time a buyer/planner reviews inventory policy is at the time of order.  When policies are reviewed after the order point is already breached, it is too late.  When the order point is deemed too high, manual interrogation is required to review history, calculate forecasts, assess buffer positions, and to recalibrate.  The sheer volume of orders means that buyers will just release orders rather than take the painstaking time to review everything, leading to significant excess stock.  If the reorder point is too low, it’s already too late.  An expedite may now be required, driving up costs, assuming the customer doesn’t simply go elsewhere.

Epicor is Smarter
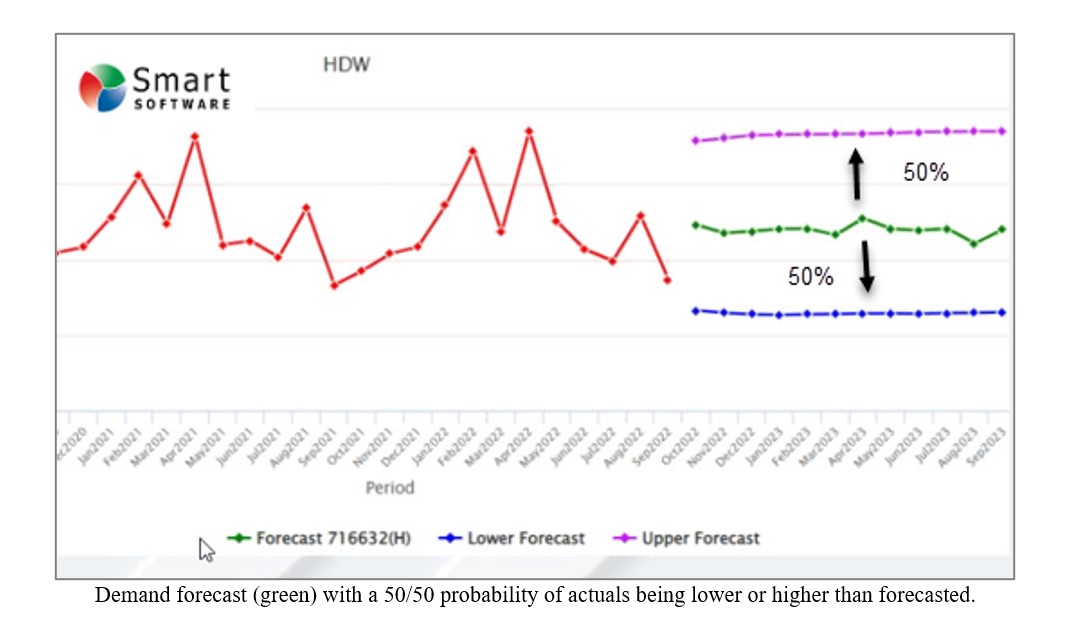
Epicor has partnered with Smart Software and offers Smart IP&O as a cross platform add-on to its ERP solutions including BisTrack, a speciality ERP for the Lumber, hardware, and building material industry.  The Smart IP&O solution comes complete with a bidirectional integration to BisTrack.  This enables Epicor customers to leverage built-for-purpose best of breed inventory optimization applications.  With Epicor Smart IP&O you can generate forecasts that capture trend and seasonality without manual configurations.  You will be able to automatically recalibrate inventory policies using field proven, cutting-edge statistical and probabilistic models that were engineered to accurately plan for intermittent demand.   Safety stocks will accurately account for demand and supply variability, business conditions, and priorities.  You can leverage service level driven planning so you have just enough stock or turn on optimization methods that prescribe the most profitable stocking policies and service levels that consider the real cost of carrying inventory. You can support commodity buys with accurate demand forecasting over longer horizons, and run “what-if” scenarios to assess alternative strategies before execution of the plan.

Smart IP&O customers routinely realize 7 figure annual returns from reduced expedites, increased sales, and less excess stock, all the while gaining a competitive edge by differentiating themselves on improved customer service. To see a recorded webinar hosted by the Epicor Users Group that profiles Smart’s Demand Planning and Inventory Optimization platform, please register here.


How does your ERP system treat safety stock?

Is safety stock regarded as emergency spares or as a day-to-day buffer against spikes in demand? Knowing the difference and configuring your ERP properly will make a big difference to your bottom line.

The Safety Stock field in your ERP system can mean very different things depending on the configuration. Not understanding these differences and how they impact your bottom line is a common issue we’ve seen arise in implementations of our software.

Implementing inventory optimization software starts with new customers completing the technical implementation to get data flowing.  They then receive user training and spend weeks carefully configuring their initial safety stocks, reorder levels, and consensus demand forecasts with Smart IP&O.  The team becomes comfortable with Smart’s key performance predictions (KPPs) for service levels, ordering costs, and inventory on hand, all of which are forecasted using the new stocking policies.

But when they save the policies and forecasts to their ERP test system, sometimes the orders being suggested are far larger and more frequent than they expected, driving up projected inventory costs.

When this happens, the primary culprit is how the ERP is configured to treat safety stock.  Being aware of these configuration settings will help planning teams better set expectations and achieve the expected outcomes with less effort (and cause for alarm!).

Here are the three common examples of ERP safety stock configurations:

Configuration 1. Safety Stock is treated as emergency stock that can’t be consumed. If a breach of safety stock is predicted, the ERP system will force an expedite no matter the cost so the inventory on hand never falls below safety stock, even if a scheduled receipt is already on order and scheduled to arrive soon.

Configuration 2. Safety Stock is treated as Buffer stock that is designed to be consumed. The ERP system will place an order when a breach of safety stock is predicted but on hand inventory will be allowed to fall below the safety stock. The buffer stock protects against stockout during the resupply period (i.e., the lead time).

Configuration 3. Safety Stock is ignored by the system and treated as a visual planning aid or rule of thumb. It is ignored by supply planning calculations but used by the planner to help make manual assessments of when to order.

Note: We never recommend using the safety stock field as described in Configuration 3. In most cases, these configurations were not intended but result from years of improvisation that have led to using the ERP in a non-standard way.  Generally, these fields were designed to programmatically influence the replenishment calculations.  So, the focus of our conversation will be on Configurations 1 and 2. 

Forecasting and inventory optimization systems are designed to compute forecasts that will anticipate inventory draw down and then calculate safety stocks sufficient to protect against variability in demand and supply. This means that the safety stock is intended to be used as a protective buffer (Configuration 2) and not as emergency sparse (Configuration 3).  It is also important to understand that, by design, the safety stock will be consumed approximately 50% of the time.

Why 50%? Because actual orders will exceed an unbiased forecast half of the time. See the graphic below illustrating this.  A “good” forecast should yield the value that will come closest to the actual most often so actual demand will either be higher or lower without bias in either direction.


How does your ERP system treat safety stock 1


If you configured your ERP system to properly allow consumption of safety stock, then the on hand inventory might look like the graph below.  Note that some safety stock is consumed but avoided a stockout.  The service level you target when computing safety stock will dictate how often you stockout before the replenishment order arrives.  Average inventory is roughly 60 units over the time horizon in this scenario.


How does your ERP system treat safety stock 2


If your ERP system is configured to not allow consumption of safety stock and treats the quantity entered in the safety stock field more like emergency spares, then you will have a massive overstock!  Your inventory on hand would look like the graph below with orders being expedited as soon as a breach of safety stock is expected. Average inventory is roughly 90 units, a 50% increase compared to when you allowed safety stock to be consumed.


How does your ERP system treat safety stock 3


What data is needed to support Demand Planning Software Implementations

We recently met with the IT team at one of our customers to discuss data requirements and installation of our API based integration that would pull data from their on-premises installation of their ERP system.   The IT manager and analyst both expressed significant concern about providing this data and seriously questioned why it needed to be provided at all.  They even voiced concerns that their data might be resold to their competition. Their reaction was a big surprise to us.  We wrote this blog with them in mind and to make it easier for others to communicate why certain data is necessary to support an effective demand planning process. 

Please note that if you are a forecast analyst, demand planner, of supply chain professional then most of what you’ll read below will be obvious.  But what this meeting taught me is that what is obvious to one group of specialists isn’t going to be obvious to another group of specialists in an entirely different field. 

The Four main types of data that are needed are:  

  1. Historical transactions, such as sales orders and shipments.
  2. Job usage transactions, such as what components are needed to produce finished goods
  3. Inventory Transfer transactions, such as what inventory was shipped from one location to another.
  4. Pricing, costs, and attributes, such as the unit cost paid to the supplier, the unit price paid by the customer, and various meta data like product family, class, etc.  

Below is a brief explanation of why this data is needed to support a company’s implementation of demand planning software.

Transactional records of historical sales and shipments by customer
Think of what was drawn out of inventory as the “raw material” required by demand planning software.  This can be what was sold to whom and when or what you shipped to whom and when.  Or what raw materials or subassemblies were consumed in work orders and when.  Or what is supplied to a satellite warehouse from a distribution center and when.

The history of these transactions is analyzed by the software and used to produce statistical forecasts that extrapolate observed patterns.  The data is evaluated to uncover patterns such as trend, seasonality, cyclical patterns, and to identify potential outliers that require business attention.  If this data is not generally accessible or updated in irregular intervals, then it is nearly impossible to create a good prediction of the future demand.  Yes, you could use business knowledge or gut feel but that doesn’t scale and nearly always introduces bias into the forecast (i.e., consistently forecasting too high or too low). 

Data is needed at the transactional level to support finer grained forecasting at the weekly or even daily levels.  For example, as a business enters its busy season it may want to start forecasting weekly to better align production to demand.  You can’t easily do that without having the transactional data in a well-structured data warehouse. 

It might also be the case that certain types of transactions shouldn’t be included in demand data.  This can happen when demand results from a steep discount or some other circumstance that the supply chain team knows will skew the results.  If the data is provided in the aggregate, it is much harder to segregate these exceptions.  At Smart Software, we call the process of figuring out which transactions (and associated transactional attributes) should be counted in the demand signal as “demand signal composition.” Having access to all the transactions enables a company to modify their demand signal as needed over time within the software.  Only providing some of the data results in a far more rigid demand composition that can only be remedied with additional implementation work.

Pricing and Costs
The price you sold your products for and the cost you paid to procure them (or raw materials) is critical to being able to forecast in revenue or costs.  An important part of the demand planning process is getting business knowledge from customers and sales teams.  Sales teams tend to think of demand by customer or product category and speak in the language of dollars.  So, it is important to express a forecast in dollars.  The demand planning system cannot do that if the forecast is shown in units only. 

Often, the demand forecast is used to drive or at least influence a larger planning & budgeting process and the key input to a budget is a forecast of revenue.  When demand forecasts are used to support the S&OP process, the Demand Planning software should either average pricing across all transactions or apply “time-phased” conversions that consider the price sold at that time.   Without the raw data on pricing and costs, the demand planning process can still function, but it will be severely impaired. 

Product attributes, Customer Details, and Locations
Product attributes are needed so that forecasters can aggregate forecasts across different product families, groups, commodity codes, etc. It is helpful to know how many units and total projected dollarized demand for different categories.  Often, business knowledge about what the demand might be in the future is not known at the product level but is known at the product family level, customer level, or regional level.  With the addition of product attributes to your demand planning data feed, you can easily “roll up” forecasts from the item level to a family level.  You can convert forecasts at these levels to dollars and better collaborate on how the forecast should be modified.  

Once the knowledge is applied in the form of a forecast override, the software will automatically reconcile the change to all the individual items that comprise the group.  This way, a forecast analyst doesn’t have to individually adjust every part.  They can make a change at the aggregate level and let the demand planning software do the reconciliation for them. 

Grouping for ease of analysis also applies to customer attributes, such as assigned salesperson or a customer’s preferred ship from location.  And location attributes can be useful, such as assigned region.  Sometimes attributes relate to a product and location combination, like preferred supplier or assigned planner, which can differ for the same product depending on warehouse.


A final note on confidentiality

Recall that our customer expressed concern that we might sell their data to a competitor. We would never do that. For decades, we have been using customer data for training purposes and for improving our products. We are scrupulous about safeguarding customer data and anonymizing anything that might be used, for instance, to illustrate a point in a blog post.


Elephants and Kangaroos ERP vs. Best of Breed Demand Planning

“Despite what you’ve seen in your Saturday morning cartoons, elephants can’t jump, and there’s one simple reason: They don’t have to. Most jumpy animals—your kangaroos, monkeys, and frogs—do it primarily to get away from predators.”  — Patrick Monahan, Science.org, Jan 27, 2016.

Now you know why the largest ERP companies can’t develop high quality best-of-breed like solutions. They never had to, so they never evolved to innovate outside of their core focus. 

However, as ERP systems have become commoditized, gaps in their functionality became impossible to ignore. The larger players sought to protect their share of customer wallet by promising to develop innovative add-on applications to fill all the white spaces.  But without that “innovation muscle,” many projects failed, and mountains of technical debt accumulated.

Best-of-breed companies evolved to innovate and have deep functional expertise in specific verticals.  The result is that best of breed ERP add-ons are easier to use, have more features, and deliver more value than the native ERP modules they replace. 

If your ERP provider has already partnered with an innovative best of breed add-on provider*, you’re all set! But if you can only get the basics from your ERP, go with a best-of-breed add-on that has a bespoke integration to the ERP. 

A great place to start your search is to look for ERP demand planning add-ons that add brains to the ERP’s brawn, i.e., those that support inventory optimization and demand forecasting.  Leverage add-on tools like Smart’s statistical forecasting, demand planning, and inventory optimization apps to develop forecasts and stocking policies that are fed back to the ERP system to drive daily ordering. 

*App-stores are a license for the best of breed to sell into the ERP companies base –  being listed  partnerships.


Implementing Demand Planning and Inventory Optimization Software with the Right Data

Data verification and validation are essential to the success of the implementation of software that performs statistical analysis of data, like Smart IP&O.  This article describes the issue and serves as a practical guide to doing the job right, especially for the user of the new application.

The less experience your organization has in validating historical transactions or item master attributes, the more likely it is there were problems or mistakes with data entry into the ERP that have so far gone unnoticed.  The garbage in, garbage out rule means you need to prioritize this step of the software onboarding process or risk delay and possible failure to generate ROI.

Ultimately the best person to confirm data in your ERP is entered correctly is the person who knows the business and can assert, for example, “this part doesn’t belong to that product group.”  That’s usually the same person who will open and use Smart. Though a database administrator or IT support can also play a key role by being able to say, “This part was assigned to that product group last December by Jane Smith.” Ensuring data is correct may not be a regular part of your day job but can be broken down into manageable small tasks that a good project manager will allocate the time and resources to complete.

The demand planning software vendor receiving the data also has a role.  They will confirm that the raw data was ingested without issue. The vendor can also identify abnormalities in the raw data files that point to the need for validation.  But relying on the software vendor to reassure you the data looks fine is not enough.  You don’t want to discover, after go-live, that you can’t trust the output because some of the data “doesn’t make sense.”

Each step in the data flow needs verification and validation.  Verification means the data at one step is still the same after flowing to the next step.  Validation means the data is correct and usable for analysis

The most common data flow looks like this:

Implementing Demand Planning and Inventory Optimization Software with the Right Data set

Less commonly, the first step between ERP master data and the interfacing files can sometimes be bypassed, where files are not used as an interface.  Instead, an API built by IT or the inventory optimization software vendor is responsible for data to be written directly from the ERP to the mirrored database in the cloud.  The vendor would work with IT to confirm the API is working as expected.  But the first validation step, even in that case, can still be performed.  After ingesting the data, the vendor can make the mirrored data available in files for the DBA/IT verification and business validation.

The confirmation that the mirrored data in the cloud completes the flow into the application is the responsibility of the vendor of software as a service.  SaaS vendors continually test that the software works correctly between the front-end application their subscribers see and the back-end data in the cloud database. If the subscribers still think the data doesn’t make sense in the application even after validating the interfacing files before going live, that is an issue to raise with the vendor’s customer support.

However the interfacing files are obtained, the largest part of verification and validation falls to the project manager and their team.  They must resource a test of the interfacing files to confirm:

  1. They match the data in the ERP. And that all and only the ERP data that was necessary to extract for use in the application was extracted.
  2. Nothing “jumps out” to the business as incorrect for each of the types of information in the data
  3. They are formatted as expected.


DBA/IT Verification Tasks

  1. Test the extract:

IT’s verification step can be done with various tools, comparing files, or importing files back to the database as temporary tables and joining them with the original data to confirm a match.  IT can depend on a query to pull the requested data into a file but that file can fail to match. The existence of delimiters or line returns within the data values can cause a file to be different than its original database table.  It is because the file relies heavily on delimiters and line returns to identify fields and records, while the table doesn’t rely on those characters to define its structure.

  1. No bad characters:

Free form data entry fields in the ERP, such as product descriptions, can sometimes themselves contain line returns, tabs, commas, and/or double quotes that can affect the structure of the output file.  Line returns should not be allowed in values that will be extracted to a file.  Characters equal to the delimiter should be stripped during extract or else a different delimiter used.

Tip: if commas are the file delimiter, numbers greater than 999 can’t be extracted with a comma. Use “1000” rather than “1,000”.

  1. Confirm the filters:

The other way that query extracts can return unexpected results is if conditions on the query are entered incorrectly.  The simplest way to avoid mistaken “where clauses” is to not use them.  Extract all data and allow the vendor to filter out some records according to rules supplied by the business.  If this will produce extract files so large that too much computing time is spent on the data exchange, the DBA/IT team should meet with the business to confirm exactly what filters on the data can be applied to avoid exchanging records that are meaningless to the application.

Tip: Bear in mind that Active/Inactive or item lifecycle information should not be used to filter out records.  This information should be sent to the application so it knows when an item becomes inactive.

  1. Be consistent:

The extract process must produce files of consistent format every time it is executed.  File names, field names, and position, delimiter, and Excel sheet name if Excel is used, numeric formats and date formats, and the use of quotes around values should never differ from one execution of the extract one day to the next. A hands-off report or stored procedure should be prepared and used for every execution of the extract.


Business Validation Background

Below is a break down each of validation step into considerations, specifically in the case where the vendor has provided a template format for the interfacing files where each type of information is provided in its own file.  Files sent from your ERP to Smart are formatted for easy export from the ERP.  That sort of format makes the comparison back to the ERP a relatively simple job for IT, but it can be harder for the business to interpret.  Best practice is to manipulate the ERP data, either by using pivot tables or similar in a spreadsheet.  IT may assist by providing re-formatted data files for review by the business.

To delve into the interfacing files, you’ll need to understand them.  The vendor will supply a precise template, but generally interfacing files consist into three types: catalog data, item attributes, and transactional data.

  • Catalog data contains identifiers and their attributes. Identifiers are typically for products, locations (which could be plants or warehouses), your customers, and your suppliers.
  • Item attributes contain information about products at locations that are needed for analysis on the product and location combination. Such as:
    • Current replenishment policy in the form of a Min and Max, Reorder Point, or Review Period and Order Up To value, or Safety Stock
    • Primary supplier assignment and nominal lead time and cost per unit from that supplier
    • Order quantity requirements such as minimum order quantity, manufacturing lot size, or order multiples
    • Active/Inactive status of the product/location combination or flags that identify its state in its lifecycle, such as pre-obsolete
    • Attributes for grouping or filtering, such as assigned buyer/planner or product category
    • Current inventory information like on hand, on order, and in transit quantities.
  • Transactional data contains references to identifiers along with dates and quantities. Such as quantity sold in a sales order of a product, at a location, for a customer, on a date.  Or quantity placed on purchase order of a product, into a location, from a supplier, on a date. Or quantity used in a work order of a component product at a location on a date.


Validating Catalog Data

Considering catalog data first, you may have catalog files similar to these examples:

Implementing Demand Planning and Inventory Optimization Software 111

Location Identifier Description Region Source Location  etc…
Location1 First location North    
Location2 Second location South Location1  
Location3 Third location South Location1  
…etc…        


Customer Identifier Description SalesPerson Ship From Location  etc…
Customer1 First customer Jane Location1  
Customer2 Second customer Jane Location3  
Customer3 Third customer Joe Location2  
…etc…        


Supplier Identifier Description Status Typical Lead                 Time Days  etc…
Supplier1 First supplier Active 18  
Supplier2 Second supplier Active 60  
Supplier3 Third Supplier Active 5  
…etc…        


1: Check for a reasonable count of catalog records

For each file of catalog data, open it in a spreadsheet tool like Google Sheets or MS Excel. Answer these questions:

  1. Is the record count in the ballpark? If you have about 50K products, there should not be only 10K rows in its file.
  2. If it’s a short file, maybe the Location file, you can confirm exactly that all expected Iidentifiers are in it.
  3. Filter by each attribute value and confirm again the count of records with that attribute value makes sense.

2: Check the correctness of values in each attribute field

Someone who knows what the products are and what the groups mean needs to take the time to confirm it is actually right, for all the attributes of all the catalog data.

So, if your Product file contains the attributes as in the example above, you would filter for Status of Active, and check that all resulting products are actually active.  Then filter for Status of Inactive and check that all resulting products are actually inactive.  Then filter for the first Group value and confirm all resulting products are in that group.  Repeat for Group2 and Group3, etc.  Then repeat for every attribute in every file.

It can help to do this validation with a comparison to an already existing and trusted report.  If you have another spreadsheet that shows products by Group for any reason, you can compare the interfacing files to it.  You may need to familiarize yourself with the VLOOKUP function that helps with spreadsheet comparison.

Validating Item Attribute Data

1: Check for a reasonable count of item records

The item attribute data confirmation is similar to the catalog data.  Confirm the product/location combination count makes sense in total and for each of the unique item attributes, one by one. This is an example item data file:

Implementing Demand Planning and Inventory Optimization Software 22

2: Find and explain weird numbers in item file

There tends to be many numerical values in the item attributes, so “weird” numbers merit review.  To validate data for a numerical attribute in any file, search for where the number is:

  • Missing entirely
  • Equal to zero
  • Less than zero
  • More than most others, or less than most others (sort by that column)
  • Not a number at all, when it should be

A special consideration of files that are not catalog files is they may not show the descriptions of the products and locations, just their identifiers, which can be meaningless to you.  You can insert columns to hold the product and location descriptors that you are used to seeing and fill them into the spreadsheet to assist in your work.  The VLOOKUP function works for this as well.  Whether or not you have another report to compare the Items file to, you have the catalog files for Products and Location with show both the identifier and the description for each row.

3: Spot check

If you are frustrated to find that there are too many attribute values to manually check in a reasonable amount of time, spot checking is a solution. It can be done in a manner likely to pick up on any problems.  For each attribute, get a list of the unique values in each column.  You can copy a column into a new sheet, then use the Remove Duplicates function to see the list of possible values.   With it:

  1. Confirm that no attribute values are present that shouldn’t be.
  2. It can be harder to remember which attribute values are missing that should be there, so it can help to look at another source to remind you. For example, if Group1 through Group12 are present, you might check another source to remember if these are all the Groups possible.  Even if it is not required for the interfacing files for the application, it may be easy for IT to extract a list of all the possible Groups that are in your ERP which you can use for the validation exercise.  If you find extra or missing values that you don’t expect, bring an example of each to IT to investigate.
  3. Sort alphabetically and scan down to see if any two values are similar but slightly different, maybe only in punctuation, which could mean one record had the attribute data entered incorrectly.

For each type of item, maybe one from each product group and/or location, check that all its attributes in every file are correct or at least pass a sanity check.  The more you can spot check from a broad range of items, the less likely you will have issues post go live.


Validating Transactional Data

Transactional files may all have a format similar to this:

Implementing Demand Planning and Inventory Optimization Software 333


1: Find and explain weird numbers in each transactional file

These should be checked for “weird” numbers in the Quantity field.  Then you can proceed to:

  1. Filter for dates outside the range you expect or missing expected dates entirely.
  2. Find where Transaction identifiers and line numbers are missing. They shouldn’t be.
  3. If there is more than one record for a given Transaction ID and Transaction Line Number combination, is that a mistake? Put another way, should duplicate records have their quantities summed together or is that double counting?

2: Sanity check summed quantities

Do a sanity check by filtering to a particular product you’re familiar with, and filter to a relatable date range such as last month or last year, and sum the quantities.  Is that total amount what you expected for that product in that time frame?  If you have information on total usage out of a location, you can slice the data that way to sum the quantities and compare to what you expect.  Pivot tables come in handy for verification of transactional data.  With them, you can view the data like:

Product Year Quantity Total
Prod1 2022 9,034
Prod1 2021 8,837
etc    


The products’ yearly total may be simple to sanity check if you know the products well.  Or you can VLOOKUP to add attributes, such as product group, and pivot on that to see a higher level that is more familiar:

Product Group Year Quantity Total
Group1 2022 22,091
Group2 2021 17,494
etc    


3: Sanity check count of records

It may help to display a count of transactions rather than a sum of the quantities, especially for purchase order data.  Such as:

Product Year Number of POs
Prod1 2022 4
Prod1 2021 1
etc    


And/or the same summarization at a higher level, like:

Product Group Year Number of POs
Group1 2022 609
Group2 2021 40
etc    


4: Spot checking

Spot checking the correctness of a single transaction, for each type of item and each type of transaction, completes due diligence.  Pay special attention to what date is tied to the transaction, and whether it is right for the analysis.  Dates may be a creation date, like the date a customer placed an order with you, or a promise date, like the date you expected to deliver on the customer’s order at the time of creating it, or a fulfilment date, when you actually delivered on the order.  Sometimes a promise date gets modified days after creating the order if it can’t be met.  Make sure the date in use reflects actual demand by the customer for the product most closely.

What to do about bad data 

If the mis-entries are few or one-off, you can edit the ERP records by hand as they are found, cleaning up your catalog attributes, even after go-live with the application.  But if large swathes of attributes or transaction quantities are off, this can spur an internal project to re-enter data correctly and possibly to change or start to document the process that needs to be followed when new records are entered into your ERP.

Care must be taken to avoid too long a delay in implementation of the SaaS application while waiting on clean attributes.  Break the work into chunks and use the application to analyze the clean data first so the data cleansing project occurs in parallel with getting value out of the new application.


Extend Microsoft 365 F&SC and AX with Smart IP&O

Microsoft Dynamics 365 F&SC and AX can manage replenishment by suggesting what to order and when via reorder point-based inventory policies.  A challenge that customers face is that efforts to maintain these levels are very detailed oriented and that the ERP system requires that the user manually specify these reorder points and/or forecasts.  As an alternative, many organizations end up generating inventory policies by hand using Excel spreadsheets or using other ad hoc approaches.

These methods are time-consuming and both likely result in some level of inaccuracy.  As a result, the organization will end up with excess inventory, unnecessary shortages, and a general mistrust of their software systems. In this article, we will review the inventory ordering functionality in AX / D365 F&SC, explain its limitations, and summarize how Smart Inventory Planning & Optimization can help improve a company’s cash position.   This is accomplished by reduced inventory, minimized and controlled stockouts.   Use of Smart Software delivers predictive functionality that is missing in Dynamics 365.

Microsoft Dynamics 365 F&SC and AX Replenishment Policies

In the inventory management module of AX and F&SC, users can manually enter planning parameters for every stock item. These parameters include reorder points, safety stock lead times, safety stock quantities, reorder cycles, and order modifiers such as supplier imposed minimum and maximum order quantities and order multiples. Once entered, the ERP system will reconcile incoming supply, current on hand, outgoing demand, and the user defined forecasts and stocking policies to net out the supply plan or order schedule (i.e., what to order and when).

There are 4 replenishment policy choices in F&SC and AX:  Fixed Reorder Quantity, Maximum Quantity, Lot-For-Lot and Customer Order Driven.

  • Fixed Reorder Quantity and Max are reorder point-based replenishment methods. Both suggest orders when on hand inventory hits the reorder point. With fixed ROQ, the order size is specified and will not vary until changed. With Max, order sizes will vary based on stock position at time of order with orders being placed up to the Max.
  • Lot-for Lot is a forecasted based replenishment method that pools total demand forecasted over a user defined time frame (the “lot accumulation period”) and generates an order suggestion totaling the forecasted quantity. So, if your total forecasted demand is 100 units per month and the lot accumulation period is 3 months, then your order suggestion would equal 300 units.
  • Order Driven is a make to order based replenishment method. It doesn’t utilize reorder points or forecasts. Think of it as a “sell one, buy one” logic that only places orders after demand is entered.


Limitations

Every one of F&SC / AX replenishment settings must be entered manually or imported through custom uploads created by customers.  There simply isn’t any way for users to natively generate any inputs (especially not optimal ones). The lack of credible functionality for unit level forecasting and inventory optimization within the ERP system is why so many AX and F&SC users are forced to rely on spreadsheets for planning and then manually set the parameters the ERP needs.  In reality, most planners end up manually set demand forecasts and reordering.

And when they can use spread sheets, they often rely on wide rule of thumb methods that results in using simplified statistical models.  Once calculated in the spread sheet these must be loaded into F&SC/AX.  They are often either loaded via cumbersome file imports or manually entered.   Because of the time and effort, it takes to build these, companies do not frequently update these numbers.

Once these are set in place, organizations tend to employ a reactive approach to changes.  The only time a buyer/planner reviews inventory policy is annually or at the time of purchases or manufacturing.   Some firms will also react after encountering problems with inventory levels being short (or too high).  Managing this in AX and F&AS requires manual interrogation to review history, calculate forecasts, assess buffer positions, and to recalibrate.

Microsoft recognizes these constraints in their core ERPs and understands the significant challenges to customers.  In response Microsoft has positioned forecasting under their AI Azure stack.  This method is outside of the core ERPs.  It is offered as a tool set for Data Scientists to use in defining custom complex statistics and calculations as a company wishes.  This is in addition to some basic simple calculations as a starting point are currently in their start up phases of development.  While this may hold long term gains, currently this method means customers start from near scratch and define what Microsoft currently called ‘experiments’ to gauge demand planning.

The bottom line is that customers face large challenges in getting the Dynamics stack itself to help solve these problems.  The result is for CFOs to have less cash available for what they need and for Sales Execs to have sales opportunities unfilled and a potential loss of sales because the firm can’t ship the goods the customer wants.


Get Smarter

Wouldn’t it be better to simply leverage a best of breed add-on for demand planning; and a best of breed inventory optimization solution to manage and balance costs and fulfilment levels?  Wouldn’t it be better to be able to do this on a daily or weekly basis to make your decisions closest to the need, preserving cash while meeting sales demand?

Imagine having a bidirectional integration with AX and F&AS so this all operates easily and quickly.   One where:

  • you could automatically recalibrate policies in frequent planning cycles using field proven, cutting-edge statistical models,
  • you would be able to calculate demand forecasts that account for seasonality, trend, and cyclical patterns,
  • You would automatically leverage optimization methods that prescribe the most profitable stocking policies and service levels that consider the real costs of carrying inventory and stock outages, giving you a full economic picture,
  • You could free up cash for use within the company and manage your inventory levels to improve order fulfillment at the same time as you free this cash.
  • you would have safety stocks and inventory levels that would account for demand and supply variability, business conditions, and priorities,
  • you’d be able to target specific service levels by groups of products, customers, warehouses, or any other dimension you selected,
  • you increase overall company profit and balance sheet health.


Extend Microsoft 365 F&SC and AX with Smart IP&O

To see a recording of the Microsoft Dynamics Communities Webinar showcasing Smart IP&O, register here:

https://smartcorp.com/inventory-planning-with-microsoft-365-fsc-and-ax/