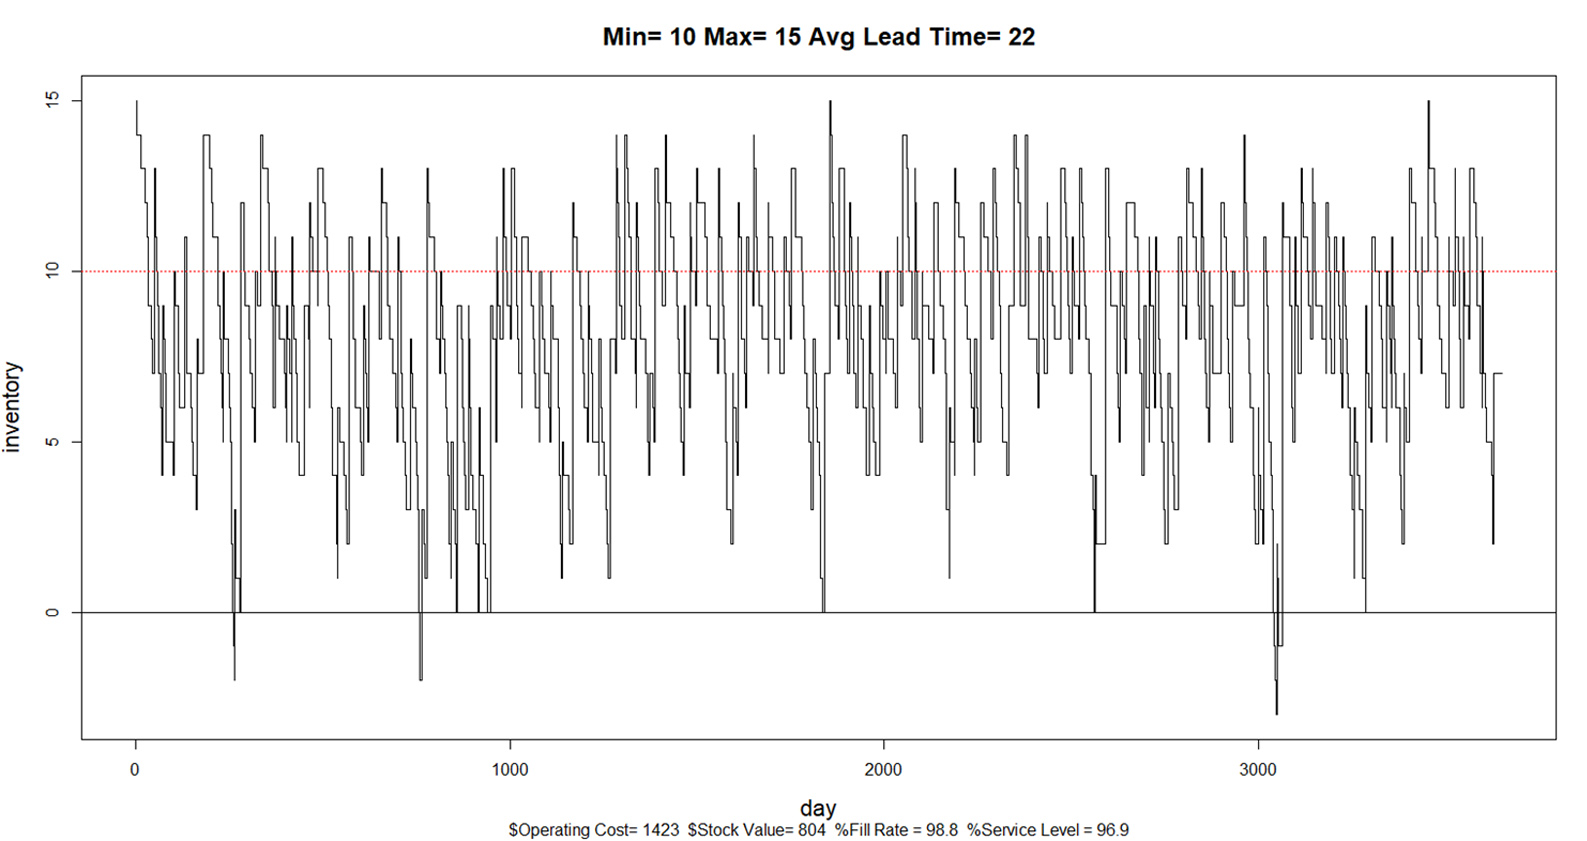
Figure 3 Simulation of abnormal operations using longer lead times and revised Min and Max
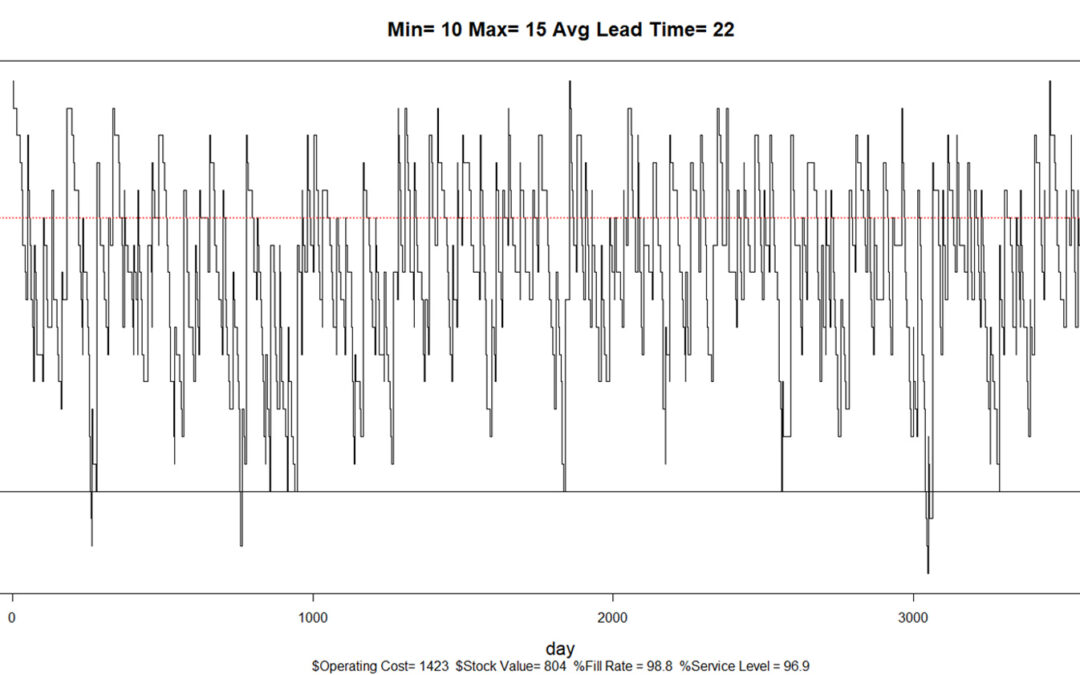
Figure 3 Simulation of abnormal operations using longer lead times and revised Min and Max
 Managing Spare Parts Inventory: Best Practices
 5 Ways to Improve Supply Chain Decision Speed
 12 Causes of Overstocking and Practical Solutions
 Managing Spare Parts Inventory: Best Practices12 Causes of Overstocking and Practical Solutions
 FAQ: Mastering Smart IP&O for Better Inventor…