What Silicon Valley Bank Can Learn from Supply Chain Planning

​If you had your head up lately, you may have noticed some additional madness off the basketball court: The failure of Silicon Valley Bank. Those of us in the supply chain world may have dismissed the bank failure as somebody else’s problem, but that sorry episode holds a big lesson for us, too: The importance of stress testing done right.

The Washington Post recently carried an opinion piece by Natasha Sarin called “Regulators missed Silicon Valley Bank’s problems for months. Here’s why.” Sarin outlined the flaws in the stress testing regime imposed on the bank by the Federal Reserve. One problem is that the stress tests are too static. The Fed’s stress factor for nominal GDP growth was a single scenario listing presumed values over the next 13 quarters (see Figure 1). Those 13 quarterly projections might be somebody’s consensus view of what a bad hair day would look like, but that’s not the only way things could play out.  As a society, we are being taught to appreciate a better way to display contingencies every time the National Weather Service shows us projected hurricane tracks (see Figure 2). Each scenario represented by a different colored line shows a possible storm path, with the concentrated lines representing the most likely.  By exposing the lower probability paths, risk planning is improved.

When stress testing the supply chain, we need realistic scenarios of possible future demands that might occur, even extreme demands.   Smart provides this in our software (with considerable improvements in our Gen2 methods).  The software generates a huge number of credible demand scenarios, enough to expose the full scope of risks (see Figure 3). Stress testing is all about generating massive numbers of planning scenarios, and Smart’s probabilistic methods are a radical departure from previous deterministic S&OP applications, being entirely scenario based.

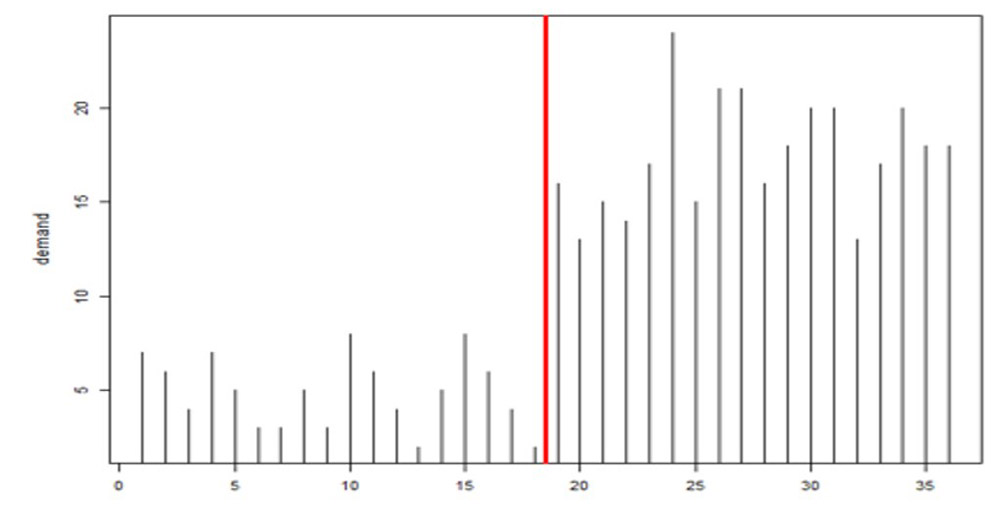
The other flaw in the Fed’s stress tests was that they were designed months in advance but never updated for changing conditions.  Demand planners and inventory managers intuitively appreciate that key variables like item demand and supplier lead time are not only highly random even when things are stable but also subject to abrupt shifts that should require rapid rewriting of planning scenarios (see Figure 4, where the average demand jumps up dramatically between observations 19 and 20). Smart’s Gen2 products include new tech for detecting such “regime changes”  and automatically changing scenarios accordingly.

Banks are forced to undergo stress tests, however flawed they may be, to protect their depositors. Supply chain professionals now have a way to protect their supply chains by using modern software to stress test their demand plans and inventory management decisions.

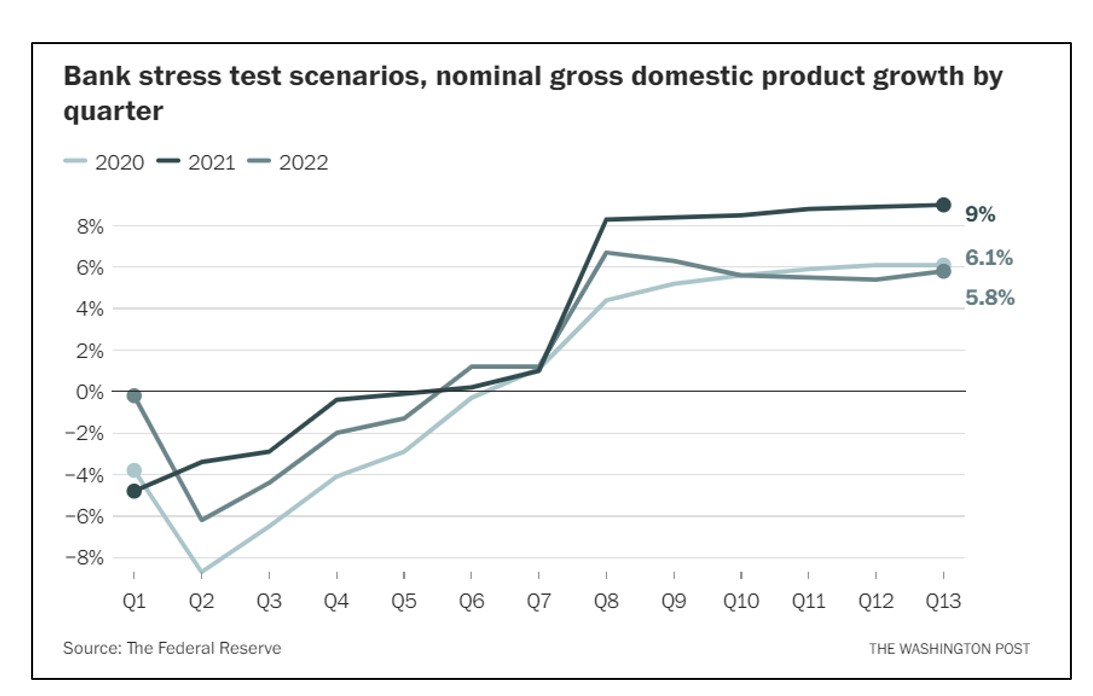
1 Scenarios used the Fed to stress test banks Software

Figure 1: Scenarios used the Fed to stress test banks.


2 Scenarios used by the National Weather Service to predict hurricane tracks

Figure 2: Scenarios used by the National Weather Service to predict hurricane tracks


3 Demand scenarios of the type generated by Smart Demand Planner

Figure 3: Demand scenarios of the type generated by Smart Demand Planner


4 Example of regime change in product demand after observation #19

Figure 4: Example of regime change in product demand after observation #19


Spare Parts, Replacement Parts, Rotables, and Aftermarket Parts

What’s the difference, and why it matters for inventory planning.

Those new to the parts planning game are often confused by the many variations in the names of parts. This blog points out distinctions that do or do not have operational significance for someone managing a fleet of spare parts and how those differences impact inventory planning.

For instance, what is the difference between “spare” parts and “replacement” parts? In this case, the difference is their source. A spare part would be purchased from the equipment’s manufacturer, whereas a replacement part would be purchased from a different company. For someone managing a fleet of spares, the difference would be two different entries in their parts database: the source would be different, and the unit price would probably be different. It is possible that there would also be a difference in the useful life of the parts from the two sources. The “OEM” parts might be more durable than the cheaper “aftermarket” parts. (Now we have four different terms describing these parts.) These distinctions would be salient for optimizing an inventory of spares. Software that computes optimal reorder points and order quantities would arrive at different answers for parts with different unit costs and different rates of replacement.

Perhaps the largest distinction is between “consumable” and “repairable” or “rotable” parts. The key distinction between them is their cost. It is foolish to try to repair a stripped screw; just throw it out and use another one. But it is also foolish to throw out a $50,000 component if it can be repaired for $5,000. Optimizing the management of inventory for fleets of each type of part requires very different math. With consumables, the parts can be regarded as anonymous and interchangeable. With “rotatables”, each part must essentially be modeled individually. We treat each as cycling through states of “operational,” “under repair,” and “standby/spare.” Decisions about repairable parts are often handled by a capital budgeting process, and the salient analytical question is, “what should be the size of our spares pool?”

There are other distinctions that can be drawn among parts. Criticality is an important attribute. The consequences of part failure can range from “we can take our time to get a replacement” to “this is an emergency; get those machines back in action pronto”. When working out how to manage parts, we must always strike a balance between the benefits of having a larger stock of parts and the dollar costs. Criticality shifts the balance toward playing it safe with larger inventories. In turn, this dictates higher planning targets for part availability metrics such as service levels and fill rates, which will lead to larger reorder points and/or order quantities.

If you Google “types of spare parts”, you will discover other classifications and distinctions. From our perspective at Smart Software, the words matter less than the numbers associated with parts: unit costs, mean time before failure, mean time to repair and other technical inputs to our products that work out how to manage the parts for maximum benefit.


Spare Parts Planning Software solutions

Smart IP&O’s service parts forecasting software uses a unique empirical probabilistic forecasting approach that is engineered for intermittent demand. For consumable spare parts, our patented and APICS award winning method rapidly generates tens of thousands of demand scenarios without relying on the assumptions about the nature of demand distributions implicit in traditional forecasting methods. The result is highly accurate estimates of safety stock, reorder points, and service levels, which leads to higher service levels and lower inventory costs. For repairable spare parts, Smart’s Repair and Return Module accurately simulates the processes of part breakdown and repair. It predicts downtime, service levels, and inventory costs associated with the current rotating spare parts pool. Planners will know how many spares to stock to achieve short- and long-term service level requirements and, in operational settings, whether to wait for repairs to be completed and returned to service or to purchase additional service spares from suppliers, avoiding unnecessary buying and equipment downtime.

Contact us to learn more how this functionality has helped our customers in the MRO, Field Service, Utility, Mining, and Public Transportation sectors to optimize their inventory. You can also download the Whitepaper here.


White Paper: What you Need to know about Forecasting and Planning Service Parts


This paper describes Smart Software’s patented methodology for forecasting demand, safety stocks, and reorder points on items such as service parts and components with intermittent demand, and provides several examples of customer success.


    Spare Parts Planning Isn’t as Hard as You Think

    When managing service parts, you don’t know what will break and when because part failures are random and sudden. As a result, demand patterns are most often extremely intermittent and lack significant trend or seasonal structure. The number of part-by-location combinations is often in the hundreds of thousands, so it’s not feasible to manually review demand for individual parts. Nevertheless, it is much more straightforward to implement a planning and forecasting system to support spare parts planning than you might think.

    This conclusion is informed by hundreds of software implementations we’ve directed over the years. Customers managing spare parts and service parts (the latter for internal consumption/MRO), and to a lesser degree aftermarket parts (for resale to installed bases), have consistently implemented our parts planning software faster than their peers in manufacturing and distribution.

    The primary reason is the role in manufacturing and distribution of business knowledge about what might happen in the future. In a traditional B2B manufacturing and distribution environment, there are customers and sales and marketing teams selling to those customers. There are sales goals, revenue expectations, and budgets. This means there is a lot of business knowledge about what will be purchased, what will be promoted, whose opinions need to be accounted for. A complex planning loop is required. In contrast, when managing spare parts, you have a maintenance team that fixes equipment when it breaks. Though there are often maintenance schedules for guidance, what is needed beyond a standard list of consumable parts is often unknown until a maintenance person is on-site. In other words, there just isn’t the same sort of business knowledge available to parts planners when making stocking decisions.

    Yes, that is a disadvantage, but it also has an upside: there is no need to produce a period-by-period consensus demand forecast with all the work that requires. When planning spare parts, you can usually skip many steps required for a typical manufacturer, distributor, or retailer. These skippable steps include:  

    1. Building forecasts at different levels of the business, such as product family or region.
    2. Sharing the demand forecast with sales, marketing, and customers.
    3. Reviewing forecast overrides from sales, marketing, and customers.
    4. Agreeing on a consensus forecast that combines statistics and business knowledge.
    5. Measuring “forecast value add” to determine if overrides make the forecast more accurate.
    6. Adjusting the demand forecast for known future promotions.
    7. Accounting for cannibalization (i.e., if I sell more of product A, I’ll sell less of product B).

    Freed from a consensus-building process, spare parts planners and inventory managers can rely directly on their software to predict usage and the required stocking policies. If they have access to a field-proven solution that addresses intermittent demand, they can quickly “go live” with more accurate demand forecasts and estimates of reorder points, safety stocks, and order suggestions.  Their attention can be focused on getting accurate usage and supplier lead time data. The “political” part of the job can be limited to obtaining organization consensus on service level targets and inventory budgets.

    Spare Parts Planning Software solutions

    Smart IP&O’s service parts forecasting software uses a unique empirical probabilistic forecasting approach that is engineered for intermittent demand. For consumable spare parts, our patented and APICS award winning method rapidly generates tens of thousands of demand scenarios without relying on the assumptions about the nature of demand distributions implicit in traditional forecasting methods. The result is highly accurate estimates of safety stock, reorder points, and service levels, which leads to higher service levels and lower inventory costs. For repairable spare parts, Smart’s Repair and Return Module accurately simulates the processes of part breakdown and repair. It predicts downtime, service levels, and inventory costs associated with the current rotating spare parts pool. Planners will know how many spares to stock to achieve short- and long-term service level requirements and, in operational settings, whether to wait for repairs to be completed and returned to service or to purchase additional service spares from suppliers, avoiding unnecessary buying and equipment downtime.

    Contact us to learn more how this functionality has helped our customers in the MRO, Field Service, Utility, Mining, and Public Transportation sectors to optimize their inventory. You can also download the Whitepaper here.


    White Paper: What you Need to know about Forecasting and Planning Service Parts


    This paper describes Smart Software’s patented methodology for forecasting demand, safety stocks, and reorder points on items such as service parts and components with intermittent demand, and provides several examples of customer success.


      7 Digital Transformations for Utilities that will Boost MRO Performance

      Utilities in the electrical, natural gas, urban water and wastewater, and telecommunications fields are all asset intensive. Generation, production, processing, transmission, and distribution of electricity, natural gas, oil, and water, are all reliant on physical infrastructure that must be properly maintained, updated, and upgraded over time. Maximizing asset uptime and the reliability of physical infrastructure demands effective inventory management, spare parts forecasting, and supplier management.

      A utility that executes these processes effectively will outperform its peers, provide better returns for its investors and higher service levels for its customers, while reducing its environmental impact. Impeding these efforts are out-of-date IT systems, evolving security threats, frequent supply chain disruptions, and extreme demand variability.  However, the convergence of these challenges with mature cloud technology and recent advancements in data analytics, probabilistic forecasting, and technologies for data management, present utilities a generational opportunity to digitally transform their enterprise.

      Here are seven digital transformations that require relatively small upfront investments but will generate seven-figure returns.

      1. Inventory Management is the first step in MRO inventory optimization. It involves analyzing current inventory levels and usage patterns to identify opportunities for improvement. This should include looking for overstocked, understocked, or obsolete items.  New probabilistic forecasting technology will help by simulating future parts usage and predicting how current stocking policies will perform.  Pats planners can use the simulation results to proactively identify where policies should be modified.

      2. Accurate forecasting and demand planning are very important in optimizing MRO service parts inventories. An accurate demand forecast is a critical supply chain driver. By understanding demand patterns that result from capital projects and planned and unplanned maintenance, parts planners can more accurately anticipate future inventory needs, budget properly, and better communicate anticipated demand to suppliers. Parts forecasting software can be used to automatically house an accurate set of historical usage that details planned vs. unplanned parts demand.

      3. Managing suppliers and lead times are important components of MRO inventory optimization. It involves selecting the best vendors for the job, having backup suppliers that can deliver quickly if the preferred supplier fails, and negotiating favorable terms.  Identifying the right lead time to base stocking policies on is another important component. Probabilistic simulations available in parts planning software can be used to forecast the probability for each possible lead time that will be faced. This will result in a more accurate recommendation of what to stock compared to using a supplier quoted or average lead time.

      4. SKU rationalization and master data management removes ineffective or out-of-date SKUs from the product catalog and ERP database. It also identifies different part numbers that have been used for the same SKU. The operating cost and profitability of each product are assessed during this procedure, resulting in a common list of active SKUs.  Master data management software can assess product catalogs and information stored in disparate data bases to identify SKU rationalizations ensuring that inventory policies are based on the common part number.

      5.  Inventory control systems are key to synchronizing inventory optimization.    They provide a cost-efficient way for utilities to track, monitor, and manage their inventory. They helps ensure that the utility has the right supplies and materials when and where needed while minimizing inventory costs.

      6. Continuous improvement is essential for optimizing MRO inventories. It involves regularly monitoring and adjusting inventory levels and stocking policies to ensure the most efficient use of resources. When operating conditions change, the utility must detect the change and adjust its operations accordingly. This means planning cycles must operate at a tempo high enough to stay up with changing conditions. Leveraging probabilistic forecasting to recalibrate service parts stocking policies each planning cycle ensures that stocking policies (such as min/max levels) are always up-to-date and reflect the latest parts usage and supplier lead times.

      7. Planning for intermittent demand with modern Spare Parts Planning Software.  The result is a highly accurate estimate of safety stocks, reorder points, and order quantities, leading to higher service levels and lower inventory costs.   Smart Software’s patented probabilistic spare parts forecasting software simulates the probability for each possible demand, accurately determining how much to stock to achieve a utility’s targeted service levels.  Leveraging software to accurately simulate the inflow and outflow of repairable spare parts will better predict downtime, service levels, and inventory costs associated with any chosen pool size for repairable spares.


      Spare Parts Planning Software solutions

      Smart IP&O’s service parts forecasting software uses a unique empirical probabilistic forecasting approach that is engineered for intermittent demand. For consumable spare parts, our patented and APICS award winning method rapidly generates tens of thousands of demand scenarios without relying on the assumptions about the nature of demand distributions implicit in traditional forecasting methods. The result is highly accurate estimates of safety stock, reorder points, and service levels, which leads to higher service levels and lower inventory costs. For repairable spare parts, Smart’s Repair and Return Module accurately simulates the processes of part breakdown and repair. It predicts downtime, service levels, and inventory costs associated with the current rotating spare parts pool. Planners will know how many spares to stock to achieve short- and long-term service level requirements and, in operational settings, whether to wait for repairs to be completed and returned to service or to purchase additional service spares from suppliers, avoiding unnecessary buying and equipment downtime.

      Contact us to learn more how this functionality has helped our customers in the MRO, Field Service, Utility, Mining, and Public Transportation sectors to optimize their inventory. You can also download the Whitepaper here.


      White Paper: What you Need to know about Forecasting and Planning Service Parts


      This paper describes Smart Software’s patented methodology for forecasting demand, safety stocks, and reorder points on items such as service parts and components with intermittent demand, and provides several examples of customer success.


        6 Do’s and Don’ts for Spare Parts Planning

        Managing spare parts inventories can feel impossible. You don’t know what will break and when. Feedback from mechanical departments and maintenance teams is often inaccurate. Planned maintenance schedules are often shifted around, making them anything but “planned.”   Usage (i.e., demand) patterns are most often extremely intermittent, i.e., demand jumps randomly between zero and something else, often a surprisingly big number. Intermittency, combined with the lack of significant trend or seasonal patterns, render traditional time-series forecasting methods inaccurate. The large number of part-by-locations combinations makes it impossible to manually create or even review forecasts for individual parts.   Given all these challenges, we thought it would be helpful to outline a number of do’s (and their associated don’ts).

        1. Do use probabilistic methods to compute a reorder points and Min/Max levels
          Basing stocking decisions on average daily usage isn’t the right answer. Nor is reliance on traditional forecasting methods like exponential smoothing models. Neither approach works when demand is intermittent because they don’t take proper account of demand volatility. Probabilistic methods that simulate thousands of possible demand scenarios work best. They provide a realistic estimate of the demand distribution and can handle all the zeros and random non-zeros. This will ensure the inventory level is right-sized to hit whatever service level target you choose.
           
        2. Do use service levels instead of rule-of-thumb methods to determine stocking levels
          Many parts planning organizations rely on multiples of daily demand and other rules of thumb to determine stocking policies. For example, reorder points are often based on doubling average demand over the lead time or applying some other multiple depending on the importance of the item. However, averages don’t account for how volatile (or noisy) a part is and will lead to overstocking less noisy parts and understocking more noisy parts.
           
        3. Do frequently recompute stocking policies
          Just because demand is intermittent doesn’t mean nothing changes over time. Yet after interviewing hundreds of companies managing spare parts inventory, we find that fewer than 10% recompute stocking policies monthly. Many never recompute stocking policies until there is a “problem.” Across thousands of parts, usage is guaranteed to drift up or down on at least some of the parts. Supplier lead times can also change. Using an outdated reorder point will cause orders to trigger too soon or too late, creating lots of problems. Recomputing policies every planning cycle ensures inventory will be right-sized. Don’t be reactive and wait for a problem to occur before considering whether the Min or Max should be modified. By then it’s too late – it’s like waiting for your brakes to fail before making a repair. Don’t worry about the effort of recomputing Min/Max values for large numbers of SKU’s: modern software does it automatically. Remember: Recalibration of your stocking policies is preventive maintenance against stockout!
           
        4. Do get buy-in on targeted service levels
          Inventory is expensive and should be right-sized based on striking a balance between the organization’s willingness to stock out and its willingness to budget for spares. Too often, planners make decisions in isolation based on pain avoidance or maintenance technicians’ requests without consideration of how spending on one part impacts the organization’s ability to spend on another part. Excess inventory on one part hurts service levels on other parts by disproportionally consuming the inventory budget. Make sure that service level goals and associated inventory costs of achieving the service levels are understood and agreed to.
           
        5. Do run a separate planning process for repairable parts
          Some parts are very expensive to replace, so it is preferable to send them to repair facilities or back to the OEM for repair. Accounting for the supply side randomness of when repairable parts will be returned, and knowing whether to wait for a repair or to purchase an additional spare, are critical to ensuring item availability without inventory bloat. This requires specialized reporting and the use of probabilistic models.  Don’t treat repairable parts like consumable parts when planning.
           
        6. Do count what is purchased against the budget – not just what is consumed
          Many organizations will allocate total part purchases to a separate corporate budget and ding the mechanical or maintenance team’s budget for parts that are used. In most MRO organizations, especially in public transit and utilities, the repair teams dictate what is purchased. If what is purchased doesn’t count against their budget, they will over-buy to ensure there is never any chance of stockout. They have literally zero incentive to get it right, so tens of millions in excess inventory will be purchased. If what is purchased is reflected in the budget, far more attention will be paid to purchasing only what is truly needed. Recognizing that excess inventory hurts service by robbing the organization of cash that could otherwise be used on understocked parts is an important step to ensuring responsible inventory purchasing.

        Spare Parts Planning Software solutions

        Smart IP&O’s service parts forecasting software uses a unique empirical probabilistic forecasting approach that is engineered for intermittent demand. For consumable spare parts, our patented and APICS award winning method rapidly generates tens of thousands of demand scenarios without relying on the assumptions about the nature of demand distributions implicit in traditional forecasting methods. The result is highly accurate estimates of safety stock, reorder points, and service levels, which leads to higher service levels and lower inventory costs. For repairable spare parts, Smart’s Repair and Return Module accurately simulates the processes of part breakdown and repair. It predicts downtime, service levels, and inventory costs associated with the current rotating spare parts pool. Planners will know how many spares to stock to achieve short- and long-term service level requirements and, in operational settings, whether to wait for repairs to be completed and returned to service or to purchase additional service spares from suppliers, avoiding unnecessary buying and equipment downtime.

        Contact us to learn more how this functionality has helped our customers in the MRO, Field Service, Utility, Mining, and Public Transportation sectors to optimize their inventory. You can also download the Whitepaper here.


        White Paper: What you Need to know about Forecasting and Planning Service Parts


        This paper describes Smart Software’s patented methodology for forecasting demand, safety stocks, and reorder points on items such as service parts and components with intermittent demand, and provides several examples of customer success.