A Beginner’s Guide to Downtime and What to Do about It

This blog provides an overview of this topic written for non-experts. It

  • explains why you might want to read this blog.
  • lists the various types of “machine maintenance.”
  • explains what “probabilistic modeling” is.
  • describes models for predicting downtime.
  • explains what these models can do for you.

Importance of Downtime

If you manufacture things for sale, you need machines to make those things. If your machines are up and running, you have a fighting chance to make money. If your machines are down, you lose opportunities to make money. Since downtime is so fundamental, it is worth some investment of money and thought to minimize downtime. By thought I mean probability math, since machine downtime is inherently a random phenomenon. Probability models can guide maintenance policies.

Machine Maintenance Policies

Maintenance is your defense against downtime. There are multiple types of maintenance policies, ranging from “Do nothing and wait for failure” to sophisticated analytic approaches involving sensors and probability models of failure.

A useful list of maintenance policies is:

  • Sitting back and wait for trouble, then sitting around some more wondering what to do when trouble inevitably happens. This is as foolish as it sounds.
  • Same as above except you prepare for the failure to minimize downtime, e.g., stockpiling spare parts.
  • Periodically checking for impending trouble coupled with interventions such as lubricating moving parts or replacing worn parts.
  • Basing the timing of maintenance on data about machine condition rather than relying on a fixed schedule; requires ongoing data collection and analysis. This is called condition-based maintenance.
  • Using data on machine condition more aggressively by converting it into predictions of failure time and suggestions for steps to take to delay failure. This is called predictive maintenance.

The last three types of maintenance rely on probability math to establish a maintenance schedule, or determine when data on machine condition call for intervention, or calculate when failure might occur and how best to postpone it.


Probability Models of Machine Failure

How long a machine will run before it fails is a random variable. So is the time it will spend down. Probability theory is the part of math that deals with random variables. Random variables are described by their probability distributions, e.g., what is the chance that the machine will run for 100 hours before it goes down? 200 hours? Or, equivalently, what is the chance that the machine is still working after 100 hours or 200 hours?

A sub-field called “reliability theory” answers this type of question and addresses related concepts like Mean Time Before Failure (MTBF), which is a shorthand summary of the information encoded in the probability distribution of time before failure.

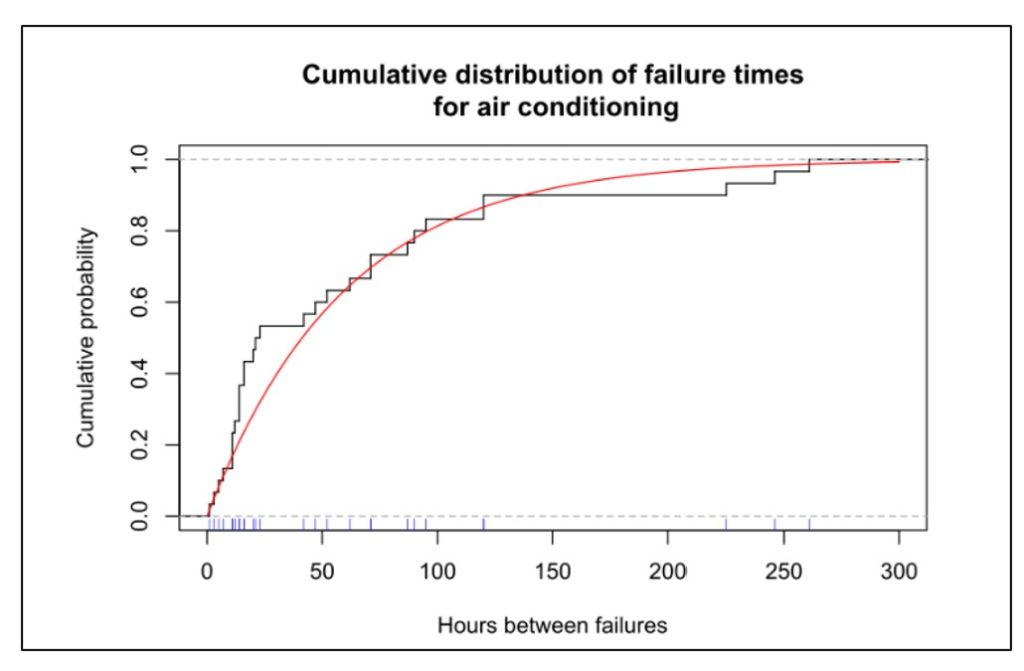
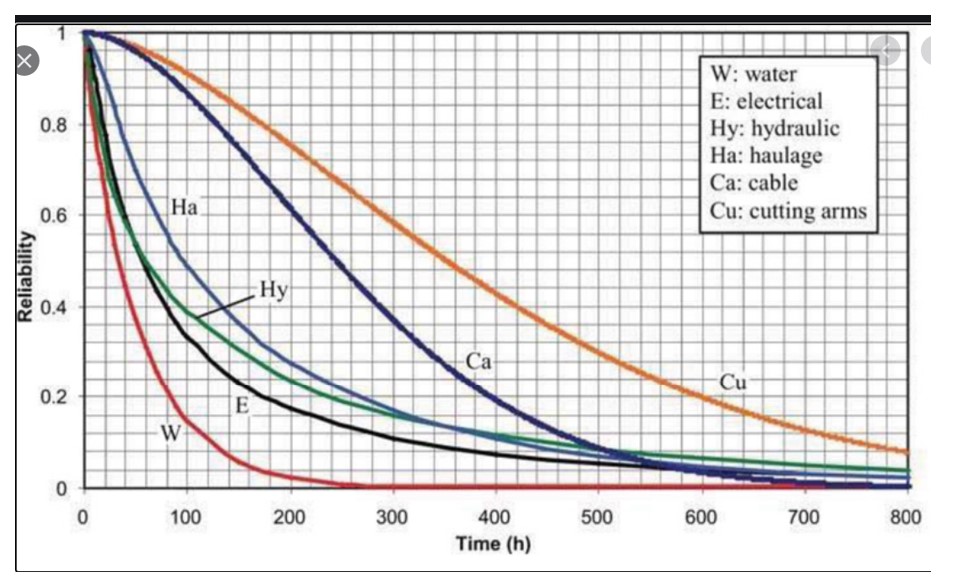
Figures 1 shows data on the time before failure of air conditioning units. This type of plot depicts the cumulative probability distribution and shows the chance that a unit will have failed after some amount of time has elapsed. Figure 2 shows a reliability function, plotting the same type of information in an inverse format, i.e., depicting the chance that a unit is still functioning after some amount of time has elapsed.

In Figure 1, the blue tick marks next to the x-axis show the times at which individual air conditioners were observed to fail; this is the basic data. The black curve shows the cumulative proportion of units failed over time. The red curve is a mathematical approximation to the black curve – in this case an exponential distribution. The plots show that about 80 percent of the units will fail before 100 hours of operation.

Figure 1 Cumulative distribution function of uptime for air conditioners

Figure 1 Cumulative distribution function of uptime for air conditioners


Probability models can be applied to an individual part or component or subsystem, to a collection of related parts (e.g., “the hydraulic system”), or to an entire machine. Any of these can be described by the probability distribution of the time before they fail.

Figure 2 shows the reliability function of six subsystems in a machine for digging tunnels. The plot shows that the most reliable subsystem is the cutting arms and the least reliable is the water subsystem. The reliability of the entire system could be approximated by multiplying all six curves (because for the system as a whole to work, every subsystem must be functioning), which would result in a very short interval before something goes wrong.

Figure 2 Examples of probability distributions of subsystems in a tunneling machine

Figure 2 Examples of probability distributions of subsystems in a tunneling machine


Various factors influence the distribution of the time before failure. Investing in better parts will prolong system life. So will investing in redundancy. So will replacing used pars with new.

Once a probability distribution is available, it can be used to answer any number of what-if questions, as illustrated below in the section on Benefits of Models.


Approaches to Modeling Machine Reliability

Probability models can describe either the most basic units, such as individual system components (Figure 2), or collections of basic units, such as entire machines (Figure 1). In fact, an entire machine can be modeled either as a single unit or as a collection of components. If treating an entire machine as a single unit, the probability distribution of lifetime represents a summary of the combined effect of the lifetime distributions of each component.

If we have a model of an entire machine, we can jump to models of collections of machines. If instead we start with models of the lifetimes of individual components, then we must somehow combine those individual models into an overall model of the entire machine.

This is where the math can get hairy. Modeling always requires a wise balance between simplification, so that some results are possible, and complication, so that whatever results emerge are realistic. The usual trick is to assume that failures of the individual pieces of the system occur independently.

If we can assume failures occur independently, it is usually possible to model collections of machines. For instance, suppose a production line has four machines churning out the same product. Having a reliability model for a single machine (as in Figure 1) lets us predict, for instance, the chance that only three of the machines will still be working one week from now. Even here there can be a complication: the chance that a machine working today will still be working tomorrow often depends on how long it has been since its last failure. If the time between failures has an exponential distribution like the one in Figure 1, then it turns out that the time of the next failure doesn’t depend on how long it has been since the last failure. Unfortunately, many or even most systems do not have exponential distributions of uptime, so the complication remains.

Even worse, if we start with models of many individual component reliabilities, working our way up to predicting failure times for the entire complex machine may be nearly impossible if we try to work with all the relevant equations directly. In such cases, the only practical way to get results is to use another style of modeling: Monte Carlo simulation.

Monte Carlo simulation is a way to substitute computation for analysis when it is possible to create random scenarios of system operation. Using simulation to extrapolate machine reliability from component reliabilities works as follows.

  1. Start with the cumulative distribution functions (Figure 1) or reliability functions (Figure 2) of each machine component.
  2. Create a random sample from each component lifetime to get a set of sample failure times consistent with its reliability function.
  3. Using the logic of how components are related to one another, compute the failure time of the entire machine.
  4. Repeat steps 1-3 many times to see the full range of possible machine lifetimes.
  5. Optionally, average the results of step 4 to summarize the machine lifetime with such metrics such as the MTBF or the chance that the machine will run more than 500 hours before failing.

Step 1 would be a bit complicated if we do not have a nice probability model for a component lifetime, e.g., something like the red line in Figure 1.

Step 2 can require some careful bookkeeping. As time moves forward in the simulation, some components will fail and be replaced while others will keep grinding on. Unless a component’s lifetime has an exponential distribution, its remaining lifetime will depend on how long the component has been in continual use. So this step must account for the phenomena of burn in or wear out.

Step 3 is different from the others in that it does require some background math, though of a simple type. If Machine A only works when both components 1 and 2 are working, then (assuming failure of one component does not influence failure of the other)

Probability [A works] = Probability [1 works] x Probability [2 works].

If instead Machine A works if either component 1 works or component 2 works or both work, then

Probability [A fails] = Probability [1 fails] x Probability [2 fails]

so Probability [A works] = 1 – Probability [A fails].

Step 4 can involve creation of thousands of scenarios to show the full range of random outcomes. Computation is fast and cheap.

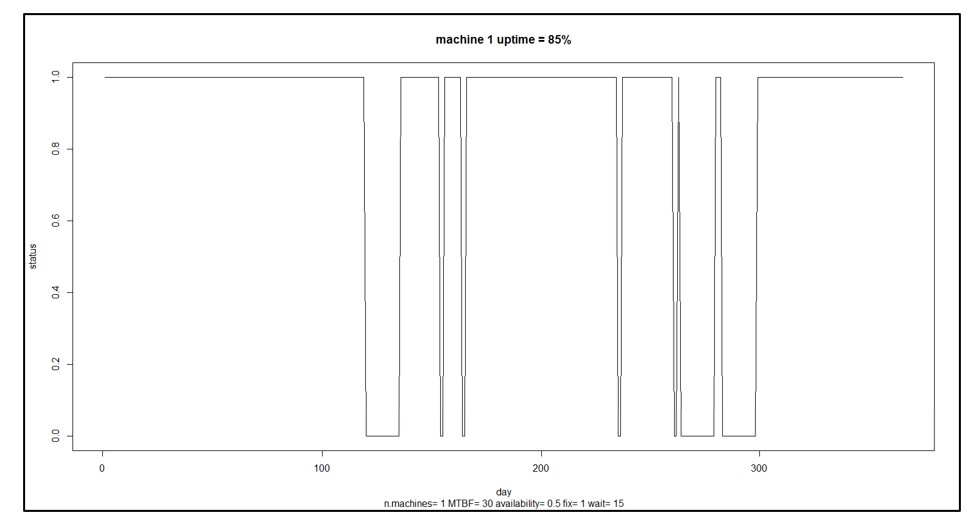
Step 5 can vary depending on the user’s goals. Computing the MTBF is standard. Choose others to suit the problem. Besides the summary statistics provided by step 5, individual simulation runs can be plotted to build intuition about the random dynamics of machine uptime and downtime. Figure 3 shows an example for a single machine showing alternating cycles of uptime and downtime resulting in 85% uptime.

Figure 3 A sample scenario for a single machine

Figure 3 A sample scenario for a single machine


Benefits of Machine Reliability Models

In Figure 3, the machine is up and running 85% of the time. That may not be good enough. You may have some ideas about how to improve the machine’s reliability, e.g., maybe you can improve the reliability of component 3 by buying a newer, better version from a different supplier. How much would that help? That is hard to guess: component 3 may only one of several and perhaps not the weakest link, and how much the change pays off depends on how much better the new one would be. Maybe you should develop a specification for component 3 that you can then shop to potential suppliers, but how long does component 3 have to last to have a material impact on the machine’s MTBF?

This is where having a model pays off. Without a model, you’re relying on guesswork. With a model, you can turn speculation about what-if situations into accurate estimates. For instance, you could analyze how a 10% increase in MTBF for component 3 would translate into an improvement in MTBF for the entire machine.

As another example, suppose you have seven machines producing an important product. You calculate that you must dedicate six of the seven to fill a major order from your one big customer, leaving one machine to handle demand from a number of miscellaneous small customers and to serve as a spare. A reliability model for each machine could be used to estimate the probabilities of various contingencies: all seven machines work and life is good; six machines work so you can at least keep your key customer happy; only five machines work so you have to negotiate something with your key customer, etc.

In sum, probability models of machine or component failure can provide the basis for converting failure time data into smart business decisions.


Read more about  Maximize Machine Uptime with Probabilistic Modeling


Read more about   Probabilistic forecasting for intermittent demand


Leave a Comment
Related Posts
Protect your Demand Planning Process from Regime Change

Protect your Demand Planning Process from Regime Change

No, not that kind of regime change: Nothing here about cruise missiles and stealth bombers. And no, we’re not talking about the other kind of regime change that hits closer to home: Shuffling the C-Suite at your company. In this blog, we discuss the relevance of regime change on time series data used for demand planning and forecasting.

How to Tell You Don’t Really Have an Inventory Planning and Forecasting Policy

How to Tell You Don’t Really Have an Inventory Planning and Forecasting Policy

You can’t properly manage your inventory levels, let alone optimize them, if you don’t have a handle on exactly how demand forecasts and stocking parameters (such as Min/Max, safety stocks, and reorder points, and order quantities) are determined. Many organizations cannot specify how policy inputs are calculated or identify situations calling for management overrides to the policy. If you have these problems, you may be wasting hundreds of thousands to millions of dollars each year in unnecessary shortage costs, holding costs, and ordering costs.

Infrequent Updates to Inventory Planning Parameters Costs Time, Money, and Hurts Service

Infrequent Updates to Inventory Planning Parameters Costs Time, Money, and Hurts Service

Inventory planning parameters such as safety stock levels, reorder points, Min/Max settings, lead times, order quantities, and DDMRP buffers directly impact inventory spending and ability to meet customer demand. Ensuring that these inputs are optimized regularly will dramatically improve customer service levels and will reduce the amount of unnecessary inventory spending.

Call an Audible to Proactively Counter Supply Chain Noise


You know the situation: You work out the best way to manage each inventory item by computing the proper reorder points and replenishment targets, then average demand increases or decreases, or demand volatility changes, or suppliers’ lead times change, or your own costs change. Now your old policies (reorder points, safety stocks, Min/Max levels, etc.)  have been obsoleted – just when you think you’d got them right.   Leveraging advanced planning and inventory optimization software gives you the ability to proactively address ever-changing outside influences on your inventory and demand.  To do so, you’ll need to regularly recalibrate stocking parameters based on ever-changing demand and lead times.

Recently, some potential customers have expressed concern that by regularly modifying inventory control parameters they are introducing “noise” and adding complication to their operations. A visitor to our booth at last week’s Microsoft Dynamics User Group Conference commented:

“We don’t want to jerk around the operations by changing the policies too often and introducing noise into the system. That noise makes the system nervous and causes confusion among the buying team.”

This view is grounded in yesterday’s paradigms.  While you should generally not change an immediate production run, ignoring near-term changes to the policies that drive future production planning and order replenishment will wreak havoc on your operations.   Like it or not, the noise is already there in the form of extreme demand and supply chain variability.  Fixing replenishment parameters, updating them infrequently, or only reviewing at the time of order means that your Supply Chain Operations will only be able to react to problems rather than proactively identify them and take corrective action.

Modifying the policies with near-term recalibrations is adapting to a fluid situation rather than being captive to it.  We can look to this past weekend’s NFL games for a simple analogy. Imagine the quarterback of your favorite team consistently refusing to call an audible (change the play just before the ball is snapped) after seeing the defensive formation.  This would result in lots of missed opportunities, inefficiency, and stalled drives that could cost the team a victory.  What would you want your quarterback to do?

Demand, lead times, costs, and business priorities often change, and as these last 18 months have proved they often change considerably.  As a Supply Chain leader, you have a choice:  keep parameters fixed resulting in lots of knee-jerk expedites and order cancellations, or proactively modify inventory control parameters.  Calling the audible by recalibrating your policies as demand and supply signals change is the right move.

Here is an example. Suppose you are managing a critical item by controlling its reorder point (ROP) at 25 units and its order quantity (OQ) at 48. You may feel like a rock of stability by holding on to those two numbers, but by doing so you may be letting other numbers fluctuate dramatically.  Specifically, your future service levels, fill rates, and operating costs could all be resetting out of sight while you fixate on holding onto yesterday’s ROP and OQ.  When the policy was originally determined, demand was stable and lead times were predictable, yielding service levels of 99% on an important item.   But now demand is increasing and lead times are longer.  Are you really going to expect the same outcome (99% service level) using the same sets of inputs now that demand and lead times are so different?  Of course not.  Suppose you knew that given the recent changes in demand and lead time, in order to achieve the same service level target of 99%, you had to increase the ROP to 35 units.  If you were to keep the ROP at 25 units your service level would fall to 92%.  Is it better to know this in advance or to be forced to react when you are facing stockouts?

What inventory optimization and planning software does is make visible the connections between performance metrics like service rate and control parameters like ROP and ROQ. The invisible becomes visible, allowing you to make reasoned adjustments that keep your metrics where you need them to be by adjusting the control levers available for your use.  Using probabilistic forecasting methods will enable you to generate Key Performance Predictions (KPPs) of performance and costs while identifying near-term corrective actions such as targeted stock movements that help avoid problems and take advantage of opportunities. Not doing so puts your supply chain planning in a straightjacket, much like the quarterback who refuses to audible.

Admittedly, a constantly-changing business environment requires constant vigilance and occasional reaction. But the right inventory optimization and demand forecasting software can recompute your control parameters at scale with a few mouse clicks and clue your ERP system how to keep everything on course despite the constant turbulence.  The noise is already in your system in the form of demand and supply variability.  Will you proactively audible or stick to an older plan and cross your fingers that things will work out fine?


Leave a Comment
Related Posts
Protect your Demand Planning Process from Regime Change

Protect your Demand Planning Process from Regime Change

No, not that kind of regime change: Nothing here about cruise missiles and stealth bombers. And no, we’re not talking about the other kind of regime change that hits closer to home: Shuffling the C-Suite at your company. In this blog, we discuss the relevance of regime change on time series data used for demand planning and forecasting.

How to Tell You Don’t Really Have an Inventory Planning and Forecasting Policy

How to Tell You Don’t Really Have an Inventory Planning and Forecasting Policy

You can’t properly manage your inventory levels, let alone optimize them, if you don’t have a handle on exactly how demand forecasts and stocking parameters (such as Min/Max, safety stocks, and reorder points, and order quantities) are determined. Many organizations cannot specify how policy inputs are calculated or identify situations calling for management overrides to the policy. If you have these problems, you may be wasting hundreds of thousands to millions of dollars each year in unnecessary shortage costs, holding costs, and ordering costs.

Infrequent Updates to Inventory Planning Parameters Costs Time, Money, and Hurts Service

Infrequent Updates to Inventory Planning Parameters Costs Time, Money, and Hurts Service

Inventory planning parameters such as safety stock levels, reorder points, Min/Max settings, lead times, order quantities, and DDMRP buffers directly impact inventory spending and ability to meet customer demand. Ensuring that these inputs are optimized regularly will dramatically improve customer service levels and will reduce the amount of unnecessary inventory spending.
Smart Software and Arizona Public Service to Present at WERC 2022

Smart Software CEO and APS Inventory & Logistics Manager to present WERC 2022 Studio Session on implementing Smart IP&O in 90 Days and achieving significant savings by optimizing reorder points and order quantities for over 250,000 spare parts.

Belmont, MA, – Smart Software, Inc., provider of industry-leading demand forecasting, planning, and inventory optimization solutions, today announced that it will present at WERC 2022.

Justin Danielson, Inventory & Logistics Manager at Arizona Public Service (APS), and Greg Hartunian, CEO at Smart Software, will lead a 30-minute studio session at WERC 2022. The presentation will focus on how APS implemented Smart Inventory Planning and Optimization (Smart IP&O) as part of the company’s strategic supply chain optimization initiative. Smart IP&O was implemented in just 90 days, enabling APS to optimize its reorder points and order quantities for over 250,000 spare parts. During the first phase of the implementation, the platform helped APS reduce inventory and achieve significant savings while maintaining service levels. Finally, the session will conclude by showing Smart IP&O in a Live Demo.


Warehousing Education and Research Council (WERC)

WERC is a professional organization focused on logistics management and its role in the supply chain. Since being founded in 1977, WERC has maintained a strategic vision to continuously offer resources that help distribution practitioners and suppliers stay on top in our dynamic, variable field. In an increasingly complex world, distribution logistics professionals make sense of things so that people get their products and services, companies deliver on their commitments, economies grow, and communities thrive.

WERC powers distribution logistics professionals to do their jobs, excel in their careers and make a difference in the world. WERC helps its members and companies succeed by creating unparalleled learning experiences, offering quality networking opportunities, and accessing research-driven industry information.


About Smart Software, Inc.
Founded in 1981, Smart Software, Inc. is a leader in providing businesses with enterprise-wide demand forecasting, planning and inventory optimization solutions.  Smart Software’s demand forecasting and inventory optimization solutions have helped thousands of users worldwide, including customers at mid-market enterprises and Fortune 500 companies, such as Disney, Arizona Public Service, and Ameren.  Smart Inventory Planning & Optimization gives demand planners the tools to handle sales seasonality, promotions, new and aging products, multi-dimensional hierarchies, and intermittently demanded service parts and capital goods items.  It also provides inventory managers with accurate estimates of the optimal inventory and safety stock required to meet future orders and achieve desired service levels.  Smart Software is headquartered in Belmont,


For more information, please contact Smart Software, Inc., Four Hill Road, Belmont, MA 02478.
Phone: 1-800-SMART-99 (800-762-7899); FAX: 1-617-489-2748; E-mail: info@smartcorp.com


Thoughts on Spare Parts Planning for Public Transit

The Covid19 pandemic has placed unusual stress on public transit agencies. This stress forces agencies to look again at their spare parts planning processes, which is a key driver up ensuring uptime and balancing service parts inventory costs.

This blog focuses on bus systems and their practices for spare parts management and planning. However, there are lessons here for other types of public transit, including rail and light rail.

Back in 1995, the Transportation Research Board (TRB) of the National Research Council published a report that still has relevance. System-Specific Spare Bus Ratios: A Synthesis of Transit Practice stated

The purpose of this study was to document and examine the critical site-specific variables that affect the number of spare vehicles that bus systems need to maintain maximum service requirements. … Although transit managers generally acknowledged that right-sizing the fleet actually improves operations and lowers cost, many reported difficulties in achieving and consistently maintaining a 20 percent spare ratio as recommended by FTA… The respondents to the survey advocated that more emphasis be placed on developing improved and innovative bus maintenance techniques, which would assist them in minimizing downtime and improving vehicle availability, ultimately leading to reduced spare vehicles and labor and material costs.

Grossly simplified guidelines like “keep 20% spare buses” are easy to understand and measure but grossly mask more detailed tactics that can provide more tailored policies that better steward taxpayer dollars spent on spare parts while ensuring the highest levels of availability. If operational reliability can be improved for each bus, then fewer spares are needed.

One way to keep each bus up and running more often is to improve the management of inventories of spare parts – specifically by forecasting service parts usage and the required replenishment policies more accurately. Here is where modern supply chain management can make a significant contribution. The TRB noted this in their report:

Many agencies have been successful in limiting reliance on excess spare vehicles. Those transit officials agree that several factors and initiatives have led to their success and are critical to the success of any program [including] … Effective use of advanced technology to manage critical maintenance functions, including the orderly and timely replacement of parts… Failure to have available service parts and other components when they are needed will adversely affect any maintenance program.

As long as managers are cognizant of the issues and vigilant about what tools are available to them, the probability of buses [being] ‘out for no stock’ will greatly diminish.”

Effective spare parts inventory management requires a balance between “having enough” and “having too much.” What modern service parts planning software can do is make visible the tradeoff between these two goals so that transit managers can make fact-based decisions about spare parts inventories.

There are enough complications in finding the right balance to require moving beyond simple rules of thumb such as “keep ten days’ worth of demand on hand” or “reorder when you are down to five units in stock.” Factors that drive these decisions include both the average demand for a part, the volatility of that demand, the average replenishment lead time (which can be a problem when the part arrives by slow boat from Germany), the variability in lead time, and several cost factors: holding costs, ordering costs, and shortage costs (e.g., lost fares, loss of public goodwill).

Innovative supply chain analytics and spare parts planning software uses advanced probabilistic forecasting and stochastic optimization methods to manage these complexities and provide greater parts availability at lower cost. For instance, Minnesota’s Metro Transit documented a 4x increase in return on investment in the first six months of implementing a new system. To read more about how public transit agencies are exploiting innovative supply chain analytics, see:


Leave a Comment
Related Posts
Protect your Demand Planning Process from Regime Change

Protect your Demand Planning Process from Regime Change

No, not that kind of regime change: Nothing here about cruise missiles and stealth bombers. And no, we’re not talking about the other kind of regime change that hits closer to home: Shuffling the C-Suite at your company. In this blog, we discuss the relevance of regime change on time series data used for demand planning and forecasting.

How to Tell You Don’t Really Have an Inventory Planning and Forecasting Policy

How to Tell You Don’t Really Have an Inventory Planning and Forecasting Policy

You can’t properly manage your inventory levels, let alone optimize them, if you don’t have a handle on exactly how demand forecasts and stocking parameters (such as Min/Max, safety stocks, and reorder points, and order quantities) are determined. Many organizations cannot specify how policy inputs are calculated or identify situations calling for management overrides to the policy. If you have these problems, you may be wasting hundreds of thousands to millions of dollars each year in unnecessary shortage costs, holding costs, and ordering costs.

Infrequent Updates to Inventory Planning Parameters Costs Time, Money, and Hurts Service

Infrequent Updates to Inventory Planning Parameters Costs Time, Money, and Hurts Service

Inventory planning parameters such as safety stock levels, reorder points, Min/Max settings, lead times, order quantities, and DDMRP buffers directly impact inventory spending and ability to meet customer demand. Ensuring that these inputs are optimized regularly will dramatically improve customer service levels and will reduce the amount of unnecessary inventory spending.
Smart Software VP of Research to Present at Business Analytics Conference, INFORMS 2022

Dr. Tom Willemain to lead INFORMS sessionDominating The Inventory Battlefield: Fighting Randomness With Randomness.”

Belmont, Mass., March 2022 – Smart Software, Inc., provider of industry-leading demand forecasting, planning, and inventory optimization solutions, today announced that Tom Willemain, Vice President for Research, will present at the INFORMS Business Analytics Conference, April 3-5, 2022, in Houston, TX.

Dr. Willemain will present a session on how next-generation analytics arms supply chain leaders in manufacturing, distribution, and MRO with tools to fight against randomness in demand and supply. During his session he will detail the following technologies:

(1) Regime change filtering to maintain data relevance against sudden shifts in the operating environment.

(2) Bootstrapping methods to generate large numbers of realistic demand and lead time scenarios to fuel models.

(3) Discrete event simulations to process the input scenarios and expose the links between management actions and key performance indicators.

(4) Stochastic optimization based on simulation experiments to tune each item for best results.

Without the analytics, inventory owners have two choices: sticking with rigid operating policies usually based on outdated and invalid rules of thumb or resorting to subjective, gut-feel guesswork that may not help and does not scale.

As the leading Business Analytics Conference, INFORMS provides the opportunity to interact with the world’s top forecasting researchers and practitioners. The attendance is large enough so that the best in the field are attracted, yet small enough that you can meet and discuss one-on-one. In addition, the conference features content from leading analytics professionals who share and showcase top analytics applications that save lives, save money, and solve problems.


About Dr. Thomas Willemain

Dr. Thomas Reed Willemain served as an Expert Statistical Consultant to the National Security Agency (NSA) at Ft. Meade, MD, and as a member of the Adjunct Research Staff at an affiliated think-tank, the Institute for Defense Analyses Center for Computing Sciences (IDA/CCS). He is Professor Emeritus of Industrial and Systems Engineering at Rensselaer Polytechnic Institute, having previously held faculty positions at Harvard’s Kennedy School of Government and Massachusetts Institute of Technology. He is also co-founder and Senior Vice President/Research at Smart Software, Inc. He is a member of the Association of Former Intelligence Officers, the Military Operations Research Society, the American Statistical Association, and several other professional organizations. Willemain received the BSE degree (summa cum laude, Phi Beta Kappa) from Princeton University and the MS and Ph.D. degrees from Massachusetts Institute of Technology. His other books include: Statistical Methods for Planners, Emergency Medical Systems Analysis (with R. C. Larson), and 80 articles in peer-reviewed journals on statistics, operations research, health care, and other topics. For more information, email: TomW@SmartCorp.com or visit www.TomWillemain.com.


About Smart Software, Inc.

Founded in 1981, Smart Software, Inc. is a leader in providing businesses with enterprise-wide demand forecasting, planning, and inventory optimization solutions.  Smart Software’s demand forecasting and inventory optimization solutions have helped thousands of users worldwide, including customers at mid-market enterprises and Fortune 500 companies, such as Disney, Arizona Public Service, and Ameren.  Smart Inventory Planning & Optimization gives demand planners the tools to handle sales seasonality, promotions, new and aging products, multi-dimensional hierarchies, and intermittently demanded service parts and capital goods items.  It also provides inventory managers with accurate estimates of the optimal inventory and safety stock required to meet future orders and achieve desired service levels.  Smart Software is headquartered in Belmont, Massachusetts, and can be found on the World Wide Web at www.smartcorp.com.


SmartForecasts and Smart IP&O have registered trademarks of Smart Software, Inc.  All other trademarks are their respective owners’ property.

For more information, please contact Smart Software, Inc., Four Hill Road, Belmont, MA 02478.
Phone: 1-800-SMART-99 (800-762-7899); FAX: 1-617-489-2748; E-mail: info@smartcorp.com