How to Forecast Inventory Requirements

Forecasting inventory requirements is a specialized variant of forecasting that focuses on the high end of the range of possible future demand.

For simplicity, consider the problem of forecasting inventory requirements for just one period ahead, say one day ahead. Usually, the forecasting job is to estimate the most likely or average level of product demand. However, if available inventory equals the average demand, there is about a 50% chance that demand will exceed inventory and result in lost sales and/or lost good will. Setting the inventory level at, say, ten times the average demand will probably eliminate the problem of stockouts, but will just as surely result in bloated inventory costs.

The trick of inventory optimization is to find a satisfactory balance between having enough inventory to meet most demand without tying up too many resources in the process. Usually, the solution is a blend of business judgment and statistics. The judgmental part is to define an acceptable inventory service level, such as meeting 95% of demand immediately from stock. The statistical part is to estimate the 95th percentile of demand.

When not dealing with intermittent demand, you can often estimate the required inventory level by assuming a bell-shaped (Normal) curve of demand, estimating both the middle and the width of the bell curve, then using a standard statistical formula to estimate the desired percentile. The difference between the desired inventory level and the average level of demand is called the “safety stock” because it protects against the possibility of stockouts.

When dealing with intermittent demand, the bell-shaped curve is a very poor approximation to the statistical distribution of demand. In this special case, Smart leverages patented technology for intermittent demand that is designed to accurately forecast the ranges and produce a better estimate of the safety stock needed to achieve the required inventory service level.


Everybody forecasts to drive inventory planning. It’s just a question of how.

Reveal how forecasts are used with these 4 questions.

Often companies will insist that they “don’t use forecasts” to plan inventory.  They often use reorder point methods and are struggling to improve on-time delivery, inventory turns, and other KPIs. While they don’t think of what they are doing as explicitly forecasting, they certainly use estimates of future demand to develop reorder points such as min/max.

Regardless of what it is called, everyone tries to estimate future demand in some way and uses this estimate to set stocking policies and drive orders. To improve inventory planning and make sure you aren’t over/under ordering and creating large stockouts and inventory bloat, it is important to understand exactly how your organization uses forecasts. Once this is understood, you can assess whether the quality of the forecasts can be improved.

Try getting answers to the following questions. It will reveal how forecasts are being used in your business – even if you don’t think you use forecasts.

1.  Is your forecast a period-by-period estimate over time that is used to predict what on-hand inventory will be in the future and triggers order suggestions in your ERP system?

2. Or is your forecast used to derive a reorder point but not explicitly used as a per-period driver to trigger orders? Here, I may predict we’ll sell 10 per week based on the history, but we are not loading 10, 10, 10, 10, etc., into the ERP. Instead, I derive a reorder point or Min that covers the two-period lead time + some amount of buffer to help protect against stock out. In this case, I’ll order more when on hand gets to 25.

3. Is your forecast used as a guide for the planner to help subjectively determine when they should order more?  Here, I predict 10 per week, and I assess the on-hand inventory periodically, review the expected lead time, and I decide, given the 40 units I have on hand today, that I have “enough.” So, I do nothing now but will check back again in a week.

4. Is it used to set up blanket orders with suppliers? Here, I predict 10 per week and agree to a blanket purchase order with the supplier of 520 per year. The orders are then placed in advance to arrive in quantities of 10 once per week until the blanket order is consumed.

Once you get the answers, you can then ask how the estimates of demand are created.  Is it an average? Is it deriving demand over lead time from a sales forecast?  Is there a statistical forecast generated somewhere?  What methods are considered? It will also be important to assess how safety stocks are used to protect against demand and supply variability.  More on all of this in a future article.


What Silicon Valley Bank Can Learn from Supply Chain Planning

​If you had your head up lately, you may have noticed some additional madness off the basketball court: The failure of Silicon Valley Bank. Those of us in the supply chain world may have dismissed the bank failure as somebody else’s problem, but that sorry episode holds a big lesson for us, too: The importance of stress testing done right.

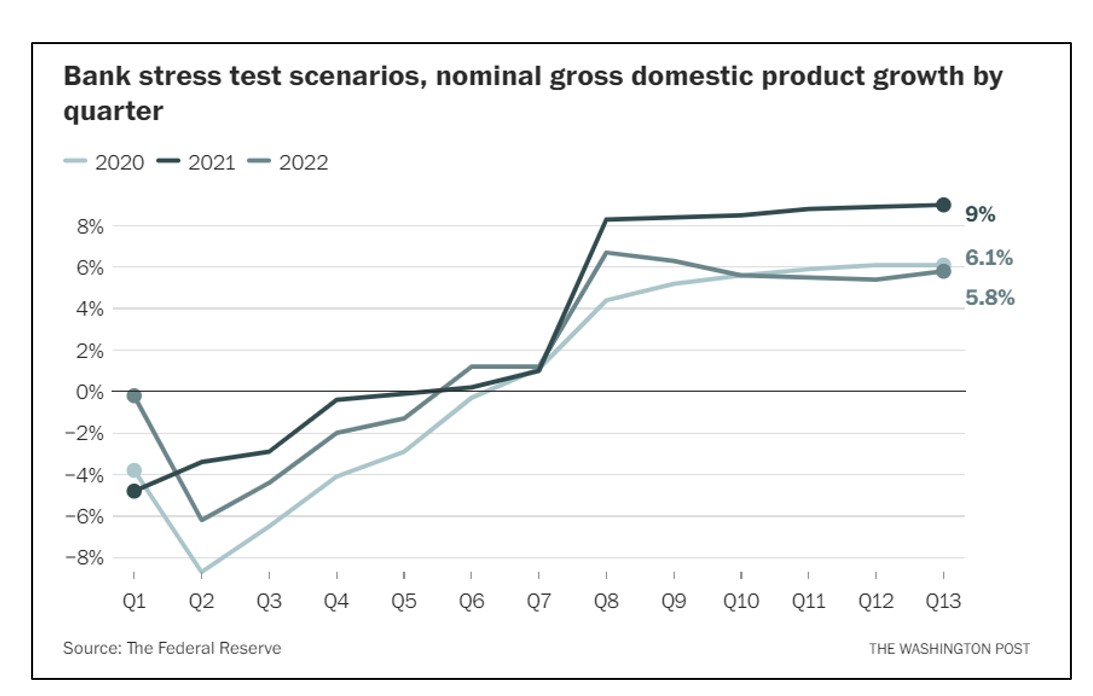
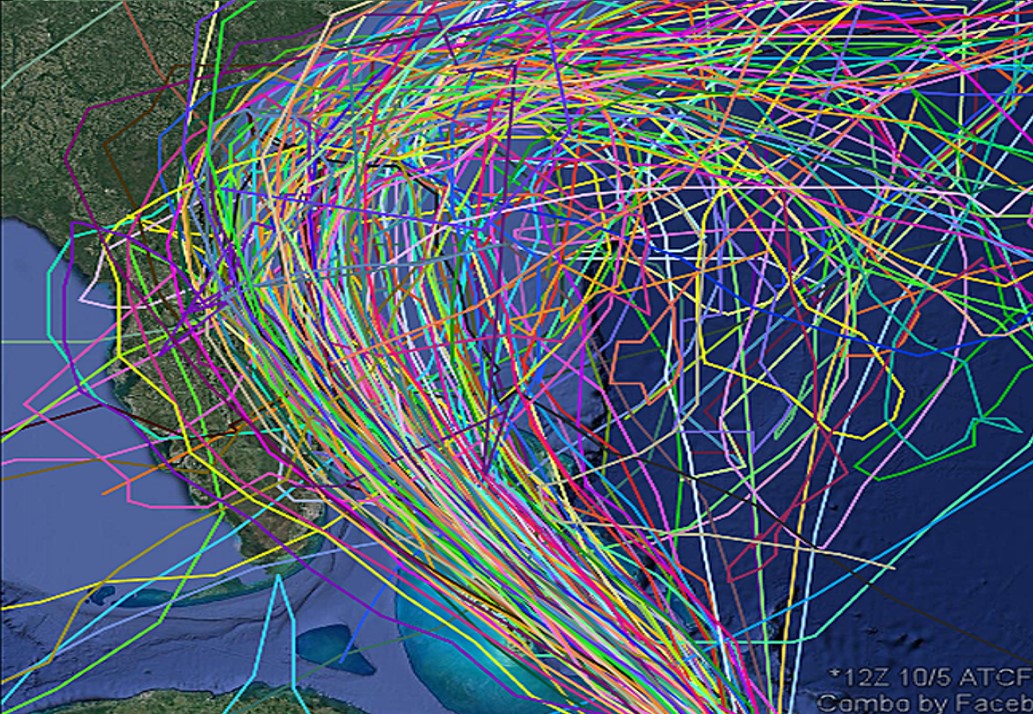
The Washington Post recently carried an opinion piece by Natasha Sarin called “Regulators missed Silicon Valley Bank’s problems for months. Here’s why.” Sarin outlined the flaws in the stress testing regime imposed on the bank by the Federal Reserve. One problem is that the stress tests are too static. The Fed’s stress factor for nominal GDP growth was a single scenario listing presumed values over the next 13 quarters (see Figure 1). Those 13 quarterly projections might be somebody’s consensus view of what a bad hair day would look like, but that’s not the only way things could play out.  As a society, we are being taught to appreciate a better way to display contingencies every time the National Weather Service shows us projected hurricane tracks (see Figure 2). Each scenario represented by a different colored line shows a possible storm path, with the concentrated lines representing the most likely.  By exposing the lower probability paths, risk planning is improved.

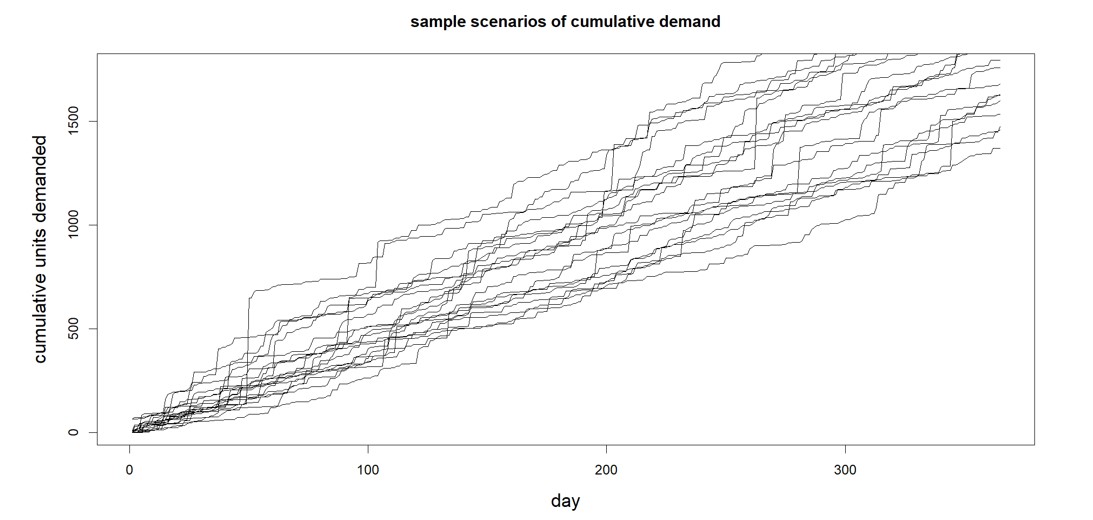
When stress testing the supply chain, we need realistic scenarios of possible future demands that might occur, even extreme demands.   Smart provides this in our software (with considerable improvements in our Gen2 methods).  The software generates a huge number of credible demand scenarios, enough to expose the full scope of risks (see Figure 3). Stress testing is all about generating massive numbers of planning scenarios, and Smart’s probabilistic methods are a radical departure from previous deterministic S&OP applications, being entirely scenario based.

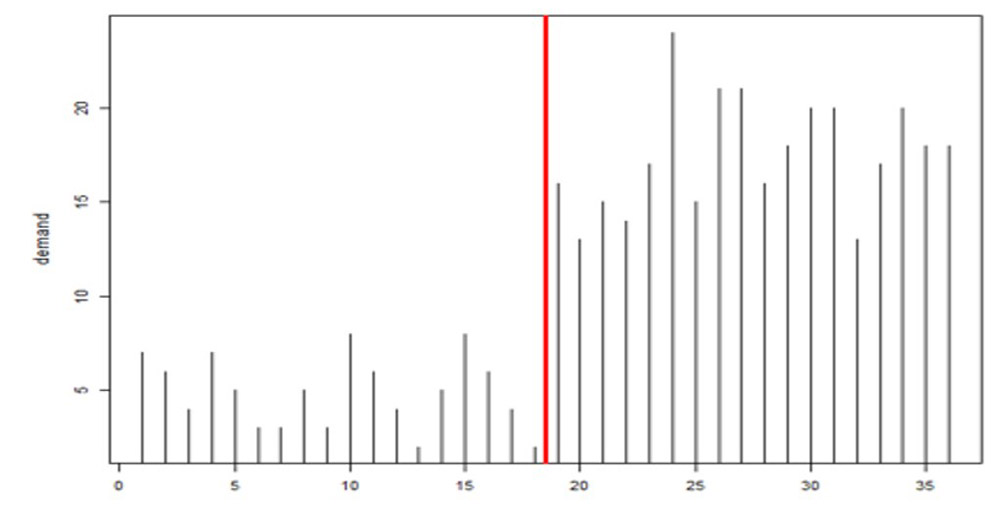
The other flaw in the Fed’s stress tests was that they were designed months in advance but never updated for changing conditions.  Demand planners and inventory managers intuitively appreciate that key variables like item demand and supplier lead time are not only highly random even when things are stable but also subject to abrupt shifts that should require rapid rewriting of planning scenarios (see Figure 4, where the average demand jumps up dramatically between observations 19 and 20). Smart’s Gen2 products include new tech for detecting such “regime changes”  and automatically changing scenarios accordingly.

Banks are forced to undergo stress tests, however flawed they may be, to protect their depositors. Supply chain professionals now have a way to protect their supply chains by using modern software to stress test their demand plans and inventory management decisions.

1 Scenarios used the Fed to stress test banks Software

Figure 1: Scenarios used the Fed to stress test banks.


2 Scenarios used by the National Weather Service to predict hurricane tracks

Figure 2: Scenarios used by the National Weather Service to predict hurricane tracks


3 Demand scenarios of the type generated by Smart Demand Planner

Figure 3: Demand scenarios of the type generated by Smart Demand Planner


4 Example of regime change in product demand after observation #19

Figure 4: Example of regime change in product demand after observation #19


Supply Chain Math: Don’t Bring a Knife to a Gunfight

Whether you understand it in detail yourself or rely on trustworthy software, math is a fact of life for anyone in inventory management and demand forecasting who is hoping to remain competitive in the modern world.

At a conference recently, the lead presenter in an inventory management workshop proudly proclaimed that he had no need for “high-fallutin’ math”, which was explained to mean anything beyond sixth-grade math.

Math is not everyone’s first love. But if you really care about doing your job well, you can’t approach the work with a grade school mentality. Supply chain tasks like demand forecasting and inventory management are inherently mathematical. The blog associated with edX, a premier site for online college course material, has a great post on this topic, at https://www.mooc.org/blog/how-is-math-used-in-supply-chain. Let me quote the first bit:

Math and the supply chain go hand and hand. As supply chains grow, increasing complexity will drive companies to look for ways to manage large-scale decision-making. They can’t go back to how supply chains were 100 years ago—or even two years ago before the pandemic. Instead, new technologies will help streamline and manage the many moving parts. The logistics skills, optimization technologies, and organizational skills used in supply chain all require mathematics.

Our customers don’t need to be experts in supply chain math, they just need to be able to wield the software that contains the math. Software combines users’ experience and subject matter expertise to produce results that make the difference between success and failure. To do its job, the software can’t stop at sixth-grade math; it needs probability, statistics, and optimization theory.

It’s up to us software vendors to package the math in such a way that what goes into the calculations is all that is relevant, even if complicated; and that what comes out is clear, decision-relevant, and defensible when you must justify your recommendations to higher management.

Sixth-grade math can’t warn you when the way you propose to manage a critical spare part will mean a 70% chance of falling short of your item availability target. It can’t tell you how best to adjust your reorder points when a supplier calls and says, “We have a delivery problem.” It can’t save your skin when there is a surprisingly large order and you have to quickly figure out the best way to set up some expedited special orders without busting the operating budget.

So, respect the folk wisdom and don’t bring a knife to a gunfight.


Managing Inventory amid Regime Change

​If you hear the phrase “regime change” on the news, you immediately think of some fraught geopolitical event. Statisticians use the phrase differently, in a way that has high relevance for demand planning and inventory optimization. This blog is about “regime change” in the statistical sense, meaning a major change in the character of the demand for an inventory item.

An item’s demand history is the fuel that powers demand planners’ forecasting machines. In general, the more fuel the better, giving us a better fix on the average level, the volatility, the size and frequency of any spikes, the shape of any seasonality pattern, and the size and direction of any trend.

But there is one big exception to the rule that “more data is better data.” If there is a major shift in your world and new demand doesn’t look like old demand, then old data become dangerous.

Modern software can make accurate forecasts of item demand and suggest wise choices for inventory parameters like reorder points and order quantities. But the validity of these calculations depends on the relevance of the data used in their calculation. Old data from an old regime no longer reflect current reality, so including them in calculations creates forecast error for demand planners and either excess stock or unacceptable stockout rates for inventory planners.

That said, if you were to endure a recent regime change and throw out the obsolete data, you would have a lot less data to work with. This has its own costs, because all the estimates computed from the data would have greater statistical uncertainty even though they would be less biased. In this case, your calculations would have to rely more heavily on a blend of statistical analysis and your own expert judgement.

At this point, you may ask “How can I know if and when there has been a regime change?” If you’ve been on the job for a while and are comfortable looking at timeplots of item demand, you will generally recognize regime change when you see it, at least if it’s not too subtle. Figure 1 shows some real-world examples that are obvious.

Figure 1 Four examples of regime change in real-world item demand

Figure 1: Four examples of regime change in real-world item demand


Unfortunately, less obvious changes can still have significant effects. Moreover, most of our customers are too busy to manually review all the items they manage even once per quarter. When you get beyond, say, 100 items, the task of eyeballing all those time series becomes onerous. Fortunately, software can do a good job of continuously monitoring demand for tens of thousands of items and alerting you to any items that may need your attention. Then too, you can arrange for the software to not only detect regime change but also automatically exclude from its calculations all data collected before the most recent regime change, if any. In other words, you can get both automatic warning of regime change and automatic protection from regime change.

For more on the basics of regime change, see our previous blog on the topic: https://smartcorp.com/blog/demandplanningregimechange/  


An Example with Numbers in It

If you would like to learn more, read on to see a numerical example of how much regime change can alter the calculation of a reorder point for a critical spare part. Here is a scenario to illustrate the point.

Scenario

  • Goal: calculate the reorder point needed to control the risk of stockout while waiting for replenishment. Assume the target stockout risk is 5%.
  • Assume the item has intermittent daily demand, with many days of zero demand.
  • Assume daily demand has a Poisson distribution with an average of 1.0 units per day.
  • Assume the replenishment lead time is always 30 days.
  • The lead time demand will be random, so it will have a probability distribution and the reorder point will be the 95th percentile of the distribution.
  • Assume the effect of regime change is to either raise or lower the mean daily demand.
  • Assume there is one year of daily data available for estimating the mean daily unit demand.


Figure 2 Example of change in mean demand and sample of random daily demand

Figure 2 Example of change in mean demand and sample of random daily demand


Figure 2 shows one form of this scenario. The top panel shows that the average daily demand increases from 1.0 to 1.5 after 270 days. The bottom panel shows one way that a year’s worth of daily demand might appear. (At this point, you may be feeling that calculating all this stuff is complicated, even for what turns out to be a simplified scenario. That is why we have software!)

Analysis

Successful calculation of the proper reorder point will depend on when regime change happens and how big a change occurs. We simulated regime changes of various sizes at various times within a 365 day period. Around a base demand of 1.0 units per day, we studied shifts in demand (“shift”) of ±25% and ±50% as well as a no change reference case. We located the time of the change (“t.break”) at 90, 180, and 270 days. In each case, we computed two estimates of the reorder point: The “ideal” value given perfect knowledge of the average demand in the new regime (“ROP.true”), and the estimated value of mean demand computed by ignoring the regime change and using all the demand data for the past year (“ROP.all”).

Table 1 shows the estimates of the reorder point computed over 100 simulations. The center block is the reference case, in which there is no change in the daily demand, which remains fixed at 1 unit per day. The colored block at the bottom is the most extreme increasing scenario, with demand increasing to 1.5 units/day either one-third, one-half, or two-thirds of the way through the year.

We can draw several conclusions from these simulations.

ROP.true: The correct choice for reorder point increases or decreases according to the change in mean demand after the regime change. The relationship is not a simple linear one: the table spans a 600% range of demand levels (0.25 to 1.50) but a 467% range of reorder points (from 12 to 56).

ROP.all: Ignoring the regime change can lead to gross overestimates of the reorder point when demand drops and gross underestimates when demand increases.  As we would expect, the later the regime change, the worse the error. For example, if demand increases from 1.0 to 1.5 units per day two-thirds of the way through the year without being noticed, the calculated reorder point of 43 units would fall 13 units short of where it should be.

A word of caution: Table 1 shows that basing the calculations of reorder points using only data from after a regime change will usually get the right answer. What it doesn’t show is that the estimates can be unstable if there is very little demand history after the change. Therefore, in practice, you should wait to react to the regime change until a decent number of observations have accumulated in the new regime. This might mean using all the demand history, both pre- and post-change, until, say, 60 or 90 days of history have accumulated before ignoring pre-change data.


Table 1 Correct and Estimated Reorder Points for different regime change scenarios

Table 1 Correct and Estimated Reorder Points for different regime change scenarios