Beyond the forecast – Collaboration and Consensus Planning

5 Steps to Consensus Demand Planning

The whole point of demand forecasting is to establish the best possible view of future demand.  This requires that we draw upon the best data and inputs we can get, leverage statistics to capture underlying patterns, put our heads together to apply overrides based on business knowledge, and agree on a consensus demand plan that serves as cornerstone to the company’s overall demand plan.

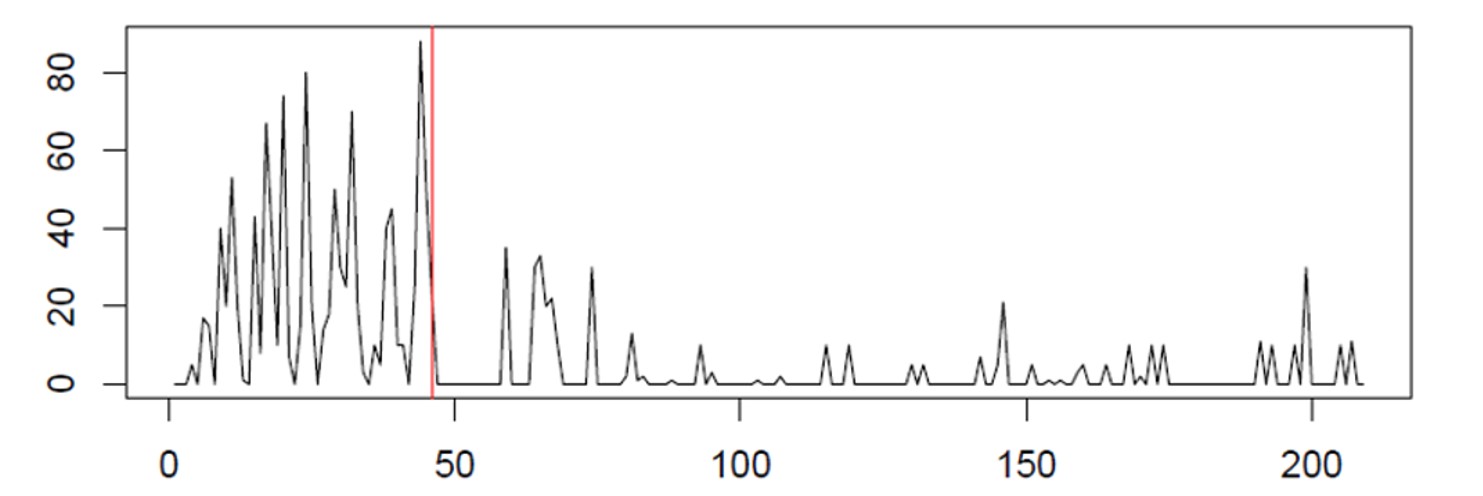
Step 1: Develop an accurate demand signal.   What constitutes demand?  Consider how  your organization defines demand – say, confirmed sales orders net of cancellations or shipment data adjusted to remove the impact of historical stockouts  – and use this consistently.  This is your measure of what the market is requesting you to deliver.  Don’t confuse this with your ability to deliver – that should be reflected in the revenue plan.

Step 2: Generate a statistical forecast.  Plan for thousands of items, using a proven forecasting application that automatically pulls in your data and reliably produces accurate forecasts for all of your items.  Review the first pass of your forecast, then make adjustments.  A strike or train wreck may have interrupted shipping last month – don’t let that wag your forecast.  Adjust for these and reforecast.  Do the best you can, then invite others to weigh in.

Step 3: Bring on the experts.  Product line managers, sales leaders, key distribution partners know their markets.  Share your forecast with them.  Smart uses the concept of a “Snapshot” to share a facsimile of your forecast – at any level, for any product line – with people who may know better.  There could be an enormous order that hasn’t hit the pipeline, or a channel partner is about to run their annual promotion.  Give them an easy way to take their portion of the forecast and change it.  Drag this month up, that one down …

Step 4:  Measure Accuracy and Forecast Value Add.  Some of your contributors may be right on the money, other tend to be biased high or low.  Use forecast vs. actuals reporting and measure forecast value add analysis to measure forecast errors and whether changes to the forecast are hurting or helping.  By informing the process with this information, your company will improve it’s ability to forecast more accurately.

Step 5: Agree on the Consensus Forecast.  You can do this one product line or geography at a time, or business by  business.  Convene the team, graphically stack up their inputs, review past accuracy performance, discuss their reasons for increasing or reducing the forecast, and agree on whose inputs to use.  This becomes your consensus plan.  Finalize the plan and send it off – upload forecasts to MRP, send to finance and manufacturing.  You have just kicked off your Sales, Inventory and Operational Planning process.

You can do this.  And we can help.  If you have any questions about collaborative demand planning please reply to this blog, we will follow up.


5 Tips for Creating Smart Forecasts

In Smart Software’s forty-plus years of providing forecasting software, we’ve met many people who find themselves, perhaps surprisingly, becoming demand forecasters. This blog is aimed primarily at those fortunate individuals who are about to start this adventure (though seasoned pros may enjoy the refresher).

Welcome to the field! Good forecasting can make a big difference to your company’s performance, whether you are forecasting to support sales, marketing, production, inventory, or finance.

There is a lot of math and statistics underlying demand forecasting methods, so your assignment suggests that you are not one of those math-phobic people who would rather be poets. Luckily, if you are feeling a bit shaky and not yet healed from your high school geometry class, a lot of the math is built into forecasting software, so your first job is to leave the math for later while you get a view of the big picture. It is indeed a big picture, but let’s isolate few of the ideas that will most help you succeed.


  1. Demand Forecasting is a team sport. Even in a small company, the demand planner is part of a team, with some folks bringing the data, some bringing the tech, and some bringing the business judgment. In a well-run business, your job will never be to simply feed some data into a program and send out a forecast report. Many companies have adopted a process called Sales and Operations Planning (S&OP) in which your forecast will be used to kick off a meeting to make certain judgments (e.g., Should we assume this trend will continue? Will it be worse to under-forecast or over-forecast?) and to blend extra information into the final forecast (e.g., sales force input, business intelligence on competitors’ moves, promotions). The implication for you is that your skills at listening and communicating will be important to your success.


  1. Statistical Forecasting engines need good fuel. Historical data is the fuel used by statistical forecasting programs, so bad or missing or delayed data can degrade your work product. Your job will implicitly include a quality control aspect, and you must keep a keen eye on the data that are supplied to you. Along the way, it is a good idea to make the IT people your friends.


  1. Your name is on your forecasts. Like it or not, if I send forecasts up the chain of command, they get labeled as “Tom’s forecasts.” I must be prepared to own those numbers. To earn my seat at the table, I must be able to explain what data my forecasts were based on, how they were calculated, why I used Method A instead of Method B to do the calculations, and especially how firm or squishy they are. Here honesty is important. No forecast can reasonably be expected to be perfectly accurate, but not all managers can be expected to be perfectly reasonable. If you’re unlucky, your management will think that your reports of forecast uncertainty suggest either ignorance or incompetence. In truth, they indicate professionalism. I have no useful advice about how best to manage such managers, but I can warn you about them. It’s up to you to educate those who use your forecasts. The best managers will appreciate that.


  1. Leave your spreadsheets behind. It’s not uncommon for someone to be promoted to forecaster because they were great with Excel. Unless you are with an unusually small company, the scale of modern corporate forecasting overwhelms what you can handle with spreadsheets. The increasing speed of business compounds the problem: the sleepy tempo of annual and quarterly planning meetings is rapidly giving way to weekly or even daily re-forecasts as conditions change. So, be prepared to lean on a professional vendor of modern, scalable cloud-based demand planning and statistical forecasting software for training and support.


  1. Think visually. It will be very useful, both in deciding how to generate demand forecasts and in presenting them to management, so take advantage of the visualization capabilities built into forecasting software. As I noted above, in today’s high-frequency business world, the data you work with can change rapidly, so what you did last month may not be the right thing to do this month. Literally keep an eye on your data by making simple plots, like “timeplots” that show things like trend or seasonality or (especially) changes in trend or seasonality or anomalies that must be dealt with. Similarly, supplementing tables of forecasts with graphs comparing current forecasts to prior forecasts to actuals can be very helpful in an S&OP process. For example, timeplots showing past values, forecasted values, and “forecast intervals” indicating the objective uncertainty in the forecasts provide a solid basis for your team to fully appreciate the message in your forecasts.


That’s enough for now. As a person who’s taught in universities for half a century, I’m inclined to start into the statistical side of forecasting, but I’ll save that for another time. The five tips above should be helpful to you as you grow into a key part of your corporate planning team. Welcome to the game!


Supply Chain Math: Don’t Bring a Knife to a Gunfight

Whether you understand it in detail yourself or rely on trustworthy software, math is a fact of life for anyone in inventory management and demand forecasting who is hoping to remain competitive in the modern world.

At a conference recently, the lead presenter in an inventory management workshop proudly proclaimed that he had no need for “high-fallutin’ math”, which was explained to mean anything beyond sixth-grade math.

Math is not everyone’s first love. But if you really care about doing your job well, you can’t approach the work with a grade school mentality. Supply chain tasks like demand forecasting and inventory management are inherently mathematical. The blog associated with edX, a premier site for online college course material, has a great post on this topic, at https://www.mooc.org/blog/how-is-math-used-in-supply-chain. Let me quote the first bit:

Math and the supply chain go hand and hand. As supply chains grow, increasing complexity will drive companies to look for ways to manage large-scale decision-making. They can’t go back to how supply chains were 100 years ago—or even two years ago before the pandemic. Instead, new technologies will help streamline and manage the many moving parts. The logistics skills, optimization technologies, and organizational skills used in supply chain all require mathematics.

Our customers don’t need to be experts in supply chain math, they just need to be able to wield the software that contains the math. Software combines users’ experience and subject matter expertise to produce results that make the difference between success and failure. To do its job, the software can’t stop at sixth-grade math; it needs probability, statistics, and optimization theory.

It’s up to us software vendors to package the math in such a way that what goes into the calculations is all that is relevant, even if complicated; and that what comes out is clear, decision-relevant, and defensible when you must justify your recommendations to higher management.

Sixth-grade math can’t warn you when the way you propose to manage a critical spare part will mean a 70% chance of falling short of your item availability target. It can’t tell you how best to adjust your reorder points when a supplier calls and says, “We have a delivery problem.” It can’t save your skin when there is a surprisingly large order and you have to quickly figure out the best way to set up some expedited special orders without busting the operating budget.

So, respect the folk wisdom and don’t bring a knife to a gunfight.


Four Common Mistakes when Planning Replenishment Targets

Whether you are using ‘Min/Max’ or ‘reorder point’ and ‘order quantity’ to determine when and how much to restock, your approach might deliver or deny huge efficiencies. Key mistakes to avoid:


  1. Not recalibrating regularly
  2. Only reviewing Min/Max when there is a problem
  3. Using Forecasting methods not up to the task
  4. Assuming data is too slow moving or unpredictable for it to matter


We have over 150,000 SKU x Location combinations. Our demand is intermittent. Since it’s slow moving, we don’t need to recalculate our reorder points often. We do so maybe once annually but review the reorder points whenever there is a problem.” – Materials Manager.


This reactive approach will lead to millions in excess stock, stock outs, and lots of wasted time reviewing data when “something goes wrong.” Yet, I’ve heard this same refrain from so many inventory professionals over the years. Clearly, we need to do more to share why this thinking is so problematic.

It is true that for many parts, a recalculation of the reorder points with up-to-date historical data and lead times might not change much, especially if patterns such as trend or seasonality aren’t present. However, many parts will benefit from a recalculation, especially if lead times or recent demand has changed. Plus, the likelihood of significant change that necessitates a recalculation increases the longer you wait. Finally, those months with zero demands also influence the probabilities and shouldn’t be ignored outright. The key point though is that it is impossible to know what will change or won’t change in your forecast, so it’s better to recalibrate regularly.


  Planning Replenishment Targets Software calculate

This standout case from real world data illustrates a scenario where regular and automated recalibration shines—the benefits from quick responses to changing demand patterns like these add up quickly. In the above example, the X axis represents days, and the Y axis represents demand. If you were to wait several months between recalibrating your reorder points, you’d undoubtedly order far too soon. By recalibrating your reorder point far more often, you’ll catch the change in demand enabling much more accurate orders.


Rather than wait until you have a problem, recalibrate all parts every planning cycle at least once monthly. Doing so takes advantage of the latest data and proactively adjusts the stocking policy, thus avoiding problems that would cause manual reviews and inventory shortages or excess.

The nature of your (potentially varied) data also needs to be matched with the right forecasting tools. If records for some parts show trend or seasonal patterns, using targeting forecasting methods to accommodate these patterns can make a big difference. Similarly, if the data show frequent zero values (intermittent demand), forecasting methods not built around this special case can easily deliver unreliable results.

Automate, recalibrate and review exceptions. Purpose built software will do this automatically. Think of it another way: is it better to dump a bunch of money into your 401K once per year or “dollar cost average” by depositing smaller, equally sized amounts throughout the year. Recalibrating policies regularly will yield maximized returns over time, just as dollar cost averaging will do for your investment portfolio.

How often do you recalibrate your stocking policies? Why?


Top Five Tips for New Demand Planners and Forecasters

In Smart Software’s forty-plus years of providing forecasting software, we’ve met many people who find themselves, perhaps surprisingly, becoming demand forecasters. This blog is aimed primarily at those fortunate individuals who are about to start this adventure (though seasoned pros may enjoy the refresher).

Welcome to the field! Good forecasting can make a big difference to your company’s performance, whether you are forecasting to support sales, marketing, production, inventory, or finance.

There is a lot of math and statistics underlying demand forecasting methods, so your assignment suggests that you are not one of those math-phobic people who would rather be poets. Luckily, if you are feeling a bit shaky and not yet healed from your high school geometry class, a lot of the math is built into forecasting software, so your first job is to leave the math for later while you get a view of the big picture. It is indeed a big picture, but let’s isolate few of the ideas that will most help you succeed.


  1. Demand Forecasting is a team sport. Even in a small company, the demand planner is part of a team, with some folks bringing the data, some bringing the tech, and some bringing the business judgment. In a well-run business, your job will never be to simply feed some data into a program and send out a forecast report. Many companies have adopted a process called Sales and Operations Planning (S&OP) in which your forecast will be used to kick off a meeting to make certain judgments (e.g., Should we assume this trend will continue? Will it be worse to under-forecast or over-forecast?) and to blend extra information into the final forecast (e.g., sales force input, business intelligence on competitors’ moves, promotions). The implication for you is that your skills at listening and communicating will be important to your success.


  1. Statistical Forecasting engines need good fuel. Historical data is the fuel used by statistical forecasting programs, so bad or missing or delayed data can degrade your work product. Your job will implicitly include a quality control aspect, and you must keep a keen eye on the data that are supplied to you. Along the way, it is a good idea to make the IT people your friends.


  1. Your name is on your forecasts. Like it or not, if I send forecasts up the chain of command, they get labeled as “Tom’s forecasts.” I must be prepared to own those numbers. To earn my seat at the table, I must be able to explain what data my forecasts were based on, how they were calculated, why I used Method A instead of Method B to do the calculations, and especially how firm or squishy they are. Here honesty is important. No forecast can reasonably be expected to be perfectly accurate, but not all managers can be expected to be perfectly reasonable. If you’re unlucky, your management will think that your reports of forecast uncertainty suggest either ignorance or incompetence. In truth, they indicate professionalism. I have no useful advice about how best to manage such managers, but I can warn you about them. It’s up to you to educate those who use your forecasts. The best managers will appreciate that.


  1. Leave your spreadsheets behind. It’s not uncommon for someone to be promoted to forecaster because they were great with Excel. Unless you are with an unusually small company, the scale of modern corporate forecasting overwhelms what you can handle with spreadsheets. The increasing speed of business compounds the problem: the sleepy tempo of annual and quarterly planning meetings is rapidly giving way to weekly or even daily re-forecasts as conditions change. So, be prepared to lean on a professional vendor of modern, scalable cloud-based demand planning and statistical forecasting software for training and support.


  1. Think visually. It will be very useful, both in deciding how to generate demand forecasts and in presenting them to management, so take advantage of the visualization capabilities built into forecasting software. As I noted above, in today’s high-frequency business world, the data you work with can change rapidly, so what you did last month may not be the right thing to do this month. Literally keep an eye on your data by making simple plots, like “timeplots” that show things like trend or seasonality or (especially) changes in trend or seasonality or anomalies that must be dealt with. Similarly, supplementing tables of forecasts with graphs comparing current forecasts to prior forecasts to actuals can be very helpful in an S&OP process. For example, timeplots showing past values, forecasted values, and “forecast intervals” indicating the objective uncertainty in the forecasts provide a solid basis for your team to fully appreciate the message in your forecasts.


That’s enough for now. As a person who’s taught in universities for half a century, I’m inclined to start into the statistical side of forecasting, but I’ll save that for another time. The five tips above should be helpful to you as you grow into a key part of your corporate planning team. Welcome to the game!