Three Ways to Estimate Forecast Accuracy

Forecast accuracy is a key metric by which to judge the quality of your demand planning process. (It’s not the only one. Others include timeliness and cost; See 5 Demand Planning Tips for Calculating Forecast Uncertainty.) Once you have forecasts, there are a number of ways to summarize their accuracy, usually designated by obscure three- or four-letter acronyms like MAPE, RMSE, and MAE.  See Four Useful Ways to Measure Forecast Error for more detail.

A less discussed but more fundamental issue is how computational experiments are organized for computing forecast error. This post compares the three most important experimental designs. One of them is old-school and essentially amounts to cheating. Another is the gold standard. A third is a useful expedient that mimics the gold standard and is best thought of as predicting how the gold standard will turn out. Figure 1 is a schematic view of the three methods.


Three Ways to Estimate Forecast Accuracy Software Smart

Figure 1: Three ways to assess forecast error


The top panel of Figure 1 depicts the way forecast error was assessed back in the early 1980’s before we moved the state of the art to the scheme shown in the middle panel. In the old days, forecasts were assessed on the same data used to compute the forecasts. After a model was fit to the data, the errors computed were not for model forecasts but for model fits. The difference is that forecasts are for future values, while fits are for concurrent values. For example, suppose the forecasting model is a simple moving average of the three most recent observations. At time 3, the model computes the average of observations 1, 2, and 3. This average would then be compared to the observed value at time 3. We call this cheating because the observed value at time 3 got a vote on what the forecast should be at time 3. A true forecast assessment would compare the average of the first three observations to the value of the next, fourth, observation. Otherwise, the forecaster is left with an overly optimistic assessment of forecast accuracy.

The bottom panel of Figure 1 shows the best way to assess forecast accuracy. In this schema, all the historical demand data are used to fit a model, which is then used to forecast future, unknown demand values. Eventually, the future unfolds, the true future values reveal themselves, and actual forecast errors can be computed. This is the gold standard. This information populates the “forecasts versus actuals” report in our software.

The middle panel depicts a useful halfway measure. The problem with the gold standard is that you must wait to learn how well your chosen forecasting methods perform. This delay does not help when you are required to choose, in the moment, which forecasting method to use for each item. Nor does it provide a timely estimate of the forecast uncertainty you will experience, which is important for risk management such as forecast hedging. The middle way is based on hold-out analysis, which excludes (“holds out”) the most recent observations and asks the forecasting method to do its work without knowing those ground truths. Then the forecasts based on the foreshortened demand history can be compared to the held-out actual values to get an honest assessment of forecast error.


A Beginner’s Guide to Downtime and What to Do about It

This blog provides an overview of this topic written for non-experts. It

  • explains why you might want to read this blog.
  • lists the various types of “machine maintenance.”
  • explains what “probabilistic modeling” is.
  • describes models for predicting downtime.
  • explains what these models can do for you.

Importance of Downtime

If you manufacture things for sale, you need machines to make those things. If your machines are up and running, you have a fighting chance to make money. If your machines are down, you lose opportunities to make money. Since downtime is so fundamental, it is worth some investment of money and thought to minimize downtime. By thought I mean probability math, since machine downtime is inherently a random phenomenon. Probability models can guide maintenance policies.

Machine Maintenance Policies

Maintenance is your defense against downtime. There are multiple types of maintenance policies, ranging from “Do nothing and wait for failure” to sophisticated analytic approaches involving sensors and probability models of failure.

A useful list of maintenance policies is:

  • Sitting back and wait for trouble, then sitting around some more wondering what to do when trouble inevitably happens. This is as foolish as it sounds.
  • Same as above except you prepare for the failure to minimize downtime, e.g., stockpiling spare parts.
  • Periodically checking for impending trouble coupled with interventions such as lubricating moving parts or replacing worn parts.
  • Basing the timing of maintenance on data about machine condition rather than relying on a fixed schedule; requires ongoing data collection and analysis. This is called condition-based maintenance.
  • Using data on machine condition more aggressively by converting it into predictions of failure time and suggestions for steps to take to delay failure. This is called predictive maintenance.

The last three types of maintenance rely on probability math to establish a maintenance schedule, or determine when data on machine condition call for intervention, or calculate when failure might occur and how best to postpone it.


Probability Models of Machine Failure

How long a machine will run before it fails is a random variable. So is the time it will spend down. Probability theory is the part of math that deals with random variables. Random variables are described by their probability distributions, e.g., what is the chance that the machine will run for 100 hours before it goes down? 200 hours? Or, equivalently, what is the chance that the machine is still working after 100 hours or 200 hours?

A sub-field called “reliability theory” answers this type of question and addresses related concepts like Mean Time Before Failure (MTBF), which is a shorthand summary of the information encoded in the probability distribution of time before failure.

Figures 1 shows data on the time before failure of air conditioning units. This type of plot depicts the cumulative probability distribution and shows the chance that a unit will have failed after some amount of time has elapsed. Figure 2 shows a reliability function, plotting the same type of information in an inverse format, i.e., depicting the chance that a unit is still functioning after some amount of time has elapsed.

In Figure 1, the blue tick marks next to the x-axis show the times at which individual air conditioners were observed to fail; this is the basic data. The black curve shows the cumulative proportion of units failed over time. The red curve is a mathematical approximation to the black curve – in this case an exponential distribution. The plots show that about 80 percent of the units will fail before 100 hours of operation.
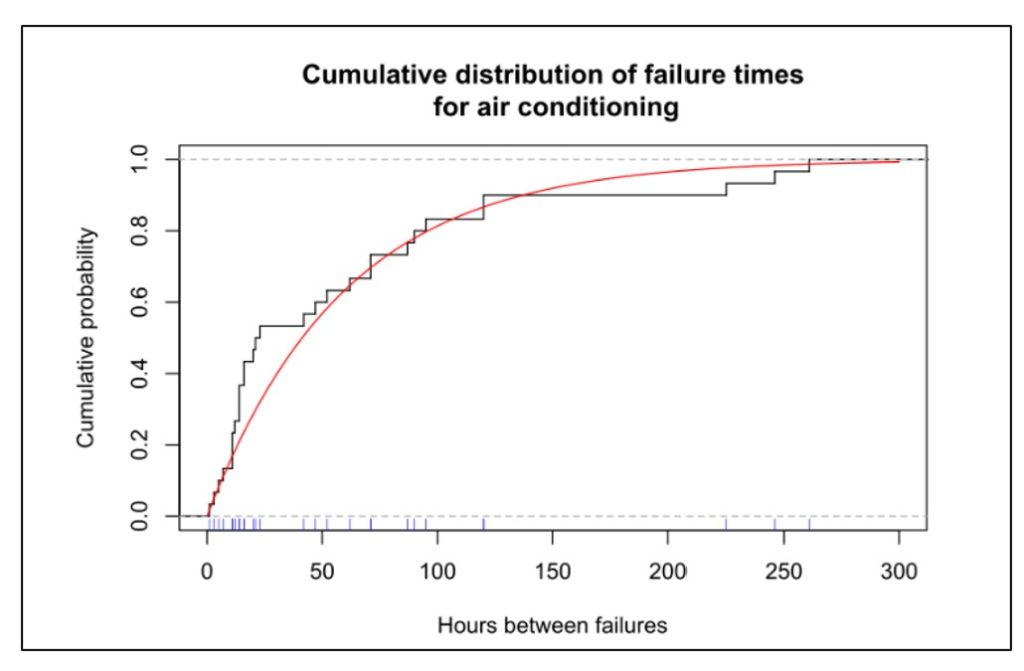
Figure 1 Cumulative distribution function of uptime for air conditioners

Figure 1 Cumulative distribution function of uptime for air conditioners


Probability models can be applied to an individual part or component or subsystem, to a collection of related parts (e.g., “the hydraulic system”), or to an entire machine. Any of these can be described by the probability distribution of the time before they fail.

Figure 2 shows the reliability function of six subsystems in a machine for digging tunnels. The plot shows that the most reliable subsystem is the cutting arms and the least reliable is the water subsystem. The reliability of the entire system could be approximated by multiplying all six curves (because for the system as a whole to work, every subsystem must be functioning), which would result in a very short interval before something goes wrong.
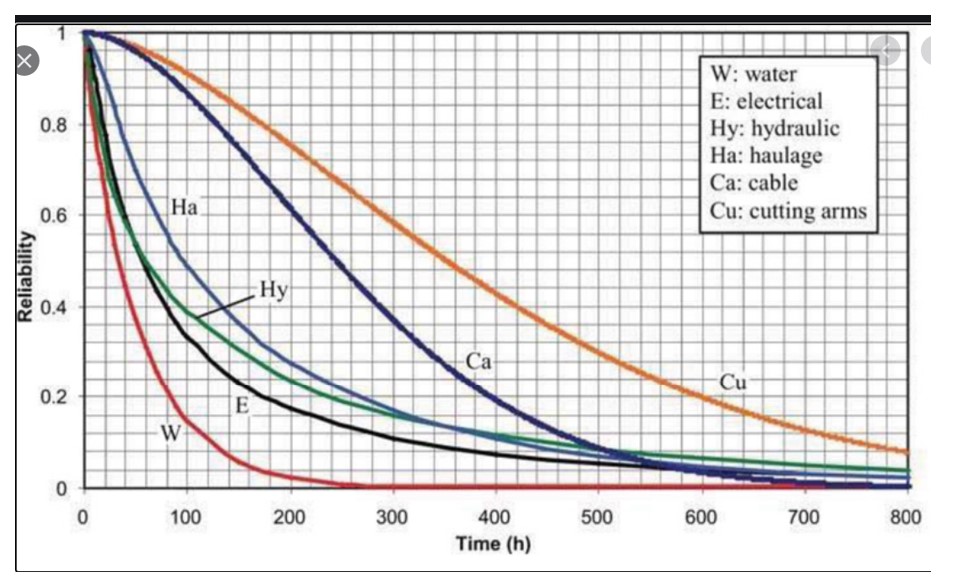
Figure 2 Examples of probability distributions of subsystems in a tunneling machine

Figure 2 Examples of probability distributions of subsystems in a tunneling machine


Various factors influence the distribution of the time before failure. Investing in better parts will prolong system life. So will investing in redundancy. So will replacing used pars with new.

Once a probability distribution is available, it can be used to answer any number of what-if questions, as illustrated below in the section on Benefits of Models.


Approaches to Modeling Machine Reliability

Probability models can describe either the most basic units, such as individual system components (Figure 2), or collections of basic units, such as entire machines (Figure 1). In fact, an entire machine can be modeled either as a single unit or as a collection of components. If treating an entire machine as a single unit, the probability distribution of lifetime represents a summary of the combined effect of the lifetime distributions of each component.

If we have a model of an entire machine, we can jump to models of collections of machines. If instead we start with models of the lifetimes of individual components, then we must somehow combine those individual models into an overall model of the entire machine.

This is where the math can get hairy. Modeling always requires a wise balance between simplification, so that some results are possible, and complication, so that whatever results emerge are realistic. The usual trick is to assume that failures of the individual pieces of the system occur independently.

If we can assume failures occur independently, it is usually possible to model collections of machines. For instance, suppose a production line has four machines churning out the same product. Having a reliability model for a single machine (as in Figure 1) lets us predict, for instance, the chance that only three of the machines will still be working one week from now. Even here there can be a complication: the chance that a machine working today will still be working tomorrow often depends on how long it has been since its last failure. If the time between failures has an exponential distribution like the one in Figure 1, then it turns out that the time of the next failure doesn’t depend on how long it has been since the last failure. Unfortunately, many or even most systems do not have exponential distributions of uptime, so the complication remains.

Even worse, if we start with models of many individual component reliabilities, working our way up to predicting failure times for the entire complex machine may be nearly impossible if we try to work with all the relevant equations directly. In such cases, the only practical way to get results is to use another style of modeling: Monte Carlo simulation.

Monte Carlo simulation is a way to substitute computation for analysis when it is possible to create random scenarios of system operation. Using simulation to extrapolate machine reliability from component reliabilities works as follows.

  1. Start with the cumulative distribution functions (Figure 1) or reliability functions (Figure 2) of each machine component.
  2. Create a random sample from each component lifetime to get a set of sample failure times consistent with its reliability function.
  3. Using the logic of how components are related to one another, compute the failure time of the entire machine.
  4. Repeat steps 1-3 many times to see the full range of possible machine lifetimes.
  5. Optionally, average the results of step 4 to summarize the machine lifetime with such metrics such as the MTBF or the chance that the machine will run more than 500 hours before failing.

Step 1 would be a bit complicated if we do not have a nice probability model for a component lifetime, e.g., something like the red line in Figure 1.

Step 2 can require some careful bookkeeping. As time moves forward in the simulation, some components will fail and be replaced while others will keep grinding on. Unless a component’s lifetime has an exponential distribution, its remaining lifetime will depend on how long the component has been in continual use. So this step must account for the phenomena of burn in or wear out.

Step 3 is different from the others in that it does require some background math, though of a simple type. If Machine A only works when both components 1 and 2 are working, then (assuming failure of one component does not influence failure of the other)

Probability [A works] = Probability [1 works] x Probability [2 works].

If instead Machine A works if either component 1 works or component 2 works or both work, then

Probability [A fails] = Probability [1 fails] x Probability [2 fails]

so Probability [A works] = 1 – Probability [A fails].

Step 4 can involve creation of thousands of scenarios to show the full range of random outcomes. Computation is fast and cheap.

Step 5 can vary depending on the user’s goals. Computing the MTBF is standard. Choose others to suit the problem. Besides the summary statistics provided by step 5, individual simulation runs can be plotted to build intuition about the random dynamics of machine uptime and downtime. Figure 3 shows an example for a single machine showing alternating cycles of uptime and downtime resulting in 85% uptime.
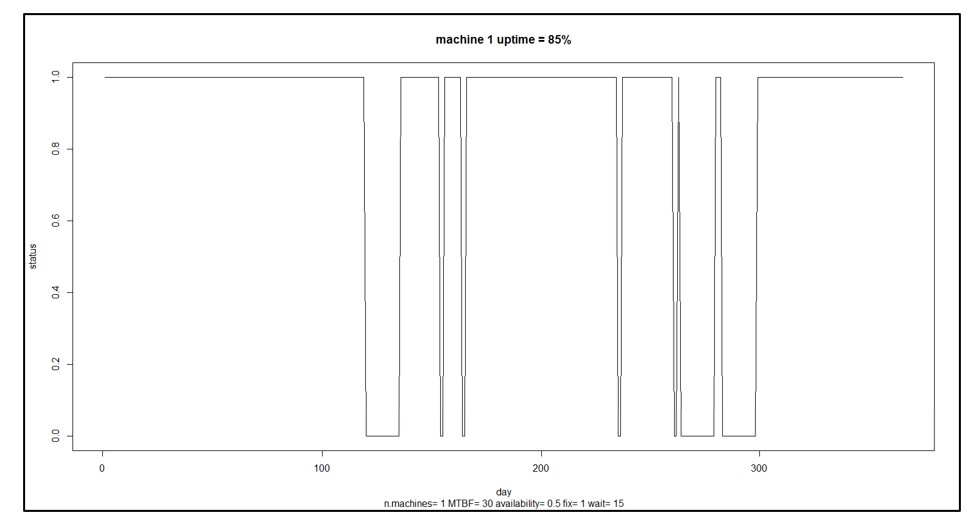
Figure 3 A sample scenario for a single machine

Figure 3 A sample scenario for a single machine


Benefits of Machine Reliability Models

In Figure 3, the machine is up and running 85% of the time. That may not be good enough. You may have some ideas about how to improve the machine’s reliability, e.g., maybe you can improve the reliability of component 3 by buying a newer, better version from a different supplier. How much would that help? That is hard to guess: component 3 may only one of several and perhaps not the weakest link, and how much the change pays off depends on how much better the new one would be. Maybe you should develop a specification for component 3 that you can then shop to potential suppliers, but how long does component 3 have to last to have a material impact on the machine’s MTBF?

This is where having a model pays off. Without a model, you’re relying on guesswork. With a model, you can turn speculation about what-if situations into accurate estimates. For instance, you could analyze how a 10% increase in MTBF for component 3 would translate into an improvement in MTBF for the entire machine.

As another example, suppose you have seven machines producing an important product. You calculate that you must dedicate six of the seven to fill a major order from your one big customer, leaving one machine to handle demand from a number of miscellaneous small customers and to serve as a spare. A reliability model for each machine could be used to estimate the probabilities of various contingencies: all seven machines work and life is good; six machines work so you can at least keep your key customer happy; only five machines work so you have to negotiate something with your key customer, etc.

In sum, probability models of machine or component failure can provide the basis for converting failure time data into smart business decisions.


Read more about  Maximize Machine Uptime with Probabilistic Modeling


Read more about   Probabilistic forecasting for intermittent demand


Leave a Comment
Related Posts
Innovating the OEM Aftermarket with AI-Driven Inventory Optimization

Innovating the OEM Aftermarket with AI-Driven Inventory Optimization

The aftermarket sector provides OEMs with a decisive advantage by offering a steady revenue stream and fostering customer loyalty through the reliable and timely delivery of service parts. However, managing inventory and forecasting demand in the aftermarket is fraught with challenges, including unpredictable demand patterns, vast product ranges, and the necessity for quick turnarounds. Traditional methods often fall short due to the complexity and variability of demand in the aftermarket. The latest technologies can analyze large datasets to predict future demand more accurately and optimize inventory levels, leading to better service and lower costs.

Forecast-Based Inventory Management for Better Planning

Forecast-Based Inventory Management for Better Planning

Forecast-based inventory management, or MRP (Material Requirements Planning) logic, is a forward-planning method that helps businesses meet demand without overstocking or understocking. By anticipating demand and adjusting inventory levels, it maintains a balance between meeting customer needs and minimizing excess inventory costs. This approach optimizes operations, reduces waste, and enhances customer satisfaction.

Make AI-Driven Inventory Optimization an Ally for Your Organization

Make AI-Driven Inventory Optimization an Ally for Your Organization

In this blog, we will explore how organizations can achieve exceptional efficiency and accuracy with AI-driven inventory optimization. Traditional inventory management methods often fall short due to their reactive nature and reliance on manual processes. Maintaining optimal inventory levels is fundamental for meeting customer demand while minimizing costs. The introduction of AI-driven inventory optimization can significantly reduce the burden of manual processes, providing relief to supply chain managers from tedious tasks.

Call an Audible to Proactively Counter Supply Chain Noise


You know the situation: You work out the best way to manage each inventory item by computing the proper reorder points and replenishment targets, then average demand increases or decreases, or demand volatility changes, or suppliers’ lead times change, or your own costs change. Now your old policies (reorder points, safety stocks, Min/Max levels, etc.)  have been obsoleted – just when you think you’d got them right.   Leveraging advanced planning and inventory optimization software gives you the ability to proactively address ever-changing outside influences on your inventory and demand.  To do so, you’ll need to regularly recalibrate stocking parameters based on ever-changing demand and lead times.

Recently, some potential customers have expressed concern that by regularly modifying inventory control parameters they are introducing “noise” and adding complication to their operations. A visitor to our booth at last week’s Microsoft Dynamics User Group Conference commented:

“We don’t want to jerk around the operations by changing the policies too often and introducing noise into the system. That noise makes the system nervous and causes confusion among the buying team.”

This view is grounded in yesterday’s paradigms.  While you should generally not change an immediate production run, ignoring near-term changes to the policies that drive future production planning and order replenishment will wreak havoc on your operations.   Like it or not, the noise is already there in the form of extreme demand and supply chain variability.  Fixing replenishment parameters, updating them infrequently, or only reviewing at the time of order means that your Supply Chain Operations will only be able to react to problems rather than proactively identify them and take corrective action.

Modifying the policies with near-term recalibrations is adapting to a fluid situation rather than being captive to it.  We can look to this past weekend’s NFL games for a simple analogy. Imagine the quarterback of your favorite team consistently refusing to call an audible (change the play just before the ball is snapped) after seeing the defensive formation.  This would result in lots of missed opportunities, inefficiency, and stalled drives that could cost the team a victory.  What would you want your quarterback to do?

Demand, lead times, costs, and business priorities often change, and as these last 18 months have proved they often change considerably.  As a Supply Chain leader, you have a choice:  keep parameters fixed resulting in lots of knee-jerk expedites and order cancellations, or proactively modify inventory control parameters.  Calling the audible by recalibrating your policies as demand and supply signals change is the right move.

Here is an example. Suppose you are managing a critical item by controlling its reorder point (ROP) at 25 units and its order quantity (OQ) at 48. You may feel like a rock of stability by holding on to those two numbers, but by doing so you may be letting other numbers fluctuate dramatically.  Specifically, your future service levels, fill rates, and operating costs could all be resetting out of sight while you fixate on holding onto yesterday’s ROP and OQ.  When the policy was originally determined, demand was stable and lead times were predictable, yielding service levels of 99% on an important item.   But now demand is increasing and lead times are longer.  Are you really going to expect the same outcome (99% service level) using the same sets of inputs now that demand and lead times are so different?  Of course not.  Suppose you knew that given the recent changes in demand and lead time, in order to achieve the same service level target of 99%, you had to increase the ROP to 35 units.  If you were to keep the ROP at 25 units your service level would fall to 92%.  Is it better to know this in advance or to be forced to react when you are facing stockouts?

What inventory optimization and planning software does is make visible the connections between performance metrics like service rate and control parameters like ROP and ROQ. The invisible becomes visible, allowing you to make reasoned adjustments that keep your metrics where you need them to be by adjusting the control levers available for your use.  Using probabilistic forecasting methods will enable you to generate Key Performance Predictions (KPPs) of performance and costs while identifying near-term corrective actions such as targeted stock movements that help avoid problems and take advantage of opportunities. Not doing so puts your supply chain planning in a straightjacket, much like the quarterback who refuses to audible.

Admittedly, a constantly-changing business environment requires constant vigilance and occasional reaction. But the right inventory optimization and demand forecasting software can recompute your control parameters at scale with a few mouse clicks and clue your ERP system how to keep everything on course despite the constant turbulence.  The noise is already in your system in the form of demand and supply variability.  Will you proactively audible or stick to an older plan and cross your fingers that things will work out fine?


Leave a Comment
Related Posts
Innovating the OEM Aftermarket with AI-Driven Inventory Optimization

Innovating the OEM Aftermarket with AI-Driven Inventory Optimization

The aftermarket sector provides OEMs with a decisive advantage by offering a steady revenue stream and fostering customer loyalty through the reliable and timely delivery of service parts. However, managing inventory and forecasting demand in the aftermarket is fraught with challenges, including unpredictable demand patterns, vast product ranges, and the necessity for quick turnarounds. Traditional methods often fall short due to the complexity and variability of demand in the aftermarket. The latest technologies can analyze large datasets to predict future demand more accurately and optimize inventory levels, leading to better service and lower costs.

Forecast-Based Inventory Management for Better Planning

Forecast-Based Inventory Management for Better Planning

Forecast-based inventory management, or MRP (Material Requirements Planning) logic, is a forward-planning method that helps businesses meet demand without overstocking or understocking. By anticipating demand and adjusting inventory levels, it maintains a balance between meeting customer needs and minimizing excess inventory costs. This approach optimizes operations, reduces waste, and enhances customer satisfaction.

Make AI-Driven Inventory Optimization an Ally for Your Organization

Make AI-Driven Inventory Optimization an Ally for Your Organization

In this blog, we will explore how organizations can achieve exceptional efficiency and accuracy with AI-driven inventory optimization. Traditional inventory management methods often fall short due to their reactive nature and reliance on manual processes. Maintaining optimal inventory levels is fundamental for meeting customer demand while minimizing costs. The introduction of AI-driven inventory optimization can significantly reduce the burden of manual processes, providing relief to supply chain managers from tedious tasks.

An Example of Simulation-Based Multiechelon Inventory Optimization

Managing the inventory in a single facility is difficult enough, but the problem becomes much more complex when there are multiple facilities arrayed in multiple echelons. The complexity arises from the interactions among the echelons, with demands at the lower levels bubbling up and any shortages at the higher levels cascading down.

If each of the facilities were to be managed in isolation, standard methods could be used, without regard to interactions, to set inventory control parameters such as reorder points and order quantities. However, ignoring the interactions between levels can lead to catastrophic failures. Experience and trial and error allow the design of stable systems, but that stability can be shattered by changes in demand patterns or lead times or by the addition of new facilities. Coping with such changes is greatly aided by advanced supply chain analytics, which provide a safe “sandbox” within which to test out proposed system changes before deploying them. This blog illustrates that point.


The Scenario

To have some hope of discussing this problem usefully, this blog will simplify the problem by considering the two-level hierarchy pictured in Figure 1. Imagine the facilities at the lower level to be warehouses (WHs) from which customer demands are meant to be satisfied, and that the inventory items at each WH are service parts sold to a wide range of external customers.


Fact and Fantasy in Multiechelon Inventory Optimization

Figure 1: General structure of one type of two-level inventory system

Imagine the higher level to consist of a single distribution center (DC) which does not service customers directly but does replenish the WHs. For simplicity, assume the DC itself is replenished from a Source that always has (or makes) sufficient stock to immediately ship parts to the DC, though with some delay. (Alternatively, we could consider the system to have retail stores supplied by one warehouse).

Each level can be described in terms of demand levels (treated as random), lead times (random), inventory control parameters (here, Min and Max values) and shortage policy (here, backorders allowed).


The Method of Analysis

The academic literature has made progress on this problem, though usually at the cost of simplifications necessary to facilitate a purely mathematical solution. Our approach here is more accessible and flexible: Monte Carlo simulation. That is, we build a computer program that incorporates the logic of the system operation. The program “creates” random demand at the WH level, processes the demand according to the logic of a chosen inventory policy, and creates demand for the DC by pooling the random requests for replenishment made by the WHs. This approach lets us observe many simulated days of system operation while watching for significant events like stockouts at either level.


An Example

To illustrate an analysis, we simulated a system consisting of four WHs and one DC. Average demand varied across the WHs. Replenishment from the DC to any WH took from 4 to 7 days, averaging 5.15 days. Replenishment of the DC from the Source took either 7, 14, 21 or 28 days, but 90% of the time it was either 21 or 28 days, making the average 21 days. Each facility had Min and Max values set by analyst judgement after some rough calculations.

Figure 2 shows the results of one year of simulated daily operation of this system. The first row in the figure shows the daily demand for the item at each WH, which was assumed to be “purely random”, meaning it had a Poisson distribution. The second row shows the on-hand inventory at the end of each day, with Min and Max values indicated by blue lines. The third row describes operations at the DC.  Contrary to the assumption of much theory, the demand into the DC was not close to being Poisson, nor was the demand out of the DC to the Source. In this scenario, Min and Max values were sufficient to keep item availability was high at each WH and at the DC, with no stockouts observed at any of the five facilities.


Click here to enlarge the image

Figure 2 - Simulated year of operation of a system with four WHs and one DC.

Figure 2 – Simulated year of operation of a system with four WHs and one DC.


Now let’s vary the scenario. When stockouts are extremely rare, as in Figure 2, there is often excess inventory in the system. Suppose somebody suggests that the inventory level at the DC looks a bit fat and thinks it would be good idea to save money there. Their suggestion for reducing the stock at the DC is to reduce the value of the Min at the DC from 100 to 50. What happens? You could guess, or you could simulate.

Figure 3 shows the simulation – the result is not pretty. The system runs fine for much of the year, then the DC runs out of stock and cannot catch up despite sending successively larger replenishment orders to the Source. Three of the four WHs descend into death spirals by the end of the year (and WH1 follows thereafter). The simulation has highlighted a sensitivity that cannot be ignored and has flagged a bad decision.


Click here to enlarge image

Figure 3 - Simulated effects of reducing the Min at the DC.

Figure 3 – Simulated effects of reducing the Min at the DC.


Now the inventory managers can go back to the drawing board and test out other possible ways to reduce the investment in inventory at the DC level. One move that always helps, if you and your supplier can jointly make it happen, is to create a more agile system by reducing replenishment lead time. Working with the Source to insure that the DC always gets its replenishments in either 7 or 14 days stabilizes the system, as shown in Figure 4.


Click here to enlarge image

Figure 4 - Simulated effects of reducing the lead time for replenishing the DC.

Figure 4 – Simulated effects of reducing the lead time for replenishing the DC.


Unfortunately, the intent of reducing the inventory at the DC has not been achieved. The original daily inventory count was about 80 units and remains about 80 units after reducing the DC’s Min and drastically improving the Source-to-DC lead time. But with the simulation model, the planning team can try out other ideas until they arrive at a satisfactory redesign. Or, given that Figure 4 shows the DC inventory starting to flirt with zero, they might think it prudent to accept the need for an average of about 80 units at the DC and look for ways to trim inventory investment at the WHs instead.


The Takeaways

  1. Multiechelon inventory optimization (MEIO) is complex. Many factors interact to produce system behaviors that can be surprising in even simple two-level systems.
  2. Monte Carlo simulation is a useful tool for planners who need to design new systems or tweak existing systems.


Leave a Comment
Related Posts
Innovating the OEM Aftermarket with AI-Driven Inventory Optimization

Innovating the OEM Aftermarket with AI-Driven Inventory Optimization

The aftermarket sector provides OEMs with a decisive advantage by offering a steady revenue stream and fostering customer loyalty through the reliable and timely delivery of service parts. However, managing inventory and forecasting demand in the aftermarket is fraught with challenges, including unpredictable demand patterns, vast product ranges, and the necessity for quick turnarounds. Traditional methods often fall short due to the complexity and variability of demand in the aftermarket. The latest technologies can analyze large datasets to predict future demand more accurately and optimize inventory levels, leading to better service and lower costs.

Forecast-Based Inventory Management for Better Planning

Forecast-Based Inventory Management for Better Planning

Forecast-based inventory management, or MRP (Material Requirements Planning) logic, is a forward-planning method that helps businesses meet demand without overstocking or understocking. By anticipating demand and adjusting inventory levels, it maintains a balance between meeting customer needs and minimizing excess inventory costs. This approach optimizes operations, reduces waste, and enhances customer satisfaction.

Make AI-Driven Inventory Optimization an Ally for Your Organization

Make AI-Driven Inventory Optimization an Ally for Your Organization

In this blog, we will explore how organizations can achieve exceptional efficiency and accuracy with AI-driven inventory optimization. Traditional inventory management methods often fall short due to their reactive nature and reliance on manual processes. Maintaining optimal inventory levels is fundamental for meeting customer demand while minimizing costs. The introduction of AI-driven inventory optimization can significantly reduce the burden of manual processes, providing relief to supply chain managers from tedious tasks.

Fact and Fantasy in Multiechelon Inventory Optimization

For most small-to-medium manufacturers and distributors, single-level or single-echelon inventory optimization is at the cutting edge of logistics practice. Multi-echelon inventory optimization (“MEIO”) involves playing the game at an even higher level and is therefore much less common. This blog is the first of two. It aims to explain what MEIO is, why standard MEIO theories break down, and how probabilistic modeling through scenario simulation can restore reality to the MEIO process. The second blog will show a particular example.


Definition of Inventory Optimization

An inventory system is built on a set of design choices.

The first choice is the policy for responding to stockouts: Do you just lose the sale to a competitor, or can you convince the customer to accept a backorder? The former is more common with distributors than manufacturers, but this may not be much of a choice since customers may dictate the answer.

The second choice is the inventory policy. These divide into “continuous review” and “periodic review” policies, with several options within each type. You can link to a video tutorial describing several common inventory policies here.  Perhaps the most efficient is known to practitioners as “Min/Max” and to academics as (s, S) or “little S, Big S.” We use this policy in the scenario simulations below. It works as follows: When on-hand inventory drops to or below the Min (s), an order is placed for replenishment. The size of the order is the gap between the on-hand inventory and the Max (S), so if Min is 10, Max is 25 and on-hand is 8, it’s time for an order of 25-8 = 17 units.

The third choice is to decide on the best values of the inventory policy “parameters”, e.g., the values to use for Min and Max. Before assigning numbers to Min and Max, you need clarity on what “best” means for you. Commonly, best means choices that minimize inventory operating costs subject to a floor on item availability, expressed either as Service Level or Fill Rate. In mathematical terms, this is a “two-dimensional constrained integer optimization problem”. “Two-dimensional” because you have to pick two numbers: Min and Max. “Integer” because Min and Max have to be whole numbers. “Constrained” because you must pick Min and Max values that give a high-enough level of item availability such as service levels and fill rates. “Optimization” because you  want to get there with the lowest operating cost (operating cost combines holding, ordering and shortage costs).


Multiechelon Inventory Systems

The optimization problem becomes more difficult in multi-echelon systems. In a single-echelon system, each inventory item can be analyzed in isolation: one pair of Min/Max values per SKU. Because there are more parts to a multiechelon system, there is a bigger computational problem.

Figure 1 shows a simple two-level system for managing a single SKU. At the lower level, demands arrive at multiple warehouses. When those are in danger of stocking out, they are resupplied from a distribution center (DC). When the DC itself is in danger of stocking out, it is supplied by some outside source, such as the manufacturer of the item.

The design problem here is multidimensional: We need Min and Max values for 4 warehouses and for the DC, so the optimization occurs in 4×2+1×2=10 dimensions. The analysis must take account of a multitude of contextual factors:

  • The average level and volatility of demand coming into each warehouse.
  • The average and variability of replenishment lead times from the DC.
  • The average and variability of replenishment lead times from the source.
  • The required minimum service level at the warehouses.
  • The required minimum service level at the DC.
  • The holding, ordering and shortage costs at each warehouse.
  • The holding, ordering and shortage costs at the DC.

As you might expect, seat-of-the-pants guesses won’t do well in this situation. Neither will trying to simplify the problem by analyzing each echelon separately. For instance, stockouts at the DC increase the risk of stockouts at the warehouse level and vice versa.

This problem is obviously too complicated to try to solve without help from some sort of computer model.


Why Standard Inventory Theory is Bad Math

With a little looking, you can find models, journal articles and book about MEIO. These are valuable sources of information and insight, even numbers. But most of them rely on the expedient of over-simplifying the problem to make it possible to write and solve equations. This is the “Fantasy” referred to in the title.

Doing so is a classic modeling maneuver and is not necessarily a bad idea. When I was a graduate student at MIT, I was taught the value of having two models: a small, rough model to serve as a kind of sighting scope and a larger, more accurate model to produce reliable numbers. The smaller model is equation-based and theory-based; the bigger model is procedure-based and data-based, i.e., a detailed system simulation. Models based on simple theories and equations can produce bad numerical estimates and even miss whole phenomena. In contrast, models based on procedures (e.g., “order up to the Max when you breach the Min”) and facts (e.g., the last 3 years of daily item demand) will require a lot more computing but give more realistic answers. Luckily, thanks to the cloud, we have a lot of computing power at our fingertips.

Perhaps the greatest modeling “sin” in the MEIO literature is the assumption that demands at all echelons can be modeled as purely random Poisson processes. Even if it were true at the warehouse level, it would be far from true at the DC level. The Poisson process is the “white rat of demand modeling” because it is simple and permits more paper-and-pencil equation manipulation. Since not all demands are Poisson shaped, this results in unrealistic recommendations.


Scenario-based Simulation Optimization

To get realism, we must get down into the details of how the inventory systems operate at each echelon. With few limits except those imposed by hardware such as size of memory, computer programs can keep up any level of complexity. For instance, there is no need to assume that each of the warehouses faces identical demand streams or has the same costs as all the others.

A computer simulation works as follows.

  1. The real-world demand history and lead time history are gathered for each SKU at each location.
  2. Values of inventory parameters (e.g., Min and Max) are selected for trial.
  3. The demand and replenishment histories are used to create scenarios depicting inputs to the computer program that encodes the rules of operation of the system.
  4. The inputs are used to drive the operation of a computer model of the system with the chosen parameter values over a long period, say one year.
  5. Key performance indicators (KPI’s) are calculated for the simulated year.
  6. Steps 2-5 are repeated many times and the results averaged to link parameter choices to system performance.
  7.  

Inventory optimization adds another “outer loop” to the calculations by systematically searching over the possible values of Min and Max. Among those parameter pairs that satisfy the item availability constraint, further search identifies the Min and Max values that result in the lowest operating cost.

Fact and Fantasy in Multiechelon Inventory Optimization

Figure 1: General structure of one type of two-level inventory system


Stay Tuned for our next Blog

COMING SOON. To see an example of a simulation of the system in Figure 1, read the second blog on this topic


Leave a Comment
Related Posts
Innovating the OEM Aftermarket with AI-Driven Inventory Optimization

Innovating the OEM Aftermarket with AI-Driven Inventory Optimization

The aftermarket sector provides OEMs with a decisive advantage by offering a steady revenue stream and fostering customer loyalty through the reliable and timely delivery of service parts. However, managing inventory and forecasting demand in the aftermarket is fraught with challenges, including unpredictable demand patterns, vast product ranges, and the necessity for quick turnarounds. Traditional methods often fall short due to the complexity and variability of demand in the aftermarket. The latest technologies can analyze large datasets to predict future demand more accurately and optimize inventory levels, leading to better service and lower costs.

Forecast-Based Inventory Management for Better Planning

Forecast-Based Inventory Management for Better Planning

Forecast-based inventory management, or MRP (Material Requirements Planning) logic, is a forward-planning method that helps businesses meet demand without overstocking or understocking. By anticipating demand and adjusting inventory levels, it maintains a balance between meeting customer needs and minimizing excess inventory costs. This approach optimizes operations, reduces waste, and enhances customer satisfaction.

Make AI-Driven Inventory Optimization an Ally for Your Organization

Make AI-Driven Inventory Optimization an Ally for Your Organization

In this blog, we will explore how organizations can achieve exceptional efficiency and accuracy with AI-driven inventory optimization. Traditional inventory management methods often fall short due to their reactive nature and reliance on manual processes. Maintaining optimal inventory levels is fundamental for meeting customer demand while minimizing costs. The introduction of AI-driven inventory optimization can significantly reduce the burden of manual processes, providing relief to supply chain managers from tedious tasks.