How does your ERP system treat safety stock?

Is safety stock regarded as emergency spares or as a day-to-day buffer against spikes in demand? Knowing the difference and configuring your ERP properly will make a big difference to your bottom line.

The Safety Stock field in your ERP system can mean very different things depending on the configuration. Not understanding these differences and how they impact your bottom line is a common issue we’ve seen arise in implementations of our software.

Implementing inventory optimization software starts with new customers completing the technical implementation to get data flowing.  They then receive user training and spend weeks carefully configuring their initial safety stocks, reorder levels, and consensus demand forecasts with Smart IP&O.  The team becomes comfortable with Smart’s key performance predictions (KPPs) for service levels, ordering costs, and inventory on hand, all of which are forecasted using the new stocking policies.

But when they save the policies and forecasts to their ERP test system, sometimes the orders being suggested are far larger and more frequent than they expected, driving up projected inventory costs.

When this happens, the primary culprit is how the ERP is configured to treat safety stock.  Being aware of these configuration settings will help planning teams better set expectations and achieve the expected outcomes with less effort (and cause for alarm!).

Here are the three common examples of ERP safety stock configurations:

Configuration 1. Safety Stock is treated as emergency stock that can’t be consumed. If a breach of safety stock is predicted, the ERP system will force an expedite no matter the cost so the inventory on hand never falls below safety stock, even if a scheduled receipt is already on order and scheduled to arrive soon.

Configuration 2. Safety Stock is treated as Buffer stock that is designed to be consumed. The ERP system will place an order when a breach of safety stock is predicted but on hand inventory will be allowed to fall below the safety stock. The buffer stock protects against stockout during the resupply period (i.e., the lead time).

Configuration 3. Safety Stock is ignored by the system and treated as a visual planning aid or rule of thumb. It is ignored by supply planning calculations but used by the planner to help make manual assessments of when to order.

Note: We never recommend using the safety stock field as described in Configuration 3. In most cases, these configurations were not intended but result from years of improvisation that have led to using the ERP in a non-standard way.  Generally, these fields were designed to programmatically influence the replenishment calculations.  So, the focus of our conversation will be on Configurations 1 and 2. 

Forecasting and inventory optimization systems are designed to compute forecasts that will anticipate inventory draw down and then calculate safety stocks sufficient to protect against variability in demand and supply. This means that the safety stock is intended to be used as a protective buffer (Configuration 2) and not as emergency sparse (Configuration 3).  It is also important to understand that, by design, the safety stock will be consumed approximately 50% of the time.

Why 50%? Because actual orders will exceed an unbiased forecast half of the time. See the graphic below illustrating this.  A “good” forecast should yield the value that will come closest to the actual most often so actual demand will either be higher or lower without bias in either direction.


How does your ERP system treat safety stock 1


If you configured your ERP system to properly allow consumption of safety stock, then the on hand inventory might look like the graph below.  Note that some safety stock is consumed but avoided a stockout.  The service level you target when computing safety stock will dictate how often you stockout before the replenishment order arrives.  Average inventory is roughly 60 units over the time horizon in this scenario.


How does your ERP system treat safety stock 2


If your ERP system is configured to not allow consumption of safety stock and treats the quantity entered in the safety stock field more like emergency spares, then you will have a massive overstock!  Your inventory on hand would look like the graph below with orders being expedited as soon as a breach of safety stock is expected. Average inventory is roughly 90 units, a 50% increase compared to when you allowed safety stock to be consumed.


How does your ERP system treat safety stock 3


Top 4 Moves When You Suspect Software is Inflating Inventory

We often are asked, “Why is the software driving up the inventory?” The answer is that Smart isn’t driving it in either direction – the inputs are driving it, and those inputs are controlled by the users (or admins). Here are four things you can do to get the results you expect.

1. Confirm that your service level targets are commensurate with what you want for that item or group of items. Setting very high targets (95% or more) will likely drive inventory up if you have been coasting along at a lower level and are OK with being there. It’s possible you’ve never achieved the new higher service level but customers have not complained.  Figure out what service level has worked by evaluating historical reports on performance and set your targets accordingly. But keep in mind that competitors may beat you on item availability if you keep using your father’s service level targets.

2. Make sure your understanding of “service level” aligns with the software system’s definition. You may be measuring performance based on how often you ship within one week from receipt of the customer order, whereas the software is targeting reorder points based on your ability to ship right away, not within a week. Clearly the latter will require more inventory to hit the same “service level.” For instance, a 75% same-day service level may correspond to a 90% same-week service level. In this case, you are really comparing apples to oranges. If this is the reason for the excess stock, then determine what “same day” service level is needed to get you to your desired “same week” service level and enter that into the software. Using the less-stringent same-day target will drop the inventory, sometimes very significantly.

3. Evaluate the lead time inputs. We’ve seen instances in which lead times had been inflated to trick old software into producing desired results. Modern software tracks suppliers’ performance by recording their actual lead times over multiple orders, then it takes account of lead time variability in its simulations of daily operations. Watch out if your lead times are fixed at one value that was decided on in the distant past and isn’t current.

4. Check your demand signal. You have lots of historical transactions in your ERP system that can be used in many ways to determine the demand history. If you are using signals such as transfers, or you are not excluding returns, then you may be overstating demand. Spend a little time on defining “demand” in the way that makes most sense for your situation.

Prepare your spare parts planning for unexpected shocks

Did you know that it was Benjamin Franklin who invented the lightning rod to protect buildings from lightning strikes? Now, it’s not every day that we must worry about lightning strikes, but in today’s unpredictable business climate, we do have to worry about supply chain disruptions, long lead times, rising interest rates, and volatile demand. With all these challenges, it’s never been more vital for organizations to accurately forecast parts usage, stocking levels, and to optimize replenishment policies such as reorder points, safety stocks, and order quantities.  In this blog, we’ll explore how companies can leverage innovative solutions like inventory optimization and parts forecasting software that utilize machine learning algorithms, probabilistic forecasting, and analytics to stay ahead of the curve and protect their supply chains from unexpected shocks.

Spare Parts Planning Solutions
Spare parts optimization is a key aspect of supply chain management for many industries. It involves managing the inventory of spare parts to ensure they are available when needed without having excess inventory that can tie up capital and space. Optimizing spare parts inventory is a complex process that requires a deep understanding of usage patterns, supplier lead times, and the criticality of each part for the business.

In this blog, our primary emphasis will be on the crucial aspect of inventory optimization and demand forecasting. However, other approaches highlighted below for spare parts optimization, such as predictive maintenance and 3D printing, Master Data Management, and collaborative planning should be investigated and deployed as appropriate.

  1. Predictive Maintenance: Using predictive analytics to anticipate when a part is likely to fail and proactively replace it, rather than waiting for it to break down. This approach can help companies reduce downtime and maintenance costs, as well as improve overall equipment effectiveness.
  2. 3D printing: Advancements in 3D printing technology are enabling companies to produce spare parts on demand, reducing the need for excess inventory. This not only saves space and reduces costs but also ensures that parts are available when needed.
  3. Master Data Management: Data Management platforms ensure that part data is properly identified, cataloged, cleansed, and organized. All too often, MRO organizations hold the same part number under different SKUs. These duplicate parts serve the same purpose but require different SKU numbers to ensure regulatory compliance or security.  For example, a part used to support a government contract may be required be sourced from a US manufacturer to stay in compliance with “Buy America” regulations.  It’s critical that these part numbers be identified and consolidated into one SKU, when possible, to keep inventory investments in check.
  4. Collaborative Planning: Collaborating with suppliers and customers to share data, forecasts, and plan demand can help companies reduce lead times, improve accuracy, and reduce inventory levels. Forecasting plays an essential role in collaboration as sharing insights on purchases, demand, and buying behavior ensures suppliers have the information they need to ensure stock availability for customers.

Inventory Optimization
Abraham Lincoln was once quoted as saying, “Give me six hours to chop down a tree, and I will spend the first four sharpening the axe”? Lincoln knew that preparation and optimization were key to success, just like organizations need to have the right tools, such as inventory optimization software, to optimize their supply chain and stay ahead in the market. With inventory optimization software, organizations can improve their forecasting accuracy, lower inventory costs, improve service levels, and reduce lead times. Lincoln knew that sharpening the axe was necessary to accomplish the job effectively without overexerting.  Inventory Optimization ensures that inventory dollars are allocated effectively across thousands of parts helping ensure service levels while minimizing excess stock.

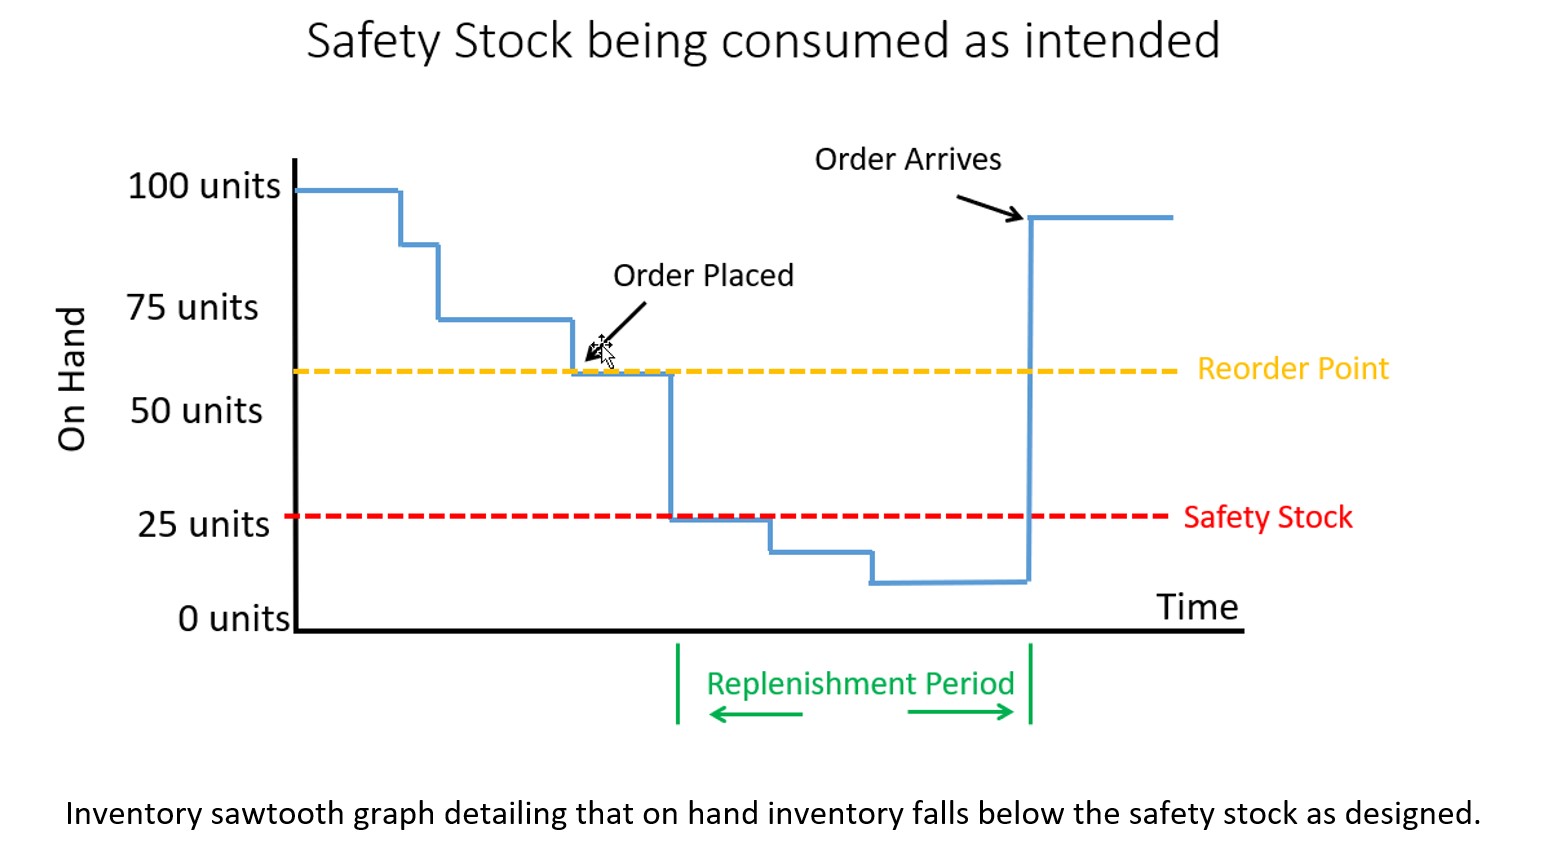
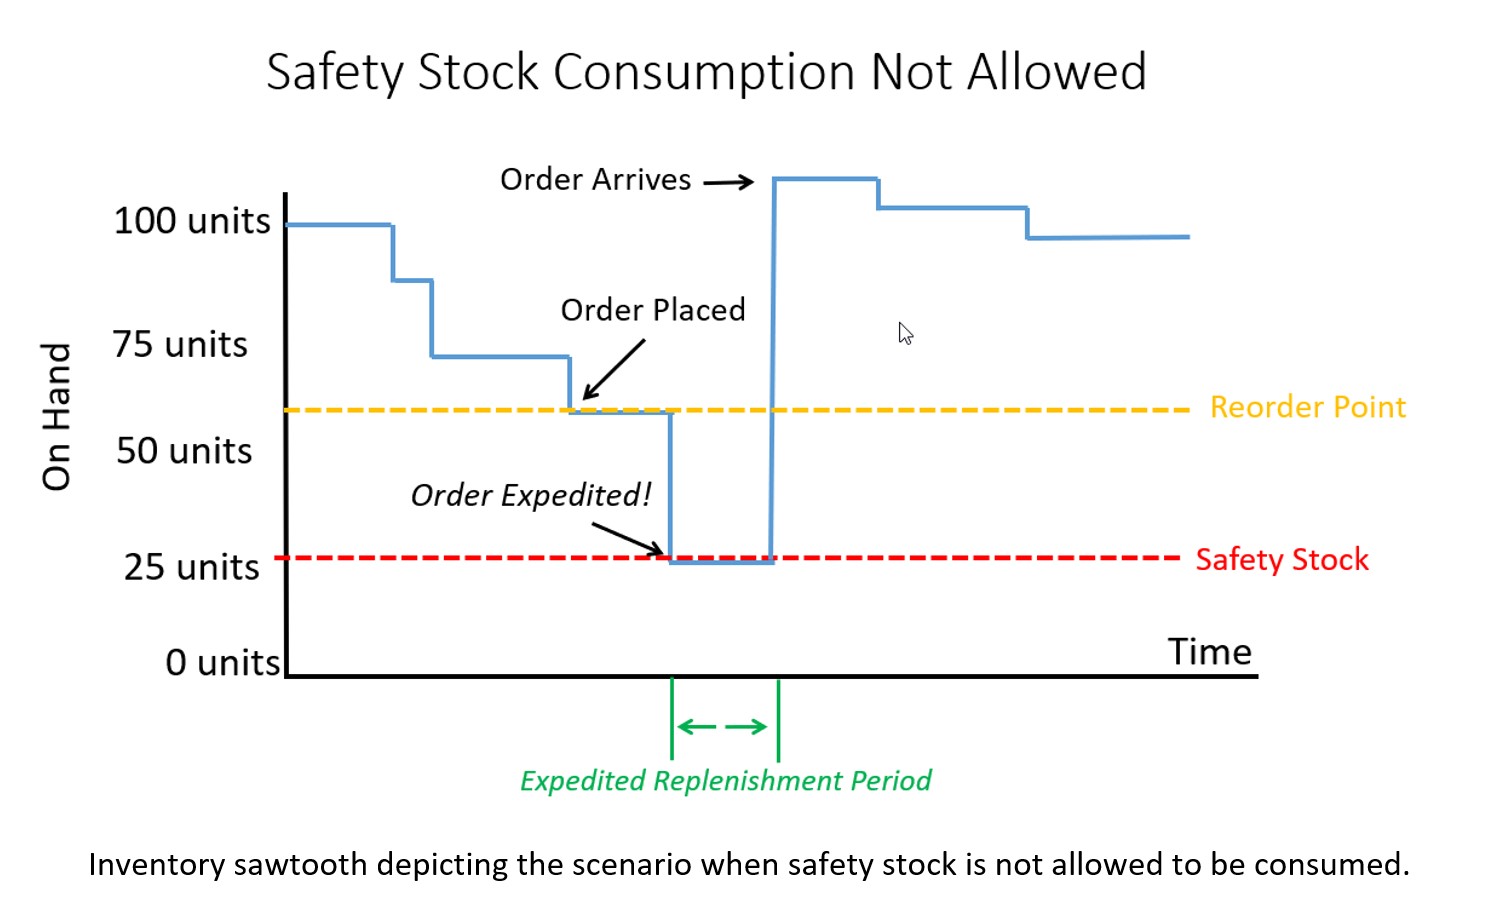
Spare parts play a decisive role in maintaining operational efficiency, and the lack of critical parts can lead to downtime and reduced productivity. The sporadic nature of spare parts demand makes it difficult to predict when a specific part will be required, resulting in the risk of overstocking or understocking, both of which can incur costs for the organization.  Additionally, managing lead times for spare parts poses its own set of challenges. Some parts may have lengthy delivery times, necessitating the maintenance of adequate inventory levels to avoid shortages. However, carrying excess inventory can be costly, tying up capital and storage space.

Given the myriad of challenges facing materials management departments and spare parts planners, planning demand, stocking levels, and replenishment of spare parts without an effective inventory optimization solution is akin to attempting to chop down a tree with a very blunt axe! The sharper the axe, the better your organization will be able to contend with these challenges.

Smart Software’s Axe is the Sharpest
Smart Inventory Optimization and Demand Planning Software uses a unique empirical probabilistic forecasting approach that results in accurate forecasts of inventory requirements, even where demand is intermittent. Since nearly 90% of spare and service parts are intermittent, an accurate solution to handle this type of demand is required.   Smart’s solution was patented in 2001 and additional innovations were recently patented in May of 2023 (announcements coming soon!).  The solution was awarded as a finalist in the APICS Technological Innovation Category for its role in helping transform the resource management industry.

The Role of Intermittent Demand
Intermittent demand does not conform to a simple normal or bell-shaped distribution that makes it impossible to forecast accurately with traditional, smoothing-based forecasting methods.  Parts and items with intermittent demand – also known as lumpy, volatile, variable or unpredictable demand – have many zero or low-volume values interspersed with random spikes of demand that are often many times larger than the average. This problem is especially prevalent in companies that manage large inventories of service and spare parts in industries such as aviation, aerospace, power and water supply and utilities, automotive, heavy asset management, high tech, as well as in MRO (Maintenance, Repair, and Overhaul).

Scenario Analysis
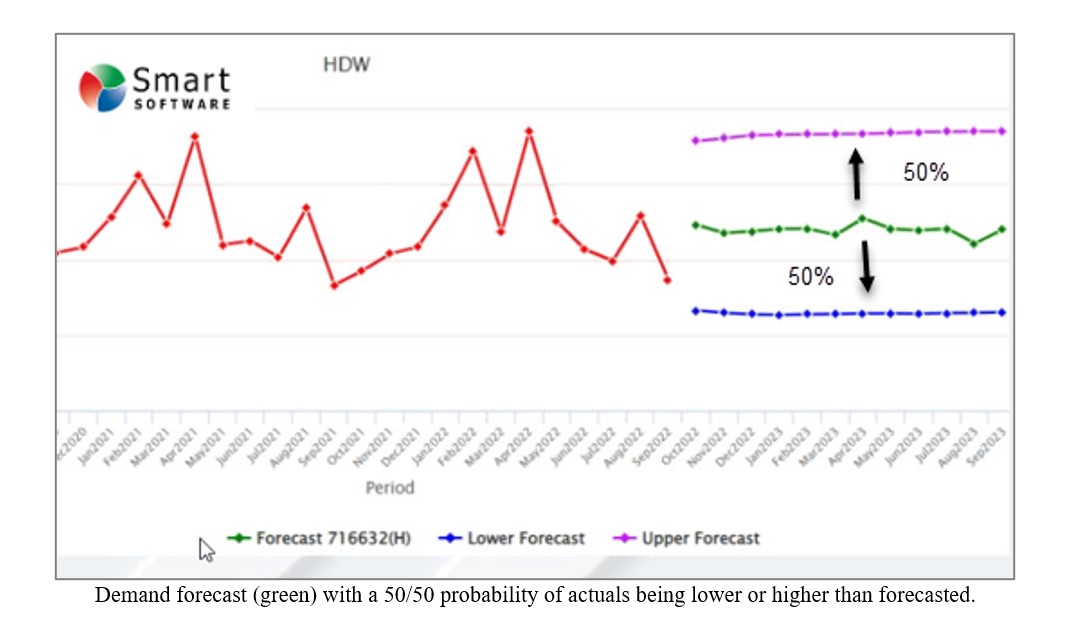
Smart’s patented and award-winning technology rapidly generates tens of thousands of possible scenarios of future demand sequences and cumulative demand values over an item’s lead time. These scenarios are statistically similar to the item’s observed data, and they capture the relevant details of intermittent demand without relying on the assumptions commonly made about the nature of demand distributions by traditional forecasting methods. The result is a highly accurate forecast of the entire distribution of cumulative demand over an item’s lead time. The bottom line is that with the information these demand distributions provide, companies can easily plan safety stock and service level inventory requirements for thousands of intermittently demanded items with nearly 100% accuracy.

Benefits
Implementing innovative solutions from Smart Software such as SmartForecasts for statistical forecasting, Demand Planner for consensus parts planning, and Inventory Optimization for developing accurate replenishment drivers such as min/max and safety stock levels will provide forward-thinking executives and planners with better control over their organization’s operations.  It will result in the following benefits:

  1. Improved Forecasting Accuracy: Accurate demand forecasting is fundamental for any organization that deals with spare parts inventory management. Inventory optimization software uses sophisticated algorithms to analyze historical usage patterns, identify trends and forecast future demand with a high degree of accuracy. With this level of precision in forecasting, organizations can avoid the risk of overstocking or understocking their spare parts inventory.
  2. Lower Inventory Costs: One major challenge that supply chain leaders face when dealing with spare parts inventory management is the cost associated with maintaining an optimal stock of spares at all times. By optimizing inventory levels using modern technology systems like artificial intelligence (AI), machine learning (ML), and predictive analytics, organizations can reduce carrying costs while ensuring they have adequate stocks available when needed.
  3. Improved Service Levels: When it comes to repair and maintenance services, time is money! Downtime due to the unavailability of critical spare parts can result in lost productivity and revenue for businesses across industries such as manufacturing plants, power generation facilities, or data centers managing IT infrastructure equipment. Optimizing your spare parts inventory ensures that you always have the right amount on hand, reducing downtime caused by waiting for deliveries from suppliers.
  4. Reduced Lead Times: Another benefit that accrues from accurate demand forecasting through modern warehouse technologies is reduced lead time in delivery which leads to better customer satisfaction since customers will receive their orders faster than before thus improving brand loyalty. Therefore, the adoption of new strategies driven by AI/ML tools creates value within supply chain operations leading to increased efficiency gains not only limited reductionism cost but also streamlining processes related to production scheduling, logistics transportation planning among others

Conclusion
Through the utilization of inventory optimization and demand planning software, organizations can overcome various challenges such as supply chain disruptions, rising interest rates, and volatile demand. This enables them to reduce costs associated with excess storage space and obsolete inventory items. By leveraging sophisticated algorithms, inventory optimization software enhances forecasting accuracy, ensuring organizations can avoid overstocking or under-stocking their spare parts inventory. Additionally, it helps lower inventory costs by optimizing levels and leveraging technologies like artificial intelligence (AI), machine learning (ML), and predictive analytics. Improved service levels are achieved as organizations have the right quantity of spare parts readily available, reducing downtime caused by waiting for deliveries. Furthermore, accurate demand forecasting leads to reduced lead times, enhancing customer satisfaction and fostering brand loyalty. Adopting such strategies driven by AI/ML tools not only reduces costs but also streamlines processes, including production scheduling and logistics transportation planning, ultimately increasing efficiency gains within the supply chain.


White Paper:

What you Need to know about Forecasting and Planning Service Parts


This paper describes Smart Software’s patented methodology for forecasting demand, safety stocks, and reorder points on items such as service parts and components with intermittent demand, and provides several examples of customer success.


    How to Forecast Spare Parts with Low Usage

    What do you do when you are forecasting an intermittently demanded item, such as a spare part, with average demand of less than one unit per month?  Most of the time the demand is zero, but the part is significant in a business sense; it can’t be ignored and must be forecasted to be sure you have adequate stock.

    Your choices tend to center around a few options:

    Option 1:  Round up to 1 each month, so your annual forecast is 12.

    Option 2:  Round down to 0 each month, so your annual forecast is 0.

    Option 3:  Forecast “same as same month last year” method so the forecast matches last year’s actual.

    There are obvious disadvantages to each option and not much advantage to any of them.  Option 1 often results in a significant over forecast.  Option 2 often results in a significant under-forecast.  Option 3 results in a forecast that is almost guaranteed to miss the actual significantly since the demand isn’t likely to spike in the exact same period. If you MUST forecast the item, then we would normally recommend option 3 since it is the most likely answer that the rest of the business would understand. 

    But a better way is to not forecast it at all in the usual sense and instead use a “predictive reorder point“ keyed to your desired service level. To calculate a predictive reorder point, you can use Smart Software’s patented Markov bootstrap algorithm to simulate all possible demands that could occur over the lead time, then identify the reorder point that will yield your target service level.

    You can then configure your ERP system to order more when on-hand inventory breaches the reorder point rather than when you are forecasted to hit zero (or whatever safety stock buffer is entered). 

    This makes for more common-sense ordering without the unneeded assumptions that are required to forecast an intermittently demanded, low-volume part.


    Spare Parts Planning Software solutions

    Smart IP&O’s service parts forecasting software uses a unique empirical probabilistic forecasting approach that is engineered for intermittent demand. For consumable spare parts, our patented and APICS award winning method rapidly generates tens of thousands of demand scenarios without relying on the assumptions about the nature of demand distributions implicit in traditional forecasting methods. The result is highly accurate estimates of safety stock, reorder points, and service levels, which leads to higher service levels and lower inventory costs. For repairable spare parts, Smart’s Repair and Return Module accurately simulates the processes of part breakdown and repair. It predicts downtime, service levels, and inventory costs associated with the current rotating spare parts pool. Planners will know how many spares to stock to achieve short- and long-term service level requirements and, in operational settings, whether to wait for repairs to be completed and returned to service or to purchase additional service spares from suppliers, avoiding unnecessary buying and equipment downtime.

    Contact us to learn more how this functionality has helped our customers in the MRO, Field Service, Utility, Mining, and Public Transportation sectors to optimize their inventory. You can also download the Whitepaper here.


    White Paper: What you Need to know about Forecasting and Planning Service Parts


    This paper describes Smart Software’s patented methodology for forecasting demand, safety stocks, and reorder points on items such as service parts and components with intermittent demand, and provides several examples of customer success.


      Uncover data facts and improve inventory performance

      The best inventory planning processes rely on statistical analysis to uncover relevant facts about the data. For instance:

      1. The range of demand values and supplier lead times to expect.
      2. The most likely values of item demand and supplier lead time.
      3. The full probability distributions of item demand and supplier lead time.

      If you reach the third level, you have the facts required to answer important operational questions, additional questions such as:

      1. Exactly how much extra stock is needed to improve service levels by 5%?
      2. What will happen to on-time-delivery if inventory is reduced by 5%?
      3. Will either of the above changes generate a positive financial return?
      4. More generally, what service level target and associated inventory level is most profitable?

      When you have the facts and add your business knowledge, you can make more informed stocking decisions that will generate significant returns. You’ll also set proper expectations with internal and external stakeholders, ensuring there are fewer unwelcome surprises.